XMM-Newton observation of the drifting pulsar B0943+10
Abstract
Radio pulsar subpulse drifting has been interpreted as rotation of sub-beams (sparks) of pair plasma produced by intermittent breakdowns of an inner vacuum gap above the pulsar polar cap. This model also predicts strong thermal X-ray emission from the polar cap caused by inflowing particles created in spark discharges. We have observed the best-studied drifting pulsar B0943+10 with XMM-Newton and detected a point source coincident with the radio pulsar position. Its spectrum could be fitted with a thermal blackbody model, although a power-law model is also acceptable. The thermal fit gives a bolometric luminosity and a surface area , much smaller than the conventional polar cap area, . Such thermal radiation can be interpreted as emitted from footprints of sparks drifting in an inner gap of a height –, where is the polar cap radius. However, the original vacuum gap model by Ruderman and Sutherland requires some modification to reconcile the X-ray and radio data.
Subject headings:
pulsars: individual (PSR B0943+10) - stars: neutron - X-rays: stars1. Introduction
The mechanism of radio pulsar emission remains a mystery after decades of study (Melrose 2004). It is generally agreed that there exists an inner magnetospheric charge acceleration region (or inner gap) near the pulsar polar cap. Ruderman & Sutherland (1975, hereafter RS75) proposed that the gap is nearly vacuum, based on the assumption that ions cannot be stripped off the surface by the electric field component parallel to the magnetic field lines. Such an assumption was disputed by later workers (e.g., Jones 1986; Kössl et al. 1988), who argued that the surface charges can be freely supplied into the magnetosphere. The inner accelerator flow is therefore expected to be space charge limited (Arons & Scharlemann 1979; Harding & Muslimov 1998,2001,2002; Harding et al. 2002). Nevertheless, the vacuum gap model is widely used to interpret radio data. Suggestions to amend the binding energy problem have been made (e.g., Usov & Melrose 1996; Xu et al. 1999; Gil & Melikidze 2002), and some radio emission models heavily rely upon the existence of such an inner vacuum gap (e.g., Qiao & Lin 1998; Melikidze et al. 2000). To resolve this controversy, one should look for independent observational signatures of the vacuum gaps.
A distinguishing property of the vacuum gap model is its high polar cap heating rate. In this model, the vacuum gap breaks down intermittently due to pair production discharges (RS75), and the number of the outflowing particles is comparable to that of the inflowing particles, which results in a high luminosity of polar caps heated up to X-ray temperatures (e.g., Zhang et al. 2000). On the other hand, the space-charge-limited flow (SCLF) model predicts a much lower polar cap heating rate because only a small fraction of the positrons (for an electron accelerator) turn around and bombard the surface (Arons & Scharlemann 1979; Zhang & Harding 2000; Harding & Muslimov 2001,2002). Therefore, measuring the thermal X-ray luminosity from heated polar caps can provide a clue to verify the existence of the vacuum gaps.
The strongest support for the vacuum gap model comes from its ability to explain the regular sub-pulse drifting observed in some long-period, old pulsars with the so-called “conal” emission beam (Rankin 1986, and references therein). The phenomenon is naturally interpreted as the drift of polar cap “sparks” circulating around the magnetic pole (RS75). One of the best-studied drifting pulsars is PSR B0943+10 ( s, erg s-1, Myr, G). Deshpande & Rankin (1999, 2001) monitored the drifting pattern and revealed the “polar cap map” of this pulsar. They identified 20 sparks rotating counterclockwise with a period of 37 rotation periods (i.e., , where is the spin period, and is the minimum period for the drifting pattern to repeat itself), a conclusion confirmed by an analysis of low-frequency radio data (Asgekar & Deshpande 2001). The result was claimed to be consistent with the RS75 model (e.g., Deshpande & Rankin 1999, 2001; Gil & Sendyk 2003), although some modifications to the model may be needed (Gil et al. 2002; Asseo & Khechinashvili 2002; Gil et al. 2003).
According to the Galactic electron density model (Cordes & Lazio 2002), the distance to PSR B0943+10 determined from its dispersion measure (DM) is kpc. The expected high X-ray luminosity and the small distance make it the best target to test the predictions of the vacuum gap polar cap heating model. Here we report on observations of PSR B0943+10 with XMM-Newton, aimed at detecting the thermal X-ray emission from the polar cap region.
2. Observations and Data Analysis
PSR B0943+10 was observed twice with the European Photon Imaging Camera (EPIC) aboard XMM-Newton. The EPIC-pn (hereafter PN) and two EPIC-MOS (hereafter MOS) detectors were operated in extended full frame and full frame modes, respectively. Thin filters were used for all the three EPIC detectors. The initial observation of 2003 May 7 was interrupted by a strong solar flare. The exposure time for this observation, compromised by a high background, was 15 ks. Second observation was taken on 2003 December 2–3, for 20 ks. We processed the data using XMM-Newton Science Analysis Software (SAS), v. 6.0. We removed the intervals of high background and retained only patterns 0–4 and 0–12 for the PN and MOS detectors, respectively. We also applied energy filters to keep the events only in the energy range 0.5–8.0 keV. The resulting good exposure times are 24.3 ks for PN, 32.8 ks for MOS1, and 32.9 ks for MOS2.
We created a composite image using all the data (PN+MOS) in the 0.5–8 keV band. Using a modified version of the CIAO wavdetect tool111http://cxc.harvard.edu/ciao/threads/wavdetect, we found 22 point sources in the field. We searched for counterparts of the field sources in the 2MASS and USNO-B1.0 catalogs and found three matches in 2MASS and one match in USNO-B1.0, within of the X-ray source positions. (There are no other matches closer than .) Assuming these are the counterparts of the X-ray sources, we found average offsets of the X-ray with respect to optical/NIR positions of in RA and in Dec, with an rms error of about in each coordinate (which does not include the uncertainty of the X-ray source position determination). Visual inspection of the image shows a faint source at the (boresight-corrected) position , (J2000.0), with an uncertainty of about in each coordinate. The main source of the uncertainty is a large error in centroiding the very faint X-ray source. Since the separation of 27 between the X-ray source position and the radio pulsar position (, ) is smaller than the source position uncertainty, we conclude that the observed source is most likely the X-ray counterpart of the radio pulsar.
We measured background-subtracted source count rates of , , and counts ks-1 for the PN, MOS1, and MOS2 detectors, respectively. These count rates were measured in the 0.5–8 keV band within a radius aperture, which contains and 71% of total point source counts for the PN and MOS detectors, respectively.
We were unable to find a satisfactory way to combine the PN and MOS data for spectral analysis of this faint source as the responses of these detectors are very different. Since the number of source counts in the MOS data is very small, we used only the data from the most sensitive PN detector. We extracted the source+background spectrum (102 counts) for the combined PN data from a radius circle and the background from a nearby radius source-free region. We binned the spectrum to have a minimum of 10 counts per energy bin. Spectral fitting was done using the XSPEC package (v. 11.3.0).
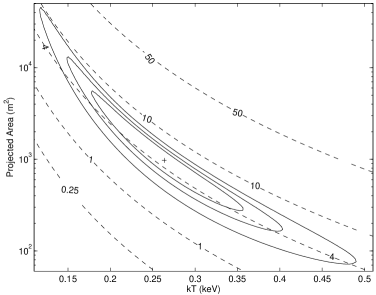
Because of the scarce count statistics, we fixed the absorbing column to the value corresponding to the pulsar’s DM (assuming 10% ionized ISM): cm-2. The spectrum fits equally well with an absorbed blackbody (BB) or an absorbed power-law (PL) model ( and 0.7, respectively, for 8 dof). The BB model gives a best-fit temperature MK and a projected emitting area of m2, corresponding to an effective radius of about m of an equivalent emitting disk, where . This thermal radiation could be interpreted as emitted from a hot polar cap; in this case the bolometric luminosity is erg s-1, where is a time-averaged cosine of the angle between the magnetic axis and the line of sight ( for the axis orientations inferred by Deshpande & Rankin 2001). The errors here and below are determined from the 68% confidence contours for joint variation of two fitting parameters. Although the strongly correlated temperature and radius vary in broad ranges, the luminosity is much more restricted, as demonstrated in the left panel of Figure 1.
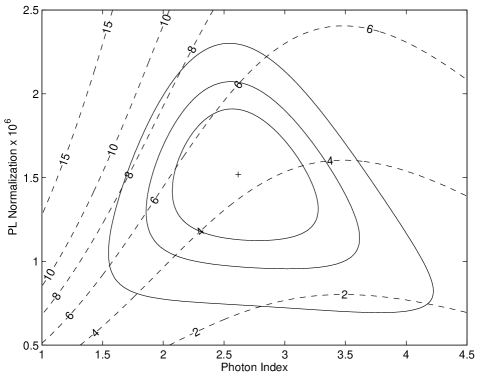
The PL model gives a photon index and a flux erg cm-2 s-1. This flux corresponds to an isotropic luminosity erg s-1.
The inferred parameters of the X-ray source do not contradict to the hypothesis that it is the counterpart of the pulsar (see §3). The most direct way to prove the identification would be detection of X-ray pulsations. Our timing analysis of the PN data (time resolution 0.2 s) did not reveal any significant signal at the pulsar’s period of 1.1 s. This result, however, is not restrictive: the radiation should be about 100% pulsed to find pulsations with only 102 counts detected in two observations separated by about 7 month (of which only about 61 counts are expected to come from the source). Thus, given the uncertainty of the spectral results and a lack of period detection, we cannot completely rule out the possibility that we detected a field X-ray source very close to the pulsar position. In this case, the above flux/luminosity estimates should be considered as upper limits.
3. Physical implications
As described in §2, the quality of the data is too poor to discriminate between the thermal (BB from a polar cap) and nonthermal (PL from the magnetosphere) spectral fits of the putative X-ray counterpart of PSR B0943+10. The photon index for the PL fit is somewhat larger than, but not inconsistent with, those observed in other pulsars (–2), given its large uncertainty (in particular, decreases if a smaller value is assumed). The luminosity found from the PL fit allows one to estimate the “X-ray efficiency” of the magnetospheric emission, . It follows from the above results that and in the 0.5–8 and 2–10 keV bands, respectively, where the distance uncertainty is included (the latter band is often used for characterization of the nonthermal pulsar radiation; e.g., Possenti et al. 2002). Although the inferred efficiency is rather high (close to the upper limit suggested by Possenti et al. 2002), it is within the range of efficiencies found recently for other old pulsars (Zavlin & Pavlov 2004).
Within the thermal interpretation of the observed radiation, particularly interesting implications follow from the comparison with the predictions of polar cap heating models, especially the vacuum gap model (RS75). In this model, a vacuum gap of height breaks down due to run-away electron-positron pair production, forming “sparks” along the magnetic field lines. A half of the relativistic particles produced in the spark discharge stream back toward the neutron star and heat the “spark footprints” on the polar cap surface. Since the strong magnetic field suppresses the heat conduction across the field lines, and the cooling timescales are very short (about a few s for a few G; Gil et al. 2003), only the spark footprints emit thermal X-rays while the rest of the polar cap remains cold. The BB fit of the observed spectrum allows one to estimate the bolometric luminosity, ergs s-1, and the total X-ray emitting area that is strongly correlated with the temperature, m2 (–5000 m2, –4.2 MK, at 68% confidence). Even the largest area allowed by the fit is much smaller than the conventional polar cap area for a dipole magnetic field, m2, where m, for a neutron star radius km. The spark footprints fill a fraction of the polar cap, with a filling factor , where ), and the factor takes into account that the magnetic field is non-dipolar (i.e., the field in the gap, , may exceed the dipolar value , and the polar cap area may be smaller than ; Gil et al. 2002, 2003). The radio sub-pulse drifting was interpreted as caused by 20 sparks drifting along the circular outer boundary of the polar cap (Deshpande & Rankin 1999,2001). Since some sparks may not be seen in the radio (but should be seen in more isotropic thermal X-rays), the total number of sparks can exceed 20 (e.g., Gil & Sendyk 2000 suggest ). A characteristic spark radius, , can be estimated as (assuming all sparks have the same size)
| (1) |
Another constraint on the gap and spark parameters comes from the comparison of the bolometric and spin-down luminosities. The bolometric polar cap luminosity can be estimated as , where is the potential drop across the gap (along the magnetic field lines), and is the Goldreich-Julian charge density. On the other hand, the total spin-down luminosity can be written as , where is the maximum possible potential drop along a magnetic field line (RS75). This gives . Using the observational value , we obtain
| (2) |
Adopting the assumption that the size of the spark is comparable to the gap height (i.e., ; Gil & Sendyk 2000), we obtain from equation (2)
| (3) |
This gives m, and m. Using this estimate for and equation (1), we obtain m2, which is consistent with the X-ray data at reasonable values of and (see Fig. 1).
Further constraints can be obtained from the drifting period. According to RS75, for sparks at the radial distance from the pole, it can be estimated as , where is the drift velocity, and is the electric field component perpendicular to the magnetic field lines at the top of the gap. In the case , is approximately uniform throughout the polar cap except for near the cap edge, (Appendix II of RS75). This means that the “inner sparks” drift very slowly, while , , and for the sparks near the cap edge. The measured thus gives , or m and m (from eq. [2]). Such a spark radius substantially exceeds the gap height, and it corresponds to the emitting area, m2, well above the range allowed by the X-ray fit. Therefore, the original vacuum gap model of RS75 can hardly be reconciled with the X-ray data. However, we cannot rule out that a modification of the RS75 model could explain both the X-ray and radio data in a consistent way. For instance, Gil et al. (2003) suggested a modification assuming thermal emission of charged particles from the polar cap surface which can partially screen the gap potential: , where is the screening parameter. In such a modified RS75 model, . For , inferred by Gil et al. for PSR B0943+10, we obtain , very close the value inferred from the X-ray data (eq. [3]). However, a more detailed study of the dynamics of a partially screened unsteady polar gap is desirable for an accurate treatment of the problem. We should also caution that the BB model used for fitting the spectrum gives only crude estimates for the area and temperature in the case of strong magnetic fields (Zavlin & Pavlov 2004). To conclude, the thermal interpretation of the X-ray data is not inconsistent with the general idea that the X-ray radiation is emitted from spark footprints, but the original vacuum gap model of RS75 needs some modification to explain both the X-ray and radio data.
The results of our X-ray observations also constrain other models. Motivated by solving the binding energy problem, Xu et al. (1999) suggested that PSR 0943+10 and other drifting pulsars might be strange quark stars covered by a very thin layer of normal matter. In this case, the heat deposited at the polar cap spreads over the entire star surface because of a high thermal conductivity of the surface layer (Xu et al. 2001). This results in a nearly uniform, low surface temperature ( MK), being inconsistent with the thermal interpretation of the observed X-ray radiation (but of course this hypothesis cannot be excluded if the observed radiation is nonthermal).
Polar cap heating in the SCLF model has been studied by Harding & Muslimov (2001,2002). Assuming a dipole field configuration near the surface, the timing parameters of PSR B0943+10 indicate that the gap is controlled by inverse Compton scattering (ICS) rather than curvature radiation (CR), and that the gap is in the “saturated” regime. Using eqs. (64) and (66) of Harding & Muslimov (2002), the predicted polar cap luminosity for this pulsar is for a resonant (non-resonant) ICS gap. Since these luminosities are much lower than observed, the SCLF model is inconsistent with the thermal interpretation of the X-ray data, but is consistent with the nonthermal interpretation. If future observations show that the X-ray radiation is, in fact, predominantly nonthermal ( ergs s-1), then the regular drifting behavior observed in PSR B0943+10 and other drifting pulsars will have to be interpreted by models other than bunched plasma sparks in the inner gap (e.g., Kazbegi et al. 1996; Wright 2003).
4. Summary
To test the existence of an inner vacuum gap in PSR B0943+10, we observed the pulsar with XMM-Newton and detected a point source at the radio pulsar position. The best-fit 0.5–8 keV band isotropic luminosity is for the PL fit, while the bolometric BB luminosity is about erg s-1. Within the thermal interpretation, the X-ray radiation is emitted from a heated area much smaller than the conventional polar cap area. In the framework of the sparking pulsar model, this implies that only spark footprints are heated up to X-ray temperatures while the rest of the polar cap remains relatively cold. The thermal model, supplemented with the results of observations of subpulse drifting, is consistent with the presence of an inner gap of a height –, and rotating sparks whose footprints fill –0.07 of the polar cap area. The thermal model disfavors the strange quark star model of PSR 0943+10, and it is also inconsistent with the SCLF polar cap heating model. Both models are, however, allowed if the spectrum is non-thermal.
The nonthermal (magnetospheric) interpretation of the observed radiation cannot be ruled out. In this interpretation, the X-ray efficiency, in the 2–10 keV band, is comparable to that of other old pulsars. Much deeper observations are required to firmly establish the nature of the X-ray radiation from PSR B0943+10.
References
- (1) Arons, J. & Scharlemann, E. T. 1979, ApJ, 231, 845
- (2) Asgekar, A. & Deshpande, A. A. 2001, MNRAS, 326, 1249
- (3) Asseo, E. & Khechinashvili, D. 2002, MNRAS, 334, 743
- (4) Cordes, J. M. & Lazio, T. J. W. 2002, astro-ph/0207156
- (5) Deshpande, A. A. & Rankin, J. M. 1999, ApJ, 524, 1008
- (6) —–. 2001, MNRAS, 322, 438
- (7) Gil, J. & Melikidze, G. I. 2002, ApJ, 577, 909
- (8) Gil, J., Melikidze, G. I. & Geppert, U. 2003, A&A, 407, 315
- (9) Gil, J., Melikidze, G. I. & Mitra, D. 2002, A&A, 388, 246
- (10) Gil, J. & Sendyk, M. 2000, ApJ, 541, 351
- (11) —–. 2003, ApJ, 585, 453
- (12) Harding, A. K. & Muslimov, A. G. 1998, ApJ, 508, 328
- (13) —–. 2001, ApJ, 556, 987
- (14) —–. 2002, ApJ, 568, 862
- (15) Harding, A. K., Muslimov, A. G. & Zhang, B. 2002, ApJ, 576, 366
- (16) Jones, P. B. 1986, MNRAS, 218, 477
- (17) Kazbegi, A., Machabeli, G., Melikidze, G. & Shukre, C. 1996, A&A, 309, 515
- (18) Kössl, D., Wolff, R. G., Müller, E. & Hillebrandt, W. 1988, A&A, 205, 347
- (19) Melikidze, G. I., Gil, J. & Pataraya, A. D. 2000, ApJ, 544, 1081
- (20) Melrose, D. 2004, in Young Neutron Stars and Their Environments (IAU Symp. 218, ASP Conf. Proc.), eds. F. Camilo and B. M. Gaensler, p.349
- (21) Possenti, A., Cerutti, R., Colpi, M. & Mereghetti, S. 2002, A&A, 387, 993
- (22) Qiao, G. J. & Lin, W. P. 1998, A&A, 333, 172
- (23) Rankin, J. M. 1986, ApJ, 301, 901
- (24) Ruderman, M. & Sutherland, P. G. 1975, ApJ, 196, 51 (RS75)
- (25) Usov, V. V. & Melrose, D. B. 1996, ApJ, 464, 306
- (26) Wright, G. A. E. 2003, MNRAS, 344, 1041
- (27) Xu, R. X., Qiao, G. J. & Zhang, B. 1999, ApJ, 522, L109
- (28) Xu, R. X., Zhang, B. & Qiao, G. J. 2001, APh, 15, 101
- (29) Zavlin, V. E., & Pavlov, G. G. 2004, ApJ, 616, 452
- (30) Zhang, B. & Harding, A. K. 2000, ApJ, 532, 1150
- (31) Zhang, B., Harding, A. K. & Muslimov, A. G. 2000, ApJ, 531, L135