Dense Cloud Ablation and Ram Pressure Stripping of the Virgo Spiral NGC 4402
Abstract
We present optical, HI and radio continuum observations of the highly inclined Virgo Cluster Sc galaxy NGC 4402, which show evidence for ram-pressure stripping and dense cloud ablation. VLA HI and radio continuum maps show a truncated gas disk and emission to the northwest of the main disk emission. In particular, the radio continuum emission is asymmetrically extended to the north and skewed to the west. The H image shows numerous HII complexes along the southern edge of the gas disk, possibly indicating star formation triggered by the ICM pressure. BVR images at resolution obtained with the WIYN Tip-Tilt Imager show a remarkable dust lane morphology: at half the optical radius, the dust lane of the galaxy curves up and out of the disk, matching the HI morphology. Large dust plumes extend upward for from luminous young star clusters at the SE edge of the truncated gas disk. These star clusters are very blue, indicating very little dust reddening, which suggests dust blown away by an ICM wind at the leading edge of the interaction. To the south of the main ridge of interstellar material, where the galaxy is relatively clean of gas and dust, we have discovered 1 kpc long linear dust filaments with a position angle that matches the extraplanar radio continuum tail; we interpret this angle as the projected ICM wind direction. One of the observed dust filaments has an HII region at its head. We interpret these dust filaments as large, dense clouds which were initially left behind as the low-density ISM is stripped, but are then ablated by the ICM wind. These results provide striking new evidence on the fate of molecular clouds in stripped cluster galaxies.
1 Introduction
The morphology-density relationship (Oemler, 1974; Melnick & Sargent, 1977; Dressler et al., 1997) is one of the clearest examples of the effect that clusters have on their member galaxies. There are several cluster processes that may contribute to this observed effect (Treu et al, 2003). Mergers, harassment (repeated high speed galaxy-galaxy interactions), and tidal truncation of the outer galactic regions by the cluster potential (Merritt, 1984; Natarajan et al, 2002) are among the suggested gravitational effects for galactic morphological transformation in clusterseffects of the intracluster medium (ICM) on the galactic interstellar medium (ISM) include ram pressure stripping (Gunn & Gott, 1972; Abadi et al, 1999), turbulent and viscous stripping (Nulsen, 1982; Toniazzo & Schindler, 2001), and the thermal evaporation of the ISM by the hot ICM (Cowie & Songaila, 1977). It is believed that ISM-ICM stripping (which includes both ram-pressure stripping and turbulent viscous stripping) may be among the most important processes in the transformation of late-type cluster spirals into Sa’s and S0’s. This process, which removes gas from the galaxy but leaves the stars unperturbed, results in galaxies with truncated gas and star-forming disks (Warmels, 1988; Cayatte et al, 1990; Koopmann & Kenney, 2004a, b). Simulations of ISM-ICM interactions (e.g. Quilis et al., 2000; Schulz & Struck, 2001; Vollmer et al, 2001) have shown that a smooth, uniform ISM can be stripped from the outer regions of galaxies in clusters via ram pressure. However, such simulations necessarily assume an overly simplistic ISM and, hence, are unable to model the multi-phase ISM as it exists in spiral galaxies. In particular, the fate of star-forming molecular clouds must be known to fully understand how stripping affects cluster galaxy evolution. Studying the details of an ISM-ICM interaction can help us learn what role gas stripping plays in the morphology-density relation. There is abundant evidence that NGC 4402 is undergoing such an interaction.
NGC 4402 is an HI-deficient, Sc galaxy located near the center of the Virgo cluster, (390 kpc projected) from the giant elliptical M87. It is also the nearest spiral galaxy to the giant elliptical M86, making it plausible that this galaxy is associated with the M86 subcluster (Schindler et al, 1999). NGC 4402 is highly inclined (), making it possible to distinguish stripped extraplanar gas from disk gas. Its line-of-sight velocity of (Rubin et al, 1999) means that it is blueshifted relative to the mean cluster velocity by nearly . This, in turn, means that the near side of the galaxy contains the leading edge of the ISM-ICM interaction, allowing us to observe key details of the ISM-ICM stripping in this galaxy. In this paper, we present new high-resolution (05) optical images, along with 21cm VLA radio maps of NGC 4402. We show that both the radio and optical data provide a strong constraint on the ICM wind direction and the optical data suggest dense cloud ablation by the ICM wind. Although present millimeter interferometers do not have the sensitivity or resolution to show what happens to giant molecular clouds in stripped galaxies, the high-resolution optical images of star formation and dust extinction suggest what may happen to large dense gas clouds in NGC 4402.
2 Observations
2.1 Radio Data
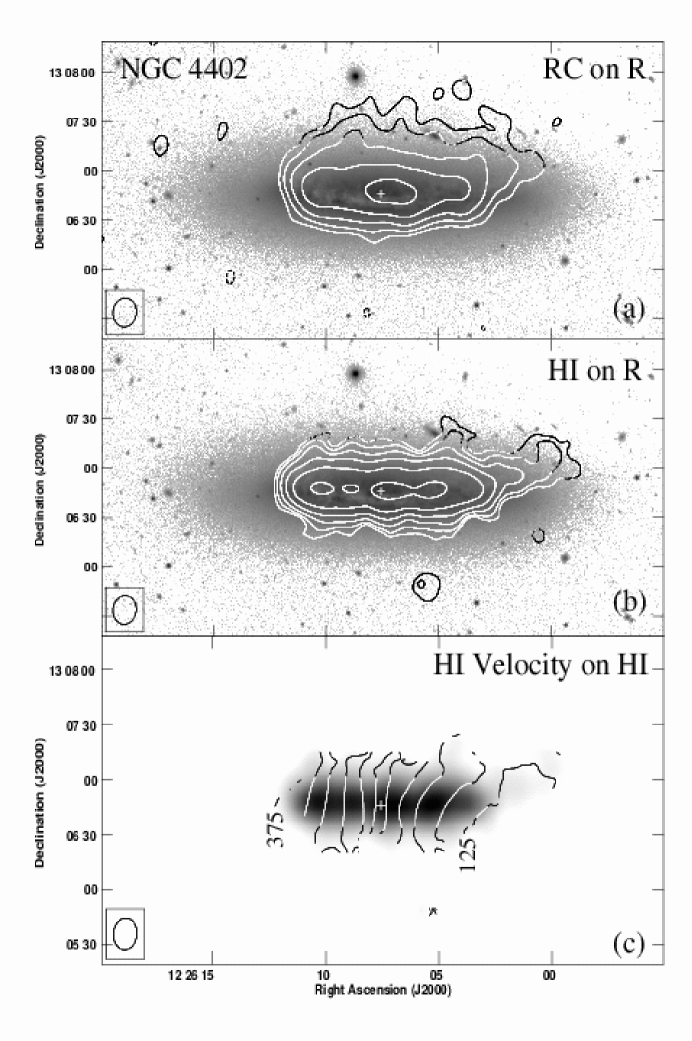
NGC 4402 was observed with the VLA111The VLA is operated by the National Radio Astronomy Observatory (NRAO) which is a facility of the National Science Foundation, operated under cooperative agreement by Associated Universities, Inc. in C array in January of 2003 as part of a study of four edge-on spiral galaxies in the Virgo cluster. We used the 21-cm spectral line mode with online Hanning smoothing and the system tuned to a central velocity of 200 km s-1. In this configuration, the system has a bandwidth of 3.125 MHz and 63 channels, each with a width of km s-1. The data were calibrated, mapped and “CLEANED” in AIPS using standard techniques and procedures. Maps were made with the IMAGR task with a ROBUST weighting parameter of +1, resulting in a beam size of (, assuming a distance of 16 Mpc). Thirty of the channels show HI emission at the level (where ). These channels were combined to make moment maps of the HI emission. Fifteen line-free channels were combined to make the continuum map. Maps of the total HI emission and radio continuum emission are shown in Figure 1. We detect a total HI flux of Jy km/s. This compares with an average single dish HI flux in the literature of Jy km/s (Giovanelli & Haynes, 1983; Helou et al, 1984; Giovanardi & Salpeter, 1985), suggesting that there is no significant flux missing in our interferometer observations. The HI mass of this galaxy as measured from our data is . This galaxy is moderately HI deficient, with a deficiency parameter of 0.61 (Giovanelli & Haynes, 1983), roughly 25% of the “normal” HI content for a galaxy in a low-density environment.
2.2 Optical Imaging Data
The optical data were taken during two separate observing runs at the WIYN telescope. The high-resolution imaging data were taken over two nights in March of 2004 using the WIYN Tip-Tilt Module (WTTM) on the WIYN 3.5m telescope. WTTM is a first-order adaptive optics system that allows us to correct the already excellent seeing at WIYN by to through use of a bright guide star (Claver et al, 2003). As a result we were able to obtain , , and images with seeing. The deep and narrowband images were taken in April of 2000 at WIYN using the MiniMosaic imager. The resulting images have an average seeing of approximately . For both data sets, standard IRAF image reduction tasks were used to bias correct, flat field and combine the images. The -band image was used to subtract the continuum emission from the narrowband image and produce an image. The MiniMosaic and images are shown in greyscale in Figures 1 & 2a, together with the HI and radio continuum contour maps. A higher resolution WTTM image is shown in Figure 2b and a color version of the higher resolution BVR image is shown in Figure 4.
3 Results
The stellar disk appears undisturbed, since outer isophotes of the R-band image are elliptical, concentric, and at a constant position angle. Within the disk, both the HI and radio continuum (Figures 1a and 1b) are truncated (i.e. no emission at a level) at (), demonstrating that the undisturbed stellar disk extends well beyond the location of the gas. Throughout the part of the disk still containing HI and radio continuum emission, heavy dust lanes are evident (Figure 2b).
The truncation radius is similar for the HI and radio continuum on the eastern edge of the galaxy (), but is more complicated in the West. If one considers only the symmetric disk components, the radio continuum and HI emission both extend to along the major axis in the West. However, there is a component of the radio continuum halo north of the major axis that extends to , and a significant component of the HI emission north of the major axis that extends to . The apparent extraplanar emission in both the HI and radio continuum maps is displaced to the northwest of the disk emission, consistent with an ICM wind acting from the SE direction, although the distributions of extraplanar emission differ. While there are many processes that may drive galactic evolution in clusters, ICM-ISM stripping is the only one that can asymmetrically strip the gas from the outer parts of a galaxy without disturbing the stars.
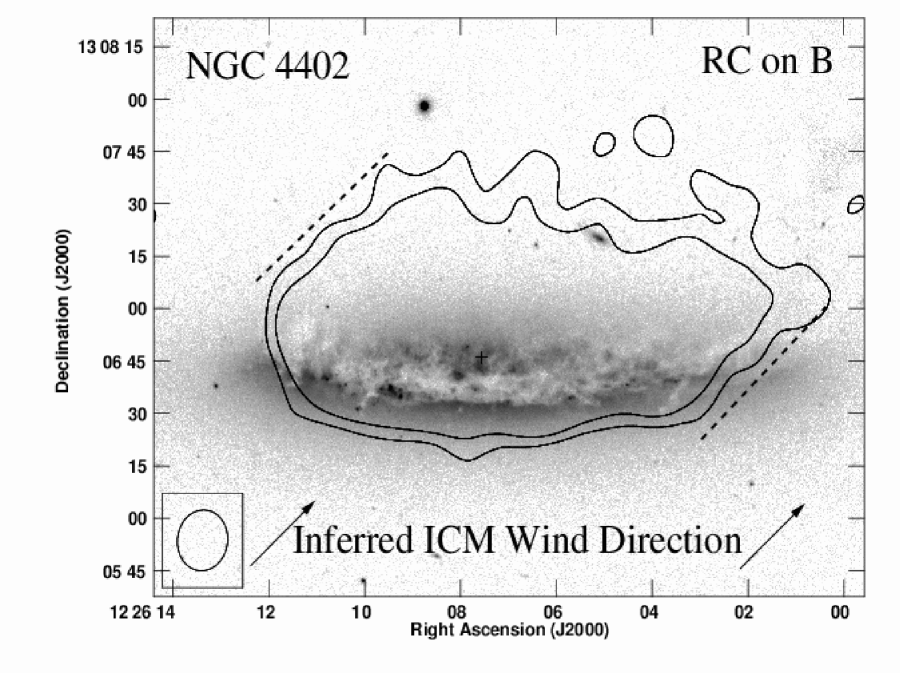
The radio continuum emission is asymmetrically extended away from the disk midplane. South of the major axis, the radio continuum contours are compressed, consistent with a marginally resolved or unresolved distribution. In contrast, north of the major axis, the radio continuum contours are stretched out, reaching at least (500 pc) to the north of the disk. North of the major axis, there is a 50% excess of radio continuum emission compared to the emission from south of the major axis. Many edge-on galaxies are observed to have extended radio continuum halos, both inside and outside of clusters (Irwin et al, 1999). The causes of these extended halos are not well understood, but are likely related to the star forming activity in the disk. Since 25% of the edge-on galaxies in the Irwin et al (1999) sample are observed to have larger radio continuum extents that NGC 4402, we cannot say with certainty that the large extent of the northern radio continuum halo is due to the ICM wind. However, what is clearly unusual about the radio continuum halo in NGC 4402 is the large asymmetry on the two sides of the major axis and a clear skewing of the northern radio continuum halo toward the NW. Figures 1a & 3 show that the 2 sides of the radio continuum tail form fairly sharp ridges with well-determined position angles of (east) and (west). These relatively sharp boundaries may be indicative of the projected ICM wind direction. No other edge-on galaxy in the Irwin et al (1999) sample show such an asymmetry or skew.
The HI map (Figure 1b) shows 2 possible extraplanar features, a small one (3.9 kpc) W and (3.1 kpc) N of the nucleus, apparently lying above the main disk HI emission, and a larger curved feature extending for beyond the Western disk truncation radius, lying N of the major axis. The velocity structure of these components can be seen in the Moment 1 map (Figure 1c). The gas to the north of the disk has a higher line of sight velocity (and lower galactocentric velocity) by than the corresponding disk gas along the major axis. We can put an upper limit on the amount of extraplanar HI by assuming the disk emission is symmetric about the major axis, and subtracting a disk component from regions north of the major axis. Approximately 6% of the total HI flux (0.40 Jy km/s) is outside of the symmetric disk, corresponding to . This “extraplanar” HI fraction and mass are much lower than the 40% and 1.5 detected in the highly inclined Virgo spiral NGC 4522 (Kenney et al, 2004), a good candidate for ongoing stripping. The 6% excess of HI flux is also significantly lower than the 50% excess of radio continuum emission north of the major axis in NGC 4402.
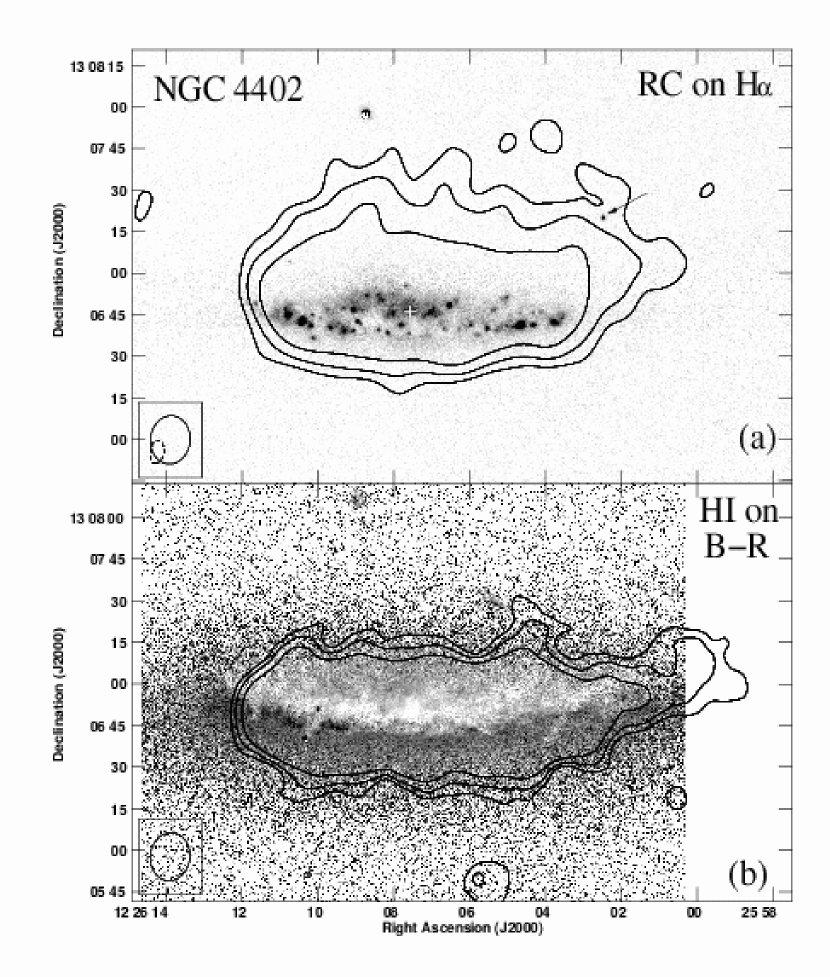
The total H luminosity of the galaxy is , which corresponds to a SFR of , whereas the FIR luminosity from IRAS fluxes (Soifer et al, 1989) corresponds to a SFR of . The FIR-based SFR is unsurprisingly higher for this dusty, highly-inclined galaxy, but the H image still shows a large fraction of the star formation activity in the galaxy. The emission (Figure 2a) is strong along the southern edge of the galaxy. Asymmetric H enhancements at the gas truncation radius have been observed in other galaxies in Virgo and other clusters (Koopmann & Kenney, 2004b; Vogt et al, 2004), and interpreted as a sign of ongoing pressure. H emission from star-forming complexes is strong in both the SE and SW, but the complexes in the SE are much bluer in the and color images (Figures 2b & 3). It appears that the SE star clusters suffer less dust reddening and extinction because the ICM wind has pushed away much of the dust at the leading edge of the galaxy, an interpretation supported by the dust plumes extending upward from the SE star forming regions. This provides evidence that the SE region, opposite the NW radio continuum tail, is the leading edge of the interaction.
Our H image (Figure 2a) also shows the recently-discovered extraplanar HII region northwest of the main disk (Cortese et al, 2004), which likely formed from stripped gas. This HII region is located within the extraplanar radio continuum tail, and close to, but not coincident with the “extraplanar” HI. Approximately 0.3% of the total H luminosity is from this extraplanar HII region, much lower than the extraplanar H fraction of 10% in NGC 4522 (Kenney et al, 2004).
The HI and radio continuum distributions are different, indicating that they trace different components of the ISM. HI emission traces the warm, neutral medium and non-thermal radio continuum emission traces relativistic electrons spiraling in magnetic fields, perhaps produced by supernovae resulting from recent star formation. The HI is more extended than the radio continuum along the major axis in the west. This could simply be the result of the low radio continuum to HI ratio generally observed in the outer disks of spirals, due to the low efficiency of outer disk HI in forming stars (Kennicutt, 1989). Consequently, there are few products of star formation, including radio continuum emission, in outer disk gas. Figure 2a shows that the radio continuum emission in the disk is co-extensive with regions of star formation along the major axis, and that the westernmost HI has no associated HII regions. In the north, the radio continuum emission is more extended than the HI along the minor axis, as discussed below.
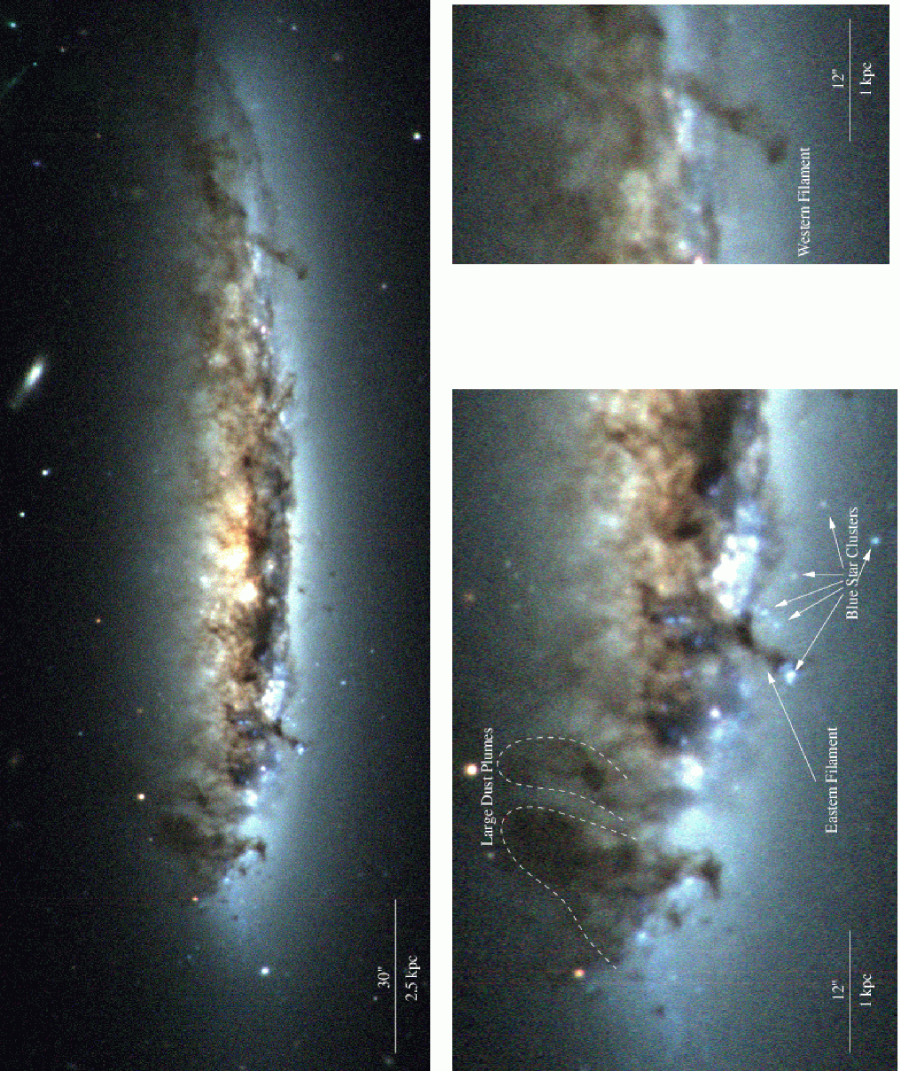
The high-resolution images of the dust lanes seen in the image (Figure 2b) and BVR color image (Figure 4) are especially striking. The strongest dust lanes are across the southern part of the stellar disk, indicating that the southern side of the galaxy is the near side. The color image (Figure 4) shows that the galaxy starlight south of the main dust band is relatively blue, while, in the north, it is significantly reddened by the displaced dust. This is opposite what is normally observed in undisturbed galaxies, where the near side of the galaxy appears to be more reddened. The and images show a fairly well-defined boundary between the region of NGC 4402 that still contains large amounts of dust, and the region that has been swept mostly clean. There are very few dust extinction features observed south of the main boundary. While dust is an excellent ISM tracer, we can only observe it via optical extinction if the dust is in front of most of the stars. Therefore, the lack of dust extinction features south of the main truncation boundary indicate that there is very little dust above or near the midplane of the outer southern stellar disk. Heavy dust lanes are evident throughout that part of the disk still containing HI and radio continuum emission. In both the east and the west, at the HI truncation radii, the dust lanes curve up and away from the plane of the stellar disk. The departure from the disk is more gradual in the west, and more pronounced in the east, similar to the radio continuum and HI distributions. In the East/Southeast, which we think may be the leading edge of the gas disk, the dust features curve upward from the luminous star forming complexes for at least =1.5 kpc. The map (Figure 2b) shows that the HI contours appear to cut off inside the dust distribution, suggesting that the less dense gas in this part of the galaxy has already been stripped.
4 Discussion
The sharpness of the southern boundary in the three color image (Figure 4) reveals important information on how the multi-phase ISM reacts to ICM pressure. In the HI map (Figure 1b), the southern boundary is not smooth, but featured, perhaps due to ISM structure within the disk. The optical image shows that the region south of the main ISM boundary contains a few faint dust features and young blue star clusters. The most remarkable dust features south of this boundary are 2 linear dust filaments, shown in Figure 4, with widths of 1-2” (80-150 pc), and lengths of (0.5 kpc) and (1.0 kpc), respectively. These 2 filaments have nearly the same position angle ( in the east and in the west) and point roughly in the same direction as the radio continuum tail, indicating that their morphology is associated with the ICM wind direction. The eastern filament shows two pieces of additional evidence of dense gas. First, there is a star formation region that appears to be associated with the head of the filament. Near the eastern dust filament, there are several () additional blue star clusters that are also south of the main truncation edge. Secondly, there is a weak feature in the HI map possibly associated with that filament. We can estimate lower limits on the gas column densities, , and gas masses of these filaments using the relative extinction of dust features (Howk & Savage, 1997). The eastern dust filament has an average relative extinction of over an area of 6.5 arcsec2 ( pc2) and the western filament has an average relative extinction of over an area of 13 arcsec2 ( pc2). Assuming a ratio of total to selective absorption of , and using the method of Howk & Savage (1997), we find both the eastern and western dust filaments have . This is a strict lower limit, since foreground stars (which are numerous if the filament head is near the disk midplane) and small dense lumps in the filaments can cause us to underestimate the extinction, making the true cloud mass higher.
Extraplanar dust filaments have been observed in many galaxies both inside and outside of galaxy clusters (Howk & Savage, 1999; Alton et al, 2000). In many cases, these filaments are associated with fountains of gas and dust driven by star formation in the disk. In NGC 4402, there are several different types of dust features observed. The most prominent, perhaps, is the large plume of dust (with dimensions x x ) and other dusty clumps north of the minimally reddened star clusters in the East. Once again using the method shown in Howk & Savage (1997), we can put lower limits on the mass of the two largest dust plumes (outlined in the close-up image of Figure 4). The large plume furthest to the East has a mass of and the plume west of it has a mass of . West of the eastern dust plumes and north of the main dust band, we observe a complex filamentary structure similar to those observed in other galaxies. These structures are similar in morphology to the “Irregular Clouds” and “Arcs” observed in NGC 891 (Howk & Savage, 2000), and are likely due to star formation activity in the disk. Finally, west of the minor axis and beyond, there are long, curved, smooth dust features. The lack of strong star formation at this location has apparently left these dust features undisturbed. The filaments observed south of the disk in NGC 4402 (described above), which we believe are not caused by star formation, are different in several ways. First, the two large filaments that we have observed are linear. By contrast, filaments observed in other galaxies (i.e. NGC 891, NGC 3628) and north of the disk of NGC 4402 have more complex morphologies with significant substructure and curvature, and a large variety of position angles. This is the morphology that one would expect of dust ejected out from different star forming regions and falling back to the disk via gravity. Secondly, there is very little dust observed in the region of the filaments south of the boundary, suggesting that the area has been swept relatively clean of the less-dense dust. Finally, the filaments are aligned with each other, and with the radio continuum tail.
The most straightforward interpretation of the observed southern filaments is that they are dense clouds in the disk midplane being ablated by the hot ICM wind. We propose that the southern tips of these filaments are not extraplanar, but are the remnants of dense clouds in the disk, which has otherwise been swept mostly clear of its ISM. If this is true, then the “tails” of these filaments are extraplanar, swept up by the ICM wind. This suggests that some clouds, probably the biggest and densest giant molecular clouds, do not get stripped out together with the rest of the lower density ISM, but are left behind, at least initially. Although we do not have direct evidence of molecular gas, the sizes (80-150 pc) and masses () of these clouds are consistent with the largest giant molecular clouds in our galaxy (Dame et al, 1986) or the cores of Giant Molecular Associations (GMAs) (with typical sizes of pc (Vogel et al, 1988)). In a typical spiral, over a small galactocentric annulus, there are very few of these largest clouds. If these are the remnants of GMAs, it is not surprising that they survived longer than any other ISM tracer. If the observed dust clumps are GMAs/GMCs being ablated, one would expect to see head-tail features from ablation with a variety of sizes, reflecting the GMA/GMC mass spectrum. With our observations at resolution, we can only see the most massive features. Higher resolution observations may show a continuum of structure from south to north across the disk: smaller molecular clouds may be visible at smaller galactic radii. The blue star clusters in the SE are perhaps the remnants of these other molecular cloud cores. Calculations show that molecular clouds are too dense by at least a factor of 10 to be directly stripped by ram pressure in a cluster like Virgo (Kenney & Young, 1989; Kenney et al, 2004). Our observations of NGC 4402 suggest that while some clouds may survive the initial stripping, they are eventually destroyed by the ICM wind, probably aided by star formation and normal cloud evolution, which act themselves on timescales of yrs (Larson, 2003) to destroy molecular clouds. The cloud is ablated in an outside-in manner: the outer, less-dense, parts of the clump of material are stripped off first. This material then streams behind the clump to form a head-tail morphology. In the eastern filament, this wind has either triggered star formation, or ablation has exposed an already-existing star-forming region. At the leading edge of the disk, molecular clouds can probably be triggered to form stars by ISM pressure. While a fraction of the cloud mass is converted into newly formed stars, most will be returned to the lower density ISM by the destructive energy of the young stars (Larson, 2003), where it can be more easily stripped.
An important parameter in systems such as NGC 4402 is the stage of the ISM-ICM interaction. In the case of NGC 4402, the optical image provides compelling evidence of an ongoing interaction. Specifically, the upward swirl of dust from minimally reddened luminous star clusters at the gas truncation radius in the SE, the aligned linear dust filaments just beyond the gas truncation radius, and the extended and skewed radio continuum halo all strongly suggest that NGC 4402 is currently experiencing ICM pressure. This pressure is apparently strong enough to disturb the radio halo, ablate the molecular cloud cores, and push dust up into the halo of the galaxy. However, simulations of ram pressure stripping (Quilis et al., 2000; Schulz & Struck, 2001; Vollmer et al, 2001) show significant amounts of extraplanar gas close to the disk in the early phases of stripping. Although 75% of the original HI is missing, there is very little extraplanar HI near the disk of NGC 4402, in contrast to NGC 4522 (Kenney et al, 2004), where 40% of the HI is extraplanar. This result seems at odds with a near-peak ram pressure scenario. The seemingly conflicting results yield two possible explanations: 1. The galaxy is in an early phase of stripping, but the stripped extraplanar gas is no longer in the form of HI. The gas has become ionized shortly after leaving the disk so that it no longer appears in the HI phase. Indeed, heating and ionization must happen at some point, since this galaxy is quite HI deficient. If this is correct, we would expect diffuse and X-Ray emission from this heated and ionized gas. In this scenario, the NW radio continuum tail may be tracing the general ISM stripped from the disk of NGC 4402. 2. The galaxy is in a significantly later phase of stripping. Much of the outer-disk HI has been pushed far away from the disk, but the galaxy is still experiencing pressure. If the galaxy is in a later phase of stripping, the dearth of HI is expected. In fact, this is in line with the later stages of simulations of ram pressure (Schulz & Struck, 2001; Vollmer et al, 2001), which show that after 100-500 Myrs, the pressure results in a truncated gas disk with little or no extraplanar gas near the galaxy. Other simulations (Quilis et al., 2000) have shown that viscous and turbulent stripping (Nulsen, 1982) can be important over larger timescales and, therefore, may become more important than ram pressure at times following peak pressure. So, while bulk ram-pressure stripping of the neutral gas may have occurred long ago, ongoing viscous and turbulent stripping may continue to strip gas from the edge of the disk well after peak pressure. In this scenario, the large vertical extent of the northern radio continuum emission does not arise from the stripping of disk gas, but is a predominantly normal radio continuum halo (i.e. Irwin et al, 1999) shaped by the ICM wind, which compresses the halo in the south-east and extends it to the north-west, giving the halo its asymmetry and skew.
To determine if our interpretations are realistic, we have made order-of-magnitude calculations of the internal pressure in the galaxy and the pressure from the ICM wind. If the radio continuum halo can be shaped by the ICM wind, the ICM wind pressure must be at least as large as the cosmic ray energy density, as cosmic rays are the source of the radio continuum halo. Assuming a spectral index of (Vollmer et al, 2004) and measuring the radio continuum surface brightness in a small region near the truncation radius, we estimate the cosmic ray energy density to be ergs cm-3, using the method outlined in Irwin et al (1999). This is a lower limit of the cosmic ray energy density, as the effective emitting volume is likely smaller than the total volume along the line of sight. The strength of the ICM wind depends on the density of the ICM and the relative velocity of the ICM and NGC 4402. From X-Ray surface brightness measurements (Schindler et al, 1999), the ICM density is estimated to be at a cluster radius of Mpc. With this density and a typical galaxy velocity of 1300 km/s (Binggeli et al., 1993), the ICM ram pressure would be dynes cm-2. The true ram pressure could be higher or lower than this. The ICM density and, therefore, the ram pressure could be lower, since NGC 4402’s clustercentric distance is probably higher than its projected distance. In contrast, the ram pressure could be higher if the ICM has bulk motions (Dupke & Bregman, 2001) and the motion of the galaxy with respect to the ICM is much higher than galaxy velocity dispersions indicate (Kenney et al, 2004). Even with these uncertainties, it seems reasonable that the present ram pressure is strong enough to disturb the radio continuum halo.
The ICM pressure needed to strip neutral gas from the disk is significantly larger than that needed to disturb the radio continuum halo. The pressure needed to strip neutral gas can be estimated by considering the gravitational restoring force for a region of the galaxy (see NGC 4522, Kenney et al, 2004). Since NGC 4522 and NGC 4402 are similar in luminosity and , it is reasonable to compare them. However, since the gas truncation radius in NGC 4402 (0.6-0.7 kpc) is larger than that of NGC 4522 (0.4 kpc), the R-band surface brightness and the disk mass surface density at the truncation radius is lower by a factor of two. For a gas surface density of pc-2 and an encounter angle of , the gravitational restoring force per unit area is dynes cm-2. This is larger by a factor of 3 than the above estimate of the ICM ram pressure for a static ICM and larger by a factor of 20 than the pressure needed to disturb the radio continuum halo. As mentioned above, turbulent and viscous stripping may be an important effect that has not been considered in these simple calculations. Such an effect should be most important near the edge of the galactic disk, which is where the largest disturbances of dust are observed in the optical image (Figure 4).
Gas infall can occur, either with large amounts of gas after peak pressure (Vollmer et al, 2001), or with a small amount of gas in a constant ram pressure scenario (Schulz & Struck, 2001). Thus, we have considered whether the observations, particularly the linear dust filaments, might be due to gas infalling after peak pressure. In scenarios such as these, one could, in principle, produce head-tail gas/dust features. However, an infall scenario does not easily account for the following observations: 1. The alignment of the filaments with each other and with the radio continuum tail. If the filaments were infalling, one would expect them to fall back in the direction of the disk and galactic center and to have orientations that reflect this. In particular, the alignment of the filaments on opposite sides of the galaxy is not consistent with this, and therefore not easily explained by gas fallback. 2. The proximity of the SE linear filament, with the HII region at its head, to the minimally-reddened SE disk star forming regions and the blue star clusters. Additionally, an upward swirl of dust from other star forming complexes is evident at this location. By contrast, these observations are naturally explained by ongoing ICM pressure and dense cloud ablation.
These observations of NGC 4402 have furthered our understanding of ram pressure stripping in clusters, and have allowed us to question more deeply the nature of these processes. We have learned that: 1. Not all dense clouds are strongly coupled to the lower-density ISM, and it seems possible to strip low-density gas without stripping the dense clouds. 2. These dense clouds do not survive indefinitely and are eventually ablated by the ICM wind. It is clear that NGC 4402 is currently experiencing a wind pressure strong enough to distort the radio continuum halo and ablate the dense clouds in the disk. However, our observations raise interesting questions on the timescales over which these processes happen. Specifically: 1. Is active stripping of the neutral gas in the disk occurring now? 2. When was the outer disk of NGC 4402 stripped? 3. On what timescales are molecular clouds destroyed by ablation? Further observations to constrain the ages of stars in the outer stellar disk may allow us to better determine the stripping history of this galaxy. Despite timescale uncertainties, it is clear that molecular clouds do not prevent the entire ISM of a galaxy from being stripped. This makes it feasible that the cessation of star formation and subsequent disk fading in cluster spirals stripped by ram pressure contributes to the transformation of these galaxies into early type spirals and lenticulars.
We gratefully acknowledge Richard Rand for helpful discussions, Gene McDougal and the rest of the WIYN staff for effective and efficient observing support, and Mark Hanna of NOAO for assistance in the creation of a color image. We also gratefully acknowledge the referee, Curt Struck, for helpful comments which improved the paper. This is research supported by NSF grants AST-0071251 and AST-0098294.
References
- Abadi et al (1999) Abadi, M.G., Moore, B. & Bower, R.G. 1999, MNRAS, 308, 947
- Alton et al (2000) Alton, P.B., Rand, R.J., Xilouris, E.M., Bevan, S., Ferguson, A.M., Davies, J.I., & Bianchi, S. 2000, A&AS, 145, 83
- Binggeli et al. (1993) Binggeli, B., Popescu, C. C., & Tammann, G. A. 1993, A&AS, 98, 275
- Cayatte et al (1990) Cayatte, V., van Gorkom, J. H., Balkowski, C., & Kotanyi, C. 1990, AJ, 100, 604
- Claver et al (2003) Claver, C. F., Corson, C., Gomez, R. R., Jr., Daly, P. N., Dryden, D. M., & Abareshi, B. 2003, SPIE, 4837, 438
- Cortese et al (2004) Cortese, L., Gavazzi, G., Boselli, A. & Iglesias-Paramo, J. 2004 A&A, 416, 119
- Cowie & Songaila (1977) Cowie, L.L., & Songaila, A. 1977, Nature, 266, 501
- Dame et al (1986) Dame, T.M., Elmegreen, B.G., Cohen, R.S., & Thaddeus, P. 1986, ApJ, 309, 892
- Dressler et al. (1997) Dressler, A., et al. 1997, ApJ, 490, 577
- Dupke & Bregman (2001) Dupke, R. A., & Bregman, J. N. 2001, ApJ, 562, 266
- Giovanardi & Salpeter (1985) Giovanardi, C. & Salpeter, E. E. 1985, ApJS, 58, 623
- Giovanelli & Haynes (1983) Giovanelli, R. & Haynes, M.P. 1983, AJ, 88, 881
- Gunn & Gott (1972) Gunn J.E. & Gott, R.J. 1972, ApJ, 176, 1
- Howk & Savage (1997) Howk, J.C. & Savage, B.D. 1997, AJ, 114, 2463
- Howk & Savage (1999) Howk, J.C. & Savage, B.D. 1999, AJ, 117, 2077
- Howk & Savage (2000) Howk, J.C. & Savage, B.D. 2000, AJ, 119, 644
- Helou et al (1984) Helou, G., Hoffman, G.L., & Salpeter, E.E. 1984, ApJS, 55, 433
- Irwin et al (1999) Irwin, J.A., English, J., Sorathia, B. 1999, AJ, 117, 2102
- Kenney et al (2004) Kenney, J.D.P., van Gorkom, J.H., & Vollmer, B. 2004, AJ, 127, 3361
- Kenney & Young (1989) Kenney, J.D.P. & Young, J. 1989, ApJ, 344, 171
- Kennicutt (1989) Kennicutt, R.C., Jr. 1989, ApJ, 344, 685
- Koopmann & Kenney (2004a) Koopmann, R.A. & Kenney, J.D.P. 2004a, ApJ, 613, 851
- Koopmann & Kenney (2004b) Koopmann, R.A. & Kenney, J.D.P. 2004b, ApJ, 613, 866
- Larson (2003) Larson, R. B. 2003, Reports on Progress in Physics, 66, 1651
- Melnick & Sargent (1977) Melnick, J. & Sargent, W.L.W. 1977, ApJ, 215, 401
- Merritt (1984) Merritt, D. 1984 ApJ, 276, 26
- Natarajan et al (2002) Natarajan, P., Kneib, J., & Smail, I. 2002, ApJ, 580, L11
- Nulsen (1982) Nulsen, P.E.J. 1982, MNRAS, 198, 1007
- Oemler (1974) Oemler, A. 1974, ApJ, 194, 1
- Quilis et al. (2000) Quilis, V., Moore, B., & Bower, R. 2000, Science, 288, 1617
- Rubin et al (1999) Rubin, V.C., Waterman, A.H., & Kenney, J.D.P. 1999, AJ, 118, 236
- Schindler et al (1999) Schindler, S., Binggeli, B., & Böhringer, H. 1999, A&A, 343, 420
- Schulz & Struck (2001) Schulz, S. & Struck, C. 2001, MNRAS, 328, 185
- Soifer et al (1989) Soifer, B.T. Boehmer, L., Neugebauer, G. & Sanders, D.B. 1989, AJ, 98, 766
- Toniazzo & Schindler (2001) Toniazzo, T. & Schindler, S. 2001, MNRAS, 325, 509
- Treu et al (2003) Treu, T., Ellis, R.S., Kneib, J-P., Dressler, A., Smail, I, Czoske, O., Oemler, A. & Natarajan, P. 2003, ApJ, 591, 53
- Vogel et al (1988) Vogel, S.N., Kulikarni, S.R., & Scoville, N.Z. 1988, Nature, 334, 402
- Vogt et al (2004) Vogt, N. P., Haynes, M. P., Giovanelli, R., & Herter, T. 2004, AJ, 127, 3300
- Vollmer et al (2001) Vollmer, B., Cayatte, V., Balkowski, C., & Duschl, W.J. 2001, ApJ, 561, 708
- Vollmer et al (2004) Vollmer, B., Thierbach, M., & Wielebinski, R. 2004, A&A, 418, 1
- Warmels (1988) Warmels, R. H. 1988, A&AS, 72, 19