Understanding galaxy formation with ISO deep surveys
Abstract
We present the results obtained through the various ISO extragalactic deep surveys. While IRAS revealed the existence of galaxies forming stars at a rate of a few tens (LIRGs) or even hundreds (ULIRGs) solar masses in the local universe, ISO not only discovered that these galaxies were already in place at redshift one, but also that they are not the extreme objects that we once believed them to be. Instead they appear to play a dominant role in shaping present-day galaxies as reflected by their role in the cosmic history of star formation and in producing the cosmic infrared background detected by the COBE satellite in the far infrared to sub-millimeter range.
keywords:
Deep surveys - infrared - galaxy formationguessConjecture {article} {opening}
1 General perspective
It is widely accepted that in the local universe stars form in giant molecular clouds (GMCs) where their optical and mostly UV light is strongly absorbed by the dust which surrounds them. Whether extinction was already taking place in the more distant universe where galaxies are less metal rich was less obvious ten years ago. Galaxies forming stars at a rate larger than about 20 M⊙ yr-1 were known to radiate the bulk of their luminosity above 5 m thanks to IRAS, the so-called luminous (LIRGs, 12 LIR 11) and ultra-luminous (ULIRGs, LIR 12) infrared (IR) galaxies. In the past, when galaxies were more gaseous and formed the bulk of their present-day stars, it would have been logical to expect to detect the past star formation events of galaxies in the IR regime and to detect a large population of LIRGs/ULIRGs too. However, prior to the launch of the Infrared Space Observatory (ISO, Kessler et al.1996), this idea was not widely spread. Partly because of a cultural reason: star formation rates (SFR) were commonly measured from optical emission lines and rest-frame UV light in galaxies. This may explain why the redshift evolution of the SFR density per unit comoving volume computed by Madau et al.(1996) became famous. However in the first presentation of the density of UV light per unit comoving volume (Lilly et al.1996) the authors were cautious to avoid converting their UV light into a SFR because of the unknown factor to correct for extinction. Already IRAS observations indicated a rapid decline of the comoving number density of ULIRGs since 0.3 (Kim & Sanders 1998, see also Oliver et al.1996), but this was over a small redshift range and with small number statistics. In the few years that followed the launch of ISO, several observations showed that galaxy formation could not be understood, at least on an observational basis, without accounting for dust extinction as a major ingredient. The ISO deep surveys played a major role in this process, together with other results summarized below. They clearly established that extreme events such as those taking place in local LIRGs and ULIRGs must have been more common in the past, so much that they can now be considered as a standard phase that most galaxies experienced during their lifetime, at least once, but maybe even several times.
The first result of the ISOCAM surveys, as well as the ISOPHOT ones, was the great difference of the counts measured at faint flux densities with respect to local ones from IRAS (Elbaz et al.1999, Dole et al.2001). The universe must have been much richer in IR luminous galaxies in the past, either because galaxies were more IR luminous, at fixed galaxy density, and/or because the number density of galaxies was larger in the past, which was partly expected due to the reverse effect of hierarchical galaxy formation through mergers. The strength of the excess of faint objects came as a surprise, but its consequences on the past star formation history of galaxies was confirmed by the convergence of other observations going in the same direction:
- the nearly simultaneous discovery of the cosmic infrared background (CIRB, Puget et al.1996, Fixsen et al.1998, Hauser & Dwek 2001 and references therein), at least as strong as the UV-optical-near IR one, whereas local galaxies only radiate about 30 % of their bolometric luminosity in the IR above 5 m .
- the 850 m number counts from the SCUBA sub-millimeter bolometer array at the JCMT (Hughes et al.1998, Barger et al.1998, Smail et al.2002, Chapman et al.2003, and references therein) which also indicate a strong excess of faint objects in this wavelength range, implying that even at large redshifts dust emission must have been very large in at least the most active galaxies.
- the most distant galaxies, individually detected thanks to the photometric redshift technique using their Balmer or Lyman break signature showed the signature of a strong dust extinction. The so-called “-slope” technique (Meurer et al.1999) used to derive the intrinsic luminosity of these galaxies and correct their UV luminosity by factors of a few (typically between 3 and 7, Steidel et al.1999, Adelberger & Steidel 2000) was later on shown to even underestimate the SFR of LIRGs/ULIRGs (Goldader et al.2002).
- the slope of the sub-mJy deep radio surveys (Haarsma et al.2000).
It has now become clear that the cosmic history of star formation based on rest-frame UV or emission line indicators of star formation such as [0II] or [H] strongly underestimate the true activity of galaxies in the past if not corrected by strong factors due to dust extinction. Although distant galaxies were less metal rich and much younger, they must have found the time to produce dust rapidly in order to efficiently absorb the UV light of their young stars.
We have tried to summarize in the following the role played by the ISO deep surveys in establishing this new perspective (see also Genzel & Cesarsky 2000). However, ten years after ISO’s launch we are still trying to understand the consequences of these findings on galaxy formation scenarios. Are these distant LIRGs really similar to local ones ? What do they teach us about the connection between star and galaxy formation on one side (IMF, triggering of star formation, conditions of star formation,…) and between galaxy and large-scale structure formation on the other side (role of the environment in triggering star formation events, galaxy versus group and cluster formation, ellipticals versus spirals, …) ? How much energy radiated by compton thick embedded active nuclei remains undetected even by the Chandra and XMM-Newton X-ray observatories ? These questions together with others that will be discussed in the following demonstrate the liveliness of this field that will continue to feed the next generation of telescopes and instruments to come such as Herschel, ALMA, the James Webb Space Telescope (JWST) or the Spitzer and GALEX space observatories presently in use.

2 The ISO surveys

Extragalactic deep surveys with ISO were performed in the mid and far IR with ISOCAM (Cesarsky et al.1996) and ISOPHOT (Lemke et al.1996) respectively. In both wavelength ranges, the steep slopes of the number counts indicate that a rapid decline of the IR emission of galaxies must have taken place from around 1 to 0. As shown in Fig. 1, ISOCAM could detect galaxies at 15 m in the LIRG regime up to 1.3, while ISOPHOT was limited to either nearby galaxies or moderately distant ULIRGs such as the one of LIR L⊙ at a redshift of =1 shown in the Fig. 1 (normalized SED of Arp 220). The detection limits of ISOCAM and ISOPHOT are compared to SCUBA and Spitzer in the Fig. 2. The deepest ISO surveys reached a completeness limit of 0.1 mJy at 15 m (plain line) and a depth of 40 Jy (incomplete, Aussel et al.1999) in blank fields or a twice deeper completeness level in the central part of nearby galaxy clusters using lensing magnification (Altieri et al.1999, Metcalfe et al.2003), and 120 mJy at 170 m (dotted line). The right axis on the plot shows the conversion of the IR detection limit into a SFR detection limit. Any galaxy forming stars at a rate larger than 30 M⊙ yr-1 could be detected with ISOCAM up to 1, assuming that the measured 15 m flux density of a galaxy can be used to derive its “bolometric” IR luminosity, i.e. LIR =L(8-1000 m ) (see Sect. 5.2).
Number counts represent the first scientific result of an extragalactic survey. They can be used to constrain the models. Used alone, they leave some degeneracies unsolved but at least they can demonstrate whether the distant universe was different from the local one in this wavelength range by comparing them to “no evolution” predictions assuming some spectral energy distributions (SEDs) for the k-correction.
3 The ISOCAM 6.75 m deep surveys
Deep images of blank fields at 6.75 and 15 m done with ISOCAM provide a different view on the distant universe. While the ISOCAM-LW3 filter, centered at 15 m , can probe dust emission up to 2 for luminous objects, the redshift range to probe star formation from dust emission with the ISOCAM-LW2 band, centered at 6.75 m , is limited to the relatively nearby universe due to k-correction. However the emission of the old stellar component, which peaks in the near IR, being brought to this wavelength range for high- galaxies, their stellar masses are better constrained from this flux density.
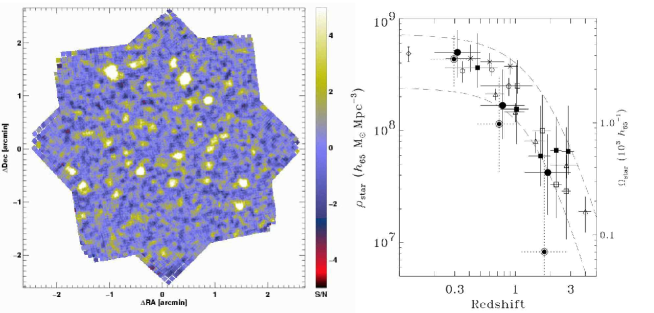
Sato et al.(2004) derived stellar masses around 1011 M⊙ for galaxies with 0.2-3 from the correlation between rest-frame near IR luminosity and stellar mass. The stellar mass-to-light ratios were derived from model fit of the set of observed magnitudes depending on the galaxies star formation histories.
The contribution of the 6.75 m selected galaxies to the cosmic stellar mass density of galaxies per unit comoving volume as a function of redshift were estimated to be comparable to those inferred from observations of UV bright galaxies (see Fig. 3). Given the narrow mass ranges, these estimates were obtained as simple summations of the detected sources and should therefore be considered as lower limits only. The faint 6.7 m galaxies generally had red colors. A comparison with a particular population synthesis model suggests that they have experienced vigorous star formation at high redshifts. The derived large stellar masses for the faint 6.7 m galaxies also support such star forming events at the past. However these events can only be detected at longer wavelengths using the 15 m ISOCAM or 90 and 170 m ISOPHOT bands with ISO (or SCUBA at 850 m and now the Spitzer Space Telescope). The next sections are devoted to these surveys and their consequences on our understanding of the history of star formation in the universe.
4 The ISOPHOT far IR deep surveys
ISOPHOT was used to survey the sky at 90 and 170 m , mainly (plus a few surveys at 60, 120, 150 and 180 , see Juvela et al.2000; Linden-Voernle et al.2000; cf review by Dole 2002). At 90 m , the 46 arcseconds pixels and FWHM of ISOPHOT represented a significant improvement with respect to IRAS, however due to k-correction and sensitivity limitations, only the local universe could be probed at such wavelengths. The 170 m band was more favorable for the detection of distant ULIRGs as shown in the Fig. 1 where the peak emission of a ULIRG of L⊙ and redshifted at z=1 is shown (normalized SED of Arp 220). A major issue at these wavelengths with a 60 cm telescope is obviously the identification of optical counterparts for the determination of a redshift and the separation of local and distant galaxies.
4.1 Source Counts and Cosmic IR Background
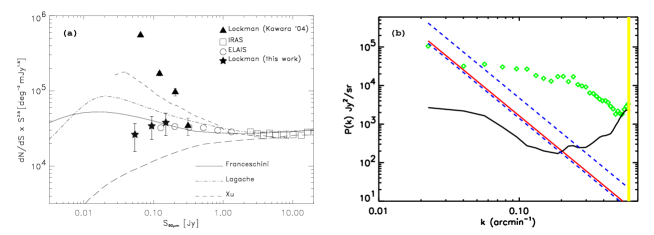
Source counts at 170 (e.g. Kawara et al., 1998; Puget et al., 1999; Dole et al., 2001) exhibit a steep slope of between 180 and 500 mJy and, like in the mid IR range, show sources in excess by a factor of 10 compared with no evolution scenario. The brightness fluctuations in the Lockman Hole were used by Matsuhara et al (2000) to constrain galaxy number counts down to 35 mJy at 90 m and 60 mJy at 170 m , confirming the existence of a strong evolution down to these flux densities. Using a new data reduction method, Rodighiero & Franceschini (2004) extended the previous works of Kawara et al.(1998), Efstathiou et al.(2000) and Linden-Voernle et al.(2000) down to lower flux densities (30 mJy at 90 m ) and found a clear excess of faint objects with respect to no evolution (see Fig. 4a). However, the resolved sources account for less than 10 % of the Cosmic Infrared Background at 170 m , which is expected to be resolved into sources in the 1 to 10 mJy range.
Sources below the detection limit of a survey create fluctuations. If the detection limit does not allow to resolve the sources dominating the CIB intensity, which is the case in the far IR with ISO, characterizing these fluctuations can constrain the spatial correlations of these unresolved sources of cosmological significance. An example of the modeled redshift distribution of the unresolved sources at 170 can be found in Fig. 12 of Lagache et al.(2003); the sources dominating the CIB fluctuations have a redshift distribution peaking at . After the pioneering work of Herbstmeierer et al.(1998) with ISOPHOT, Lagache & Puget (2000) discovered them at 170 in the FIRBACK data, followed by other works at 170 and 90 (Matsuhara et al.2000; Puget & Lagache, 2000; Kiss et al.2001). Fig. 4b shows the CIB fluctuations in the FN2 field by Puget & Lagache, (2000), at wavenumbers arcmin-1.
4.2 Nature of the ISOPHOT Galaxies
Determining the nature of the far IR galaxies has been a longer process than in the mid IR, mainly because of the difficulty to find the shorter wavelength counterparts in a large beam. Various techniques have been used to overcome this problem, one of the most successful being the identification using 20 cm radio data (e.g. Ciliegi et al.1999). Another technique is the far IR multiwavelength approach (Juvela et al.2000) that helps constraining the position and the SED; it also helps to separate the cirrus structures from the extragalactic sources. A variation is to use ISOCAM and ISOPHOT data, like the ELAIS Survey (Rowan-Robinson et al.2004, see also Oliver in this book). Finally, the Serendipity Survey (Stickel et al.1998, 2000), by covering large and shallow areas, allows to detect many bright objects easier to follow-up or already known.
Far IR ISO galaxies can be sorted schematically into two populations. First, the low redshift sources, typically (e.g Serjeant et al.2001; Patris et al.2002, Kakazu et al.2002), have moderate IR luminosities, below , and are cold (Stickel et al.2000). Second, sources at higher redshift, (Patris et al., 2002) and beyond, (Chapman et al.2002) are more luminous, typically , and appear to be cold. Serjeant et al.(2001) derived the Luminosity Function at 90 , and started to detect an evolution compared to the local IRAS 100 sample.
5 The ISOCAM 15 m deep surveys

| Name | Area (’2) | Int.(min) | depth(mJy) | # objects | |
|---|---|---|---|---|---|
| ELAIS N11 | 15 | 9612 | 0.7;0.7 | 1;0.7 | 490 |
| ELAIS N21 | 7;15 | 9612;9612 | 0.7;0.7 | 1;0.7 | 628;566 |
| ELAIS N31 | 7;15 | 4752;3168 | 0.7;0.7 | 1;0.7 | 189;131 |
| ELAIS S11 | 7;15 | 6336;14256 | 0.7;0.7 | 1;0.7 | 304;317 |
| ELAIS S21 | 7;15 | 432;432 | 0.7;0.7 | 1;0.7 | 40;43 |
| Lockman Shallow2,3 | 15 | 1944 | 3 | 0.25 | 457 |
| (80 % compl.) | 0.45 | 260 | |||
| Comet Field4 | 12 | 360 | 10 | 0.5 | 37 |
| CFRS14+525 | 7;15 | 100;100 | 18;11 | 0.3 ;0.4 | 23;41 |
| CFRS03+006 | 7;15 | 100;100 | 6;22 | 0.5 ;0.3 | - |
| Lockman Deep2,7 | 7;15 | 500;500 | 18;11 | 0.3 ;0.4 | 166 |
| Marano DSF2 | 7;15 | 900;900 | 15.4;15.4 | 0.19 ;0.32 | 180 |
| A3708 | 7;15 | 31.3;31.3 | 42;42 | 0.052;0.21(u) | 4;20 |
| (80 % compl.) | 0.080;0.293(u) | ||||
| Marano UDSR2 | 7;15 | 85;90 | 120;114 | 0.18 ;0.14 | -;142 |
| Marano UDSF2 | 7;15 | 89;90 | 114 | 0.08 ;0.14 | 115;137 |
| A22188 | 7;15 | 20.5;20.5 | 84;84 | 0.054;0.121(u) | 18;46 |
| (80 % compl.) | 0.079;0.167(u) | ||||
| HDFNFF2,9 | 7;15 | 10;27 | 116;135 | 0.05 ;0.1 | 7;44 |
| HDFS2,10 | 7;15 | 28;28 | 168;168 | 0.05 ;0.1 | 16;63 |
| A239011,8 | 7;15 | 5.3;5.3 | 432;432 | 0.038;0.050(u) | 10;28 |
| (80 % compl.) | 0.052;0.092(u) | ||||
| Lockman PGPQ12 | 7 | 9 | 744 | 0.034 | 15 |
| SSA1313 | 7 | 16 | 1264 | 0.006 | 65 |
| 7(80 % compl.) | 0.016 |
References: (1) Oliver et al.2000, Rowan-Robinson et al.2004, (2) Elbaz et al.1999 and in prep., (3) Rodighiero et al.2004, (4) Clements et al. 1999, (5) Flores et al.1999, (6) Flores (private communication), (7) Fadda et al.2004, (8) Metcalfe et al.2003, (9) Aussel et al.1999, Goldschmidt et al.1997, (10) Oliver et al.2002, (11) Altieri et al.1999, (12) Taniguchi et al. 1997, (13) Sato et al.2003, Sato et al.2004. The depth of the deep surveys in the field of lensing clusters does not include the correction for lensing amplification, as indicated by the (u)
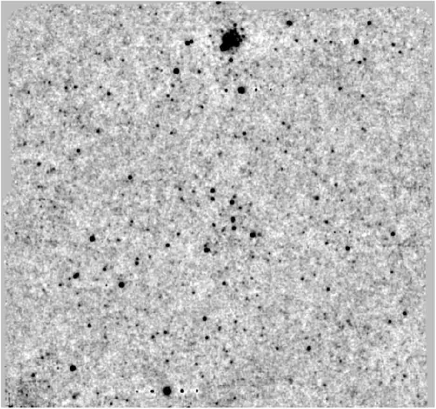
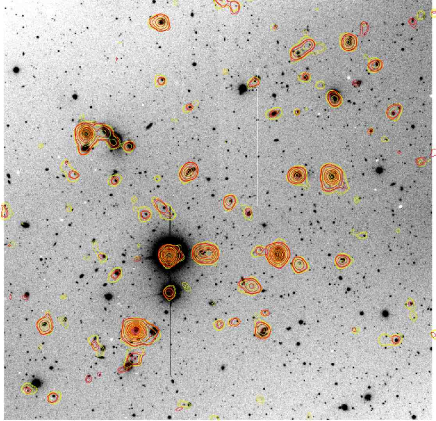
A series of surveys were performed within the Garanteed Time (IGTES, ISOCAM Garanteed Time Extragalactic Surveys, Elbaz et al.1999) and Open Time as summarized in the Table 1, where the surveys at 7 (6.75 m ) and 15 m are sorted by increasing depth irrespective of wavelength. The major strength of ISOCAM is its spatial resolution (PSF FWHM of 4.5” at 15 m , Okumura 1998) and sensitivity, which permitted to detect galaxies down to the LIRG regime up to 1.3 in the deepest surveys (Figs. 1, 2), well above confusion. Cosmic rays were a stronger limitation than photon or readout noise by inducing ghost sources when they were not perfectly removed, especially those with long term transients associated to them. Two techniques were developped in order to solve this issue, the so-called PRETI (Pattern REcognition Technique for Isocam data, Starck et al.1999) and LARI (Lari et al.2001) techniques. A third technique was developped by Désert et al.(1999), in which the mosaic data were analyzed using the beam switching approach, the Three Beam technique. PRETI consists in a multi-scale wavelet decomposition of the signal, while LARI tries to account for the physical processes taking place in the detectors, including the effect of neighboring pixels. The LARI technique was first applied to the ELAIS surveys (see Oliver et al., in these book) and more recently to the IGTES surveys of the Lockman Hole (Rodighiero et al.2004, Fadda et al.2004) and of the Marano field (Elbaz et al., in prep.). The quality of the ISOCAM images is shown with the case of the Marano FIRBACK deep field (30’30’) in the Fig. 6. The central part of this field was imaged at a deeper level (UDSF) and analyzed with both techniques. The resulting contours are overlayed on a VLT-FORS2 image of the field, demonstrating the consistency and robustness of both source detection algorithms (Fig. 7).
Lensing appeared to be a very powerful tool to extend the detection of faint objects by a factor 2-3 (see Metcalfe et al.2003). However studies such as the relative clustering of IR galaxies versus field galaxies are better done in larger homogeneous fields, where the role of cosmic variance can also be quantified. As we will see below, the environment of distant LIRGs seems to play a major role in triggering their star formation activity.
5.1 Source Counts and Cosmic IR Background

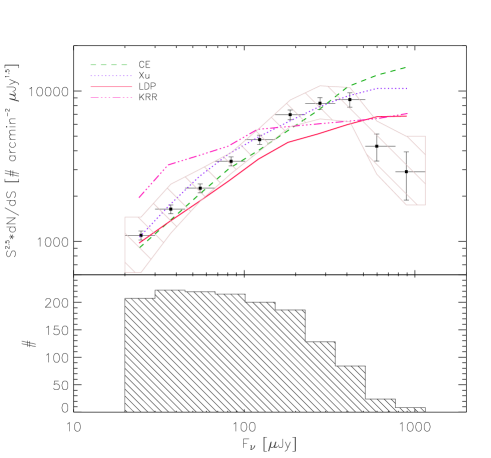
The source counts at 15 m exhibit a strong excess of faint sources below 2 mJy. This excess is usually defined by comparison with model predictions assuming that galaxies behaved similarly in the distant universe as they do today. Such “no evolution” behavior is represented by a shaded area in the Fig. 5 (see figure caption). Galaxies above this flux density do fall within this region, as illustrated by the data points from the ELAIS-S1 field (Gruppioni et al.2003, see also Oliver et al.in this book). In Fig. 5, we have separated the data points from the IGTES (Elbaz et al.1999) between those below and above 1 mJy, with filled and open dots respectively. Data above this flux density from Elbaz et al.(1999) appear to be inconsistent with those derived from ELAIS-S1. Most of those points were derived from the Shallow Survey of the Lockman Hole within the IGTES, which suffered from having less redundant observations of a given sky pixel. At that time, ISOCAM data reduction methods were not optimized for such surveys, but since then, they have been improved to better deal with such shallow surveys. Among the techniques that are discussed below, the “Lari” technique is particularly suitable for such low redundancy surveys (and even more for the very shallow ELAIS surveys, see Oliver et al.in this book) and a recent analysis of the Lockman Hole Deep (Fadda et al.2004, large open squares) and Shallow (Rodighiero et al.2004, large open stars) surveys from the IGTES provided new number counts at these flux densities perfectly consistent with those derived from ELAIS-S1 by Gruppioni et al.(2003) also using the same “Lari” technique. Note that the models designed to fit the ISOCAM number counts were constrained by the Elbaz et al.(1999) results, hence overproduce the number of sources above 2 mJy. As a natural result, they have also overpredicted the number of sources detected in the high flux density regime at 24 m with Spitzer (see Sect. 7 and Papovich et al.2004, Chary et al.2004).
Above the Earth’s atmosphere, the 15 m light is strongly dominated by the zodiacal emission from interplanetary dust and it has not yet been possible to make a direct measurement of the 15 m background, or EBL. Individual galaxies contribute to this background and a lower limit to the 15 m EBL can be obtained by adding up the fluxes of all ISOCAM galaxies detected per unit area down to a given flux limit. The resulting value is called the 15 m integrated galaxy light (IGL).
As in Elbaz et al.(2002), the differential number counts can be converted into a differential contribution to the 15 m IGL as a function of flux density, estimated from the following formula:
| (1) |
where (sr-1) is the surface density of sources with a flux density [15 m] (mJy) over a flux density bin (mJy) (1 mJy= 10-20 nW m-2 Hz-1) and (Hz) is the frequency of the 15 m photons.
About 600 galaxies below 3 mJy, were used to provide the points with errors bars in Fig. 8a. Fig. 8b shows the 15 m IGL as a function of depth. It corresponds to the integral of Fig. 8a, where the data below 3 mJy were fitted with a polynomial of degree 3 and the 1- error bars on were obtained from the polynomial fit to the upper and lower limits of the data points. The 15 m IGL does not converge above a sensitivity limit of 50 Jy, but the flattening of the curve below mJy suggests that most of the 15 m EBL should arise from the galaxies already unveiled by ISOCAM. Above this flux density limit, where the completeness limit is larger than 80 % - including lensed objects-, it is equal to 2.4 0.5 nW m-2 sr-1 (Elbaz et al.2002). Down to a 50 % completeness limit, Metcalfe et al.(2003) found a 10 % larger value including sources down to 30 Jy but the statistics remains limited at these depths with only four sources below 50 Jy.
Franceschini et al. (2001) and Chary & Elbaz (2001), developped models which reproduce the number counts from ISOCAM at 15 m, from ISOPHOT at 90 and 170 m and from SCUBA at 850 m, as well as the shape of the CIRB from 100 to 1000 m. These models consistently predict a 15 m EBL of:
| (2) |
If this prediction from the models is correct then about of the 15 m EBL is resolved into individual galaxies by the ISOCAM surveys.
This result is consistent with the upper limit on the 15 m EBL estimated by Stanev & Franceschini (1998) of:
| (3) |
This upper limit was computed from the 1997 -ray outburst of the blazar Mkn 501 ( 0.034) as a result of the opacity of mid IR photons to -ray photons, which annihilate with them through pair production. It was since confirmed by Renault et al. (2001), who found an upper limit of 4.7 nW m-2 sr-1 from 5 to 15 m.
Nearly all the IGL is produced by sources fainter than 3 mJy (94 ) and about 70 by sources fainter than 0.5 mJy. This means that the nature and redshift distribution of the galaxies producing the bulk of the 15 m IGL can be determined by studying these faint galaxies only.
5.2 Mid IR as a SFR indicator
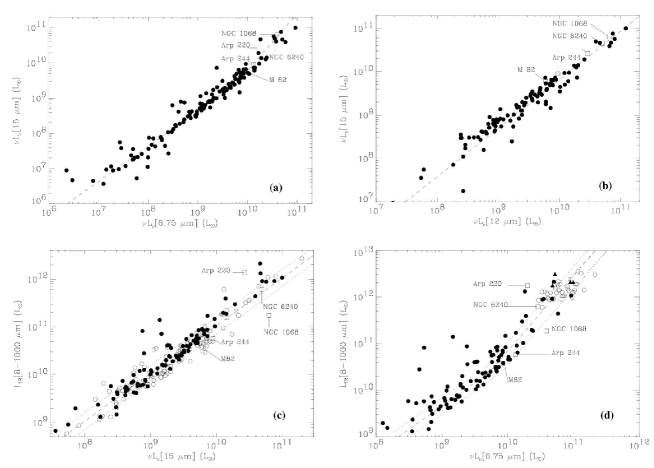

When normalized to the 7.7 m PAH (polycyclic aromatic hydrocarbon) broad emission line, the spectra of different galaxies exhibit very different 15, 25, 60 or 100 m over 7.7 m ratio. This was often interpreted as an indication that measuring the monochromatic luminosity of a galaxy at one mid IR wavelength was useless to determine its bolometric IR luminosity, LIR = L(8–1000 m ). However, the variation of the far over mid IR ratio is correlated with LIR and local galaxies do exhibit a strong correlation of their mid and far IR luminosities (Fig. 9). These correlations can be used to construct a family of template SEDs or correlations from which the LIR , and therefore SFR, of a galaxy can be derived from its mid IR luminosity (Chary & Elbaz 2001, Elbaz et al.2002). The LIR derived from this technique are consistent with those derived by the radio-far IR correlation, when radio-mid-far IR data exist (Elbaz et al.2002, Garrett 2002, Gruppioni et al.2003). In the Fig. 10, we have reproduced the plot from Elbaz et al.(2002) complemented with galaxies detected within the ELAIS survey (Rowan-Robinson et al.2004). Except at low luminosities were the contribution of cirrus to the IR luminosity becomes non negligible, the 1.4 GHz and 15 m rest-frame luminosities are correlated up to 1 and therefore predict very consistent total IR luminosities. A similar result was later on obtained using the MIPS instrument onboard the Spitzer Space Observatory at 24 m (Appleton et al.2004).
Several studies compared the SFR derived from the IR luminosity with the optical SFR derived from the H emission line (Rigopoulou et al.2000, Cardiel et al.2003, Flores et al.2004, Liang et al.2004). Rigopoulou et al.(2000) found a large excess of SFR(IR) versus SFR(H) even after correcting the latter for extinction. The Balmer decrement was only measured for limited number of objects in the sample and the extinction correction was derived from broadband photometry, which suffers from strong uncertainties in particular due to the degeneracy between age, metallicity and extinction. However, Cardiel et al.(2003) confirmed the direct measure of the SFR(IR) excess using the combination of NIRSPEC and LRIS, for the distant galaxies, and the Echelle Spectrograph and Imager (ESI), for the closer ones, at the Keck telescope. Using high resolution VLT-FORS2 spectra, Flores et al.(2004) and Liang et al.(2004) were able to measure directly the Balmer decrement (using H/H or H/H) and to subtract the underlying nebular emission lines with a fit of the stellar continuum. Although the SFR(IR) exceeds the estimate from emission lines for the most active objects, the data present a clear correlation between SFR(IR) and SFR(H) which suggests that the star formation regions responsible for the IR luminosity of distant LIRGs are not completely obscured. This correlations also confirms that the mid IR is indeed a good SFR estimator.
5.3 Nature of the ISOCAM Galaxies
The Hubble Deep Field North and its Flanking Fields (HDFNFF) provides the best coverage in spectroscopic redshifts and deep optical images for an ISOCAM deep survey. We used the revised version of the Aussel et al.(1999) catalog for which 85 % (71 %) of the 40 (86) galaxies above 100 Jy (30 Jy) have a spectroscopic redshift to determine the average properties of ISOCAM galaxies summarized in the Figs. 11, 12. Their optical counterparts are relatively bright and their median-mean redshift is close to 0.8 (Fig. 11). Note the redshift peaks in which the ISOCAM galaxies are located, leaving wide empty spaces in between. Most ISOCAM galaxies are located within large-scale structures, here mainly those at z=0.848 and z=1.017, which might be galaxy clusters in formation where galaxy-galaxy interactions are amplified (Elbaz & Cesarsky 2003, see discussion below).
Thanks to the deepest soft to hard X-ray survey ever performed with Chandra in the HDFN, it is possible to pinpoint active galactic nuclei (AGNs) in this field including those affected by dust extinction. Only five sources were classified as AGN dominated on the basis of their X-ray properties (Fadda et al. 2002). Hence, unless a large number of AGNs are so dust obscured that they were even missed with the 2 Megaseconds Chandra survey, the vast majority of ISOCAM galaxies are powered by star formation. This result is consistent with observations of local galaxies which indicate that only the upper luminosity range of ULIRGs are dominated by an AGN (Tran et al.2001).
Using the mid-far IR correlations (Chary & Elbaz 2001, Elbaz et al.2002, see also Sec. 5.2), the LIR distribution of the HDFN mid IR sources is plotted in Fig. 12a. Most of them belong to the LIRG and ULIRG regime, although when including flux densities below completeness down to 30 Jy, one finds also intermediate luminosities. Finally, their stellar masses are among the largest in their redshift range, when compared to the stellar mass estimates by Dickinson et al.(2003) in the HDFN (Fig. 12b).
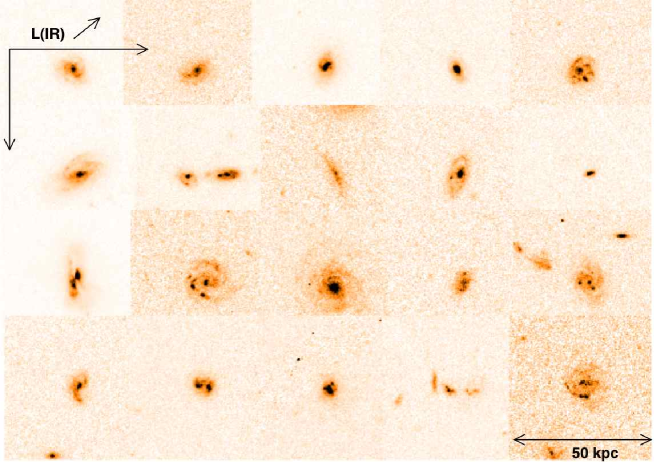
In the local universe, both LIRGs and ULIRGs exhibit the typical morphology of major mergers, i.e. mergers of approximately equal mass (Sanders & Mirabel 1996, Sanders, Surace & Ishida 1999). In the case of LIRGs, the merging galaxies show a larger separation than for ULIRGs, which are mostly in the late phase of the merger. Fig. 13 (Elbaz & Moy 2004) presents the HST-ACS morphology of a sample of 0.7 LIRGs in the GOODSN field (extended HDFN). Less than half of these galaxies clone the morphology of local LIRGs, which implies that the physical processes switching on the star formation activity in distant LIRGs might be different than for local ones. The gas mass fraction of younger galaxies being larger, other types of interactions might generate a LIRG phase in the distant universe, such as minor mergers or even passing-by galaxies producing a tidal effect. The fact that such interactions are more frequent than major mergers could also explain the importance of the LIRG phase for galaxies in general and also the possibility for a galaxy to experience several intense bursts in its lifetime. The appearance of this phase of violent star formation could be facilitated during the formation of groups or clusters of galaxies.
A striking example of this is given by the large fraction of LIRGs detected in the distant galaxy cluster J1888.16CL, located at a redshit of 0.56 (Duc et al.2004). Among the 27 objects for which spectra were obtained, six of them belong to the cluster while an extra pair with slightly higher redshifts may lie in infalling groups. All eight galaxies exhibit weak emission lines in their optical spectra, typical of dust enshrouded star forming galaxies, none of these lines being broad enough to indicate the presence of type I AGNs. In this relatively young galaxy cluster, the mechanism that may be triggering SFRs between 20 and 120 M yr-1 for at least eight objects of the cluster could well be tidal collisions within sub-structures or infalling groups. On a more local scale, the mid IR emission of the Abell 1689 ( 0.181) galaxies exhibits an excess of the B-[15] color with respect to richer and closer galaxy clusters, such as Coma and Virgo, which suggests the presence of a mid IR equivalent to the Butcher-Oemler effect, i.e. the star formation activity of galaxies as reflected by their mid IR emission increases with increasing redshift (Fadda et al.2000). The high fraction of blue galaxies intially reported for this cluster by Butcher & Oemler (1984) was later on confirmed by Duc et al.(2002), who also found that the actual SFR for these galaxies was on average ten times larger than the one derived from the [OII] emission line implying that 90 % of the star formation activity taking place in this cluster was hidden by dust.
LIRGs could then be a tracer of large-scale structures in formation as suggested by their redshift distribution (Fig. 11b, see also Elbaz & Cesarsky 2003). In order to test this hypothesis, Moy & Elbaz (in prep.) compared the fraction of ISOCAM galaxies (above the completeness limit of 0.1 mJy) found in “redshift peaks” to the one obtained when randomly selecting field sources of equal optical and K-band magnitudes in the same redshift range. Redshift peaks of different strengths, measured as N-, were defined by smoothing the field galaxies redshift distribution by 15,000 km/s (Fig.14a) and measuring the peaks N- above the smoothed distribution. The Monte-Carlo samples of field galaxies to be compared to the redshift distribution of the ISOCAM galaxies were selected within the real redshift distribution and not the smoothed one. The distribution of the Monte-Carlo simulations are shown with error bars at the 68 and 90 % level. When considering the whole ISOCAM catalog, i.e. including faint sources below completeness, it appears that ISOCAM galaxies are more clustered than field galaxies. Less than 32 % of the simulations present a comparable clustering than the whole ISOCAM sample which contains a large fraction of non LIRGs. Strickingly, when only selecting the brightest galaxies above the completeness limit of 0.1 mJy, one finds that they are LIRGs and ULIRGs which fall in the densest redshift peaks, above 6-. The probability to randomly select a sample of galaxies from the field (with equal magnitudes and redshift range) in the redshift peaks of 6- and above is less than 1 %. As a result, mid IR surveys are very efficient in selecting over-dense regions in the universe, which in return are very efficient in producing a LIRG. On the contrary, mid IR selected galaxies are locally less clustered than field galaxies (Gonzalez-Solares et al.2004), which could be a natural result of the fact that only the less clustered galaxies still produce IR luminous phases while more clustered galaxies lived their IR luminous phase in the past (see also Elbaz & Cesarsky 2003).
Finally, one question remains to be addressed about distant LIRGs: how long does this starburst phase last and how much stellar mass is produced during that time ? Marcillac et al.(2004) used a bayesian approach and simulated 200,000 virtual high-resolution spectra with the Bruzual & Charlot (2003) code to determine the recent star formation history of distant LIRGs as well as their stellar masses. These ISOCAM galaxies were observed using the VLT-FORS2 (/ 2000 in the rest-frame) in three different fields. A prototypical LIRG at 0.7 is found to have a stellar mass of 51010 M⊙ and to produce about 10 % of this stellar mass within about 108 years during the burst. A remarkable result of this study is that the position of distant LIRGs in a diagram showing the value of the H8 Balmer absorption line equivalent width versus the strength of the 4000 Å break signs the presence of a burst of star formation within these galaxies, with an intensity of about 50 M⊙ yr-1 as also derived from their mid IR emission. This result supports the idea that distant LIRGs are not completely opaque to optical light and that one can learn something about their star formation history based on their optical spectra.
Liang et al.(2004) compared the gas metallicity of the same sample of objects than Marcillac et al.(2004) with local galaxies of similar absolute magnitudes in the B band. Even accounting for an evolution in the B-band luminosity, the distant LIRGs turn out to be about twice less metal rich. This result suggests that between 1 and today, LIRGs do produce a large fraction of the metals located in their host galaxies in agreement with the strong evolution of the cosmic star formation history found by the models fitting the ISO source counts.


6 Cosmic evolution, star formation rate history
The combination of surveys at different wavelengths, from ISOCAM, ISOPHOT and SCUBA, together with the the shape and intensity of the CIRB, was used by several authors to constrain the parameters of their backward evolution models assuming a combination of luminosity and density evolution as a function of redshift of the IR luminosity function at 15 or 60 m : Roche & Eales (1999), Tan et al.(1999), Devriendt & Guiderdoni (2000), Dole et al.(2000), Chary & Elbaz (2001), Franceschini et al.(2001, 2003), Malkan & Stecker (2001), Pearson (2001), Rowan-Robinson (2001), King & Rowan-Robinson (2003), Takeuchi et al.(2001), Xu et al.(2001,2003), Balland et al.(2002), Lagache, Dole & Puget (2003), Totani & Takeuchi (2002), Wang (2002).
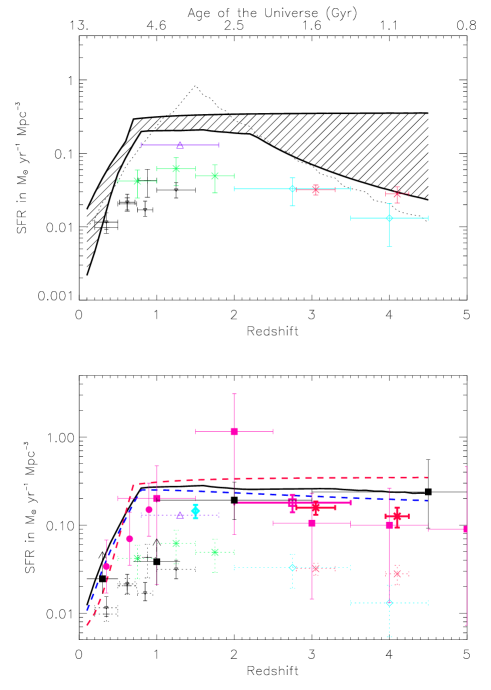
Being limited by the sensitivity of the extragalactic surveys, the major output of these models was to show that LIRGs and ULIRGs were much more common in the past than they are today. Chary & Elbaz (2001) derived that the comoving IR luminosity due to LIRGs was about seventy times larger at 1 than it is today (Fig. 15). Quite logically, it resulted that the contribution of LIRGs to the cosmic star formation history was so large in the past that it dominated the integrated star formation that galaxies experienced in the past. Hence, LIRGs should now be considered not as a type of galaxies but instead as a common phase of intense star formation that any galaxy may have experienced.
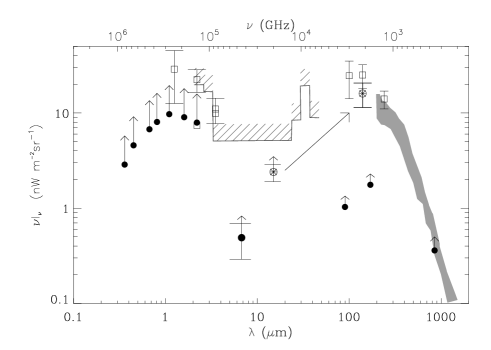
Elbaz et al.(2002) derived the contribution to the peak of the CIRB at 140 m from the population of LIRGs around 0.8 detected in the ISOCAM 15 m deep surveys and found that these objects alone can explain more than two thirds of the peak and integrated intensities of the CIRB (see Fig. 16). Hence the CIRB is the signature of the strong redshift evolution of LIRGs and the fossil record of star formation which took place in such burst phases.
7 From ISO to Spitzer, Herschel, the JWST and ALMA
On August 23rd, 2003, NASA’s Spitzer space telescope (formerly SIRTF) was launched. Among its first results came the source counts at 24 m down to 20 Jy which confirmed what ISO deep surveys already saw: a strong excess of faint sources indicating a rapid redshift evolution of IR luminous galaxies. When compared to models developped to fit the ISO counts, the faint end of the Spitzer counts are perfectly fitted as shown in the Fig. 17 reproduced from Chary et al.(2004). On the high flux density range, around 1 mJy and above, less galaxies are found than predicted by those models (see also Papovich et al.2004). This is partly, if not integrally, due to the fact that even ISOCAM-15 m number counts were initially overestimated above 1 mJy as discussed in Sect. 5.1, since the data reduction techniques were not optimized for the surveys with little redundancy over a given sky pixel. Although some refinement of the template SEDs used in the models might be considered (as suggested by Lagache et al.2004), the 24 m number counts appear to be perfectly consistent with the up-to-date 15 m counts. Moreover, the high flux density range does not strongly affect the conclusions of the models based on previous 15 m counts since bright objects do not contribute significantly to the CIRB and to the cosmic density of star formation. Hence these refinements are not strongly affecting the conclusions derived on galaxy formation and evolution based on the ISO deep surveys and summarized in the previous sections (see also Dole et al.2004 for the Spitzer counts in the far IR).
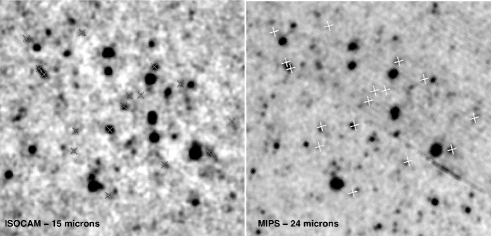
Another hint on the consistency of Spitzer MIPS-24 m surveys with ISOCAM-15 m is given by the comparison of the images themselves. Galaxies detected at 15 and 24 m are clearly visible in both images in Fig. 18, although several 24 m sources do not have a 15 m counterpart. This results from the combination of the better sensitivity of MIPS, by a factor 2 or slightly more for the deepest surveys (galaxies are detected down to 40 Jy in the HDFN, see Aussel et al.1999, without lensing magnification), and of the k-correction. For galaxies above 1, the PAH bump centered on the PAH feature at 7.7 m starts to exit to 15 m broadband while it remains within the MIPS-24 m band up to 2. The combination of ISOCAM and MIPS can be used to test whether the library of template SEDs that were used to derive “bolometric” IR luminosities from 8 to 1000 m for the 15 m galaxies are correct at least in the mid IR range. One of the most important test is to check whether the 7.7 m PAH bump is still present at 1 and whether the 24 over 15 m flux density ratio is consistent with the template SEDs used by the models from which star formation histories were derived. The template SEDs designed by Chary & Elbaz (2001) provide a very good fit to the combination of both mid IR values for a sample of 16 galaxies detected by ISOCAM and MIPS (crosses on the Fig. 18). The (8-1000 m ) derived from either the 15 or 24 m luminosities or the combination of both to constrain the SED fit present a 1- dispersion of only 20 % (Elbaz et al.2004). For galaxies located around 1, the relative 15 and 24 m luminosities clearly suggest the presence of a bump at 7.7 m as observed in nearby galaxies and due to PAHs.
Many questions remain unsolved that will be addressed by future missions, staring with Spitzer. Only when a fair sample of redshifts will have been determined for the distant LIRGs will we be able to definitely ascertain the redshift evolution of the IR luminosity function. Already for the brightest part of it, campaigns of redshift measurements have started, on ELAIS fields for the nearby objects, and on the Marano field with VIMOS and the Lockman Hole with DEIMOS for more distant objects. The fields selected for Spitzer legacy and garanteed time surveys were also carefully selected to be covered at all wavelengths and followed spectroscopically, so that this issue should be addressed in the very near future. Due to confusion and sensitivity limits, direct observations in the far IR will not reach the same depth than mid IR ones until the launch of Herschel scheduled for 2007. The direct access to the far IR distant universe with Herschel will certainly bring major information on galaxy formation, together with the James Webb Space Telescope (JWST) up to 30 m and the Atacama Large Millimeter Array (ALMA), which will bring an improved spatial resolution for the and above universe. Among the questions to be solved, we do not resist to the temptation of listing some of our favorite ones: what is the connection of large-scale structure formation with LIRG phases in galaxies ? Can we probe the formation of distant clusters by the detection of the epoch when galaxies formed stars in such intense starbursts, producing galactic winds and enriching the intra-cluster medium with metals ? Have we really resolved the bulk of the hard X-ray background, which peaks around 30 keV, and not left unknown some deeply buried AGNs which could make a larger than 20 % fraction of the mid IR light from distant LIRGs ? What is the future of a distant LIRG, is it producing stars in a future bulge or disk ? How uncertain is the interpolation to lower luminosities than those observed done in the models used to derive cosmic star formation history scenarios ? This is of course only an example of a vast series of questions which indicate that the field opened for a large part by ISO has a long life to come.
References
- [] Adelberger, K.L., Steidel, C.C., 2000, ApJ 544, 218
- [] Altieri et al., 1999, A&A 343, L65
- [] Appleton, P.N., Fadda, D.T., Marleau, F.R. et al., 2004, ApJS 154, 147
- [] Aussel, H., Cesarsky, C.J., Elbaz, D., Starck, J.L. 1999, A&A 342, 313
- [] Balland C., Devriendt, J., Silk J., 2003, MNRAS 343, 107
- [] Barger, A.J., Cowie, L.L., Sanders, D.B. et al., 1998, Nature 394, 248
- [] Bernstein, R.A., Freedman, W. L., Madore, B.F., 2002, ApJ 571, 56
- [] Bruzual, G., Charlot, S., 2003, MNRAS 344, 1000
- [] Butcher, H., Oemler, A., 1984, ApJ 285, 426
- [] Cardiel, N., Elbaz, D., Schiavon, R.P., et al.2003, ApJ 584, 76
- [] Cesarsky, C., Abergel, A., Agnèse, P. et al., 1996, A&A 315, L32
- [] Chapman, S. C., Smail I., Ivison R. et al., 2002, ApJ 573, 66
- [] Chapman, S.C., Blain, A.W., Ivison, R.J., Smail, I. 2003, Nature 422, 695
- [] Chary, R.R., Elbaz, D. 2001, ApJ 556, 562
- [] Chary, R.R., Casertano, S., Dickinson, M.E. et al., 2004, ApJS 154, 80
- [] Ciliegi P., McMahon R. G., Miley G. et al., 1999, MNRAS 302, 222
- [] Clements, D. et al., 1999, A&A 346, 383
- [] Cohen, J.G., Hogg, D.W., Blandford, R. et al., 2000, ApJ 538, 29
- [] Cole, S. et al., 2001, MNRAS 326, 255
- [] Désert F-X., Puget J-L., Clements D., et al., 1999, A&A 342, 363
- [] Devriendt, J.& Guiderdoni, B., 2000, A&A 363, 851
- [] Dickinson, M., Papovich, C., Ferguson, H.C., Budaári, T., 2003, ApJ 587, 25
- [] Dole, H., Gispert, R., Lagache, G. et al., 2000, Springer Lect. Notes in Ph., v548, 54 (astro-ph/0002283)
- [] Dole H., Gispert R., Lagache, G. et al., 2001, A&A 372, 364
- [] Dole, H., 2002, Proceedings of the ESA SP-511 conference “Exploiting the ISO Data Archive - Infrared Astronomy in the Internet Age”, C.Gry et al.eds. (astro-ph/0211310)
- [] Dole, H., Le Floc’h, E., Perez-Gonzalez, P.G. et al., 2004, ApJS 154, 87
- [] Duc, P.-A., Poggianti, B., Fadda, D. et al., 2002, A&A 382, 60
- [] Duc, P.-A., Fadda, D., Poggianti, B. et al., 2004, Proceedings of the IAU Colloquium 195, “Outskirts of Galaxy Clusters: intense life in the suburbs”, Ed. A.Diaferio (astro-ph/0404183)
- [] Efstathiou A., Oliver S., Rowan-Robinson M. et al., 2000, MNRAS, 319, 1169
- [] Elbaz, D., Cesarsky, C.J., Fadda, D. et al., 1999, A&A 351, L37
- [] Elbaz, D., Cesarsky, C.J., Chanial, P. et al., 2002, A&A 384, 848
- [] Elbaz, D., Cesarsky, C.J. 2003, Science 300, 270
- [] Elbaz, D., Moy, E., 2004, Proceedgins of the “Multiwavelength Cosmology” Conference, held on Mykonos Island, Greece, Ed. M. Plionis, Kluwer Academic Publishers, p.173 (astro-ph/0401617)
- [] Elbaz, D., Dole, H., Le F’loch, E., Marcillac, D., 2004, to be submitted
- [] Fadda, D., Elbaz, D., Duc, P.-A., et al.2000, A&A 361, 827
- [] Fadda, D., Flores, H., Hasinger, G. et al., 2002, A&A 383, 838
- [] Fadda, D., Lari, G., Rodighiero, G. et al., 2004, A&A in press (astro-ph/0407649)
- [] Fang, F., Shupe, D., Xu, C., Hacking, P., 1998, ApJ 500, 693
- [] Fixsen, D. J., Dwek, E., Mather, J.C., Bennett, C.L., Shafer, R.A. 1998, ApJ 508, 123
- [] Flores, H., Hammer, F., Thuan, T.X. et al., 1999, ApJ 517, 148
- [] Flores, H., Hammer, F., Elbaz, D., et al., 2004, A&A 415, 885
- [] Franceschini A., Aussel H., Cesarsky C. J., Elbaz D., Fadda D., 2001, A&A 378, 1
- [] Franceschini, A., Berta, S., Rigopoulou, D. et al., 2003, A&A 403, 501
- [] Garrett, M., 2002, A&A 384, L19
- [] Genzel R., & Cesarsky C., 2000, ARAA, 38, 761
- [] Goldader, J.D., Meurer, G., Heckman, T.M. et al., 2002, ApJ 568, 651
- [] Goldschmidt et al., 1997, MNRAS 289, 465
- [] Gonzalez-Solares, E.A., Oliver, S., Gruppioni, C. et al., 2004, MNRAS 352, 44
- [] Gruppioni, C., Pozzi, F., Zamorani, G. et al., 2003, MNRAS 341, L1
- [] Haarsma, D.B., Partridge, R.B., Windhorst, R.A., Richards, E.A., 2000, ApJ 544, 641
- [] Hauser, M.,& Dwek, E., 2001, ARAA, 37, 249
- [] Herbstmeierer U., Abraham P., Lemke D. et al., 1998, A&A 332, 739
- [] Hughes, D. H., Serjeant, S., Dunlop, J., et al. 1998, Nature 394, 241
- [] Juvela M., Mattila K., Lemke D., 2000, A&A 360, 813
- [] Kakazu Y., Sanders D., Jpseph R., et al., 2002, IAU184, astro-ph/0201326
- [] Kawara K., Sato Y., Matsuhara H. et al., 1998, A&A 336, L9
- [] Kawara K., Matsuhara H., Okuda H. et al., 2004, A&A 413, 843
- [] Kessler, M., Steinz, J., Anderegg, M. et al., 1996, A&A 315, L27
- [King & Rowan-Robinson (2003)] King, A. J., & Rowan-Robinson, M., 2003, MNRAS 339, 260
- [] Kim, D.-C., Sanders, D. B., 1998, ApJS 119, 41
- [] Kiss C., Abraham P., Klaas, U. et al., 2001, A&A 379, 1161
- [] Lagache, G., Abergel, A., Boulanger, F. et al., 1999, A&A 344, 322
- [] Lagache G. & Puget J-L., 2000 , A&A 355, 17
- [] Lagache G., Dole H., Puget J-L., 2003, A&A MNRAS 338, 555
- [] Lagache G., Dole H., Puget J-L. et al., 2004, ApJS 154, 112
- [] Lari C., Pozzi F., Gruppioni C. et al., 2001, A&A 325, 1173
- [] Lemke, D., Klaas, U., Abolins, J. et al., 1996, A&A 315, L64
- [] Liang, Y., Hammer, F., Flores, H., Elbaz, D., Cesarsky, C.J., 2004, A&A 423, 867
- [] Lilly, S.J., Le Fevre, O., Hammer, F., Crampton, D., 1996, ApJ 460, L1
- [] Linden-Voernle M.J.D., Norgaard-Nielsen H.U., Jorgensenet H.E. et al., 2000, A&A 359, L51
- [] Madau, P., Ferguson, H.C., Dickinson, M.E., et al.1996, MNRAS 283, 1388
- [] Madau, P., Pozzetti, L. 2000, MNRAS 312, L9
- [] Malkan M., & Stecker F., 2001, ApJ 555, 641
- [] Marcillac, D., Elbaz, D., Charlot, S. et al., 2004, submitted to A&A
- [] Matsuhara H., Kawara K., Sato Y. et al., 2000, A&A 361, 407
- [] Metcalfe, L., Kneib, J.-P., McBreen, B. et al., 2003, A&A 407, 791
- [] Meurer, G.R., Heckman, T.M., Calzetti, D., 1999, ApJ 521, 64
- [] Miville-Deschênes M-A., Lagache G., Puget J-L., 2002, 393, 749
-
[]
Okumura, K., 1998, ESA ISOCAM PSF Report,
www.iso.vilspa.esa.es/users/expllib/CAM/psfrep.ps.gz - [] Oliver S. et al., 1996, MNRAS, 280, 673
- [] Oliver S., Rowan-Robinson, M., Alexander D. et al., 2000, MNRAS, 316, 749
- [] Oliver, S., Mann, R.G., Carballo, R. et al., 2002, MNRAS 332, 536
- [] Papovich, C., Dole, H., Egami, E. et al., 2004, ApJS 154, 70
- [] Patris, J., Dennefeld, M., Lagache, G., Dole, H., 2003, A&A 412, 349
- [] Pearson C., 2001, MNRAS, 325, 1511
- [] Puget, J-L., Abergel, A., Bernard, J-P. et al., 1996, A&A 308, L5
- [] Puget J-L., Lagache G., Clements D. et al., 1999, A&A 345, 29
- [] Puget J-L.,& Lagache G., 2000, IAU204, astro-ph/0101105
- [] Rigopoulou, D., Spoon, H.W.W., Genzel, R. et al., 1999, AJ 118, 2625
- [] Rigopoulou, D., Franceschini, A., Aussel, H. et al., 2000, ApJ 537, L85.
- [] Roche N., & Eales S., 1999, MNRAS, 307, 111
- [] Rodighiero, G., Franceschini, A., 2004, A&A 419, L55
- [] Rodighiero, G., Lari, C., Fadda, D. et al., 2004, A&A in press (astro-ph/0407639)
- [] Rowan-Robinson M., 2001, ApJ 549, 745
- [] Rowan-Robinson, M., Lari, C., Perez-Fournon, I. et al., 2004, MNRAS 351, 1290
- [] Rush, B., Malkan, M.A., Spinoglio, L. 1993, ApJS 89, 1
- [] Sanders, D.B., Mirabel, I.F. 1996, ARA&A 34, 749
- [] Sanders, D., Surace, J.A., Ishida, C.M., 1999, in ”Galaxy Interactions at Low and High Redshift” IAU Symposium 186, Kyoto, Japan, eds. J.E. Barnes and D.B. Sanders (astro-ph/9909114)
- [] Sato, Y., Kawara, K., Cowie, L.L. et al., 2003, A&A 405, 833
- [] Sato, Y., Cowie, L.L., Kawara, K. et al., 2004, AJ 127, 1285
- [] Serjeant S., Oliver S., Rowan-Robinson M. et al., 2000, MNRAS, 316, 768
- [] Serjeant S., Efstathiou A., Oliver S. et al., 2001, MNRAS, 322, 262
- [] Smail, I., Ivison, R.J., Blain, A.W., Kneib, J.-P. 2002, MNRAS 331, 495
- [] Stanev, T., Franceschini, A. 1998, ApJ 494, L159
- [] Starck J.-L., Aussel H., Elbaz D. et al, 1999, A&AS 138, 365
- [] Steidel, C.C., Adelberger, K.L., Giavalisco, M., et al., 1999, ApJ 519, 1
- [] Stickel M., Bogun S., Lemke D. et al., 1998, A&A 336, 116
- [] Stickel M., Lemke D., Klaas U. et al., 2000, A&A 359, 865
- [] Takeuchi T., Ishii T., Hirashita H., et al., 2001, PASJ, 53, 37
- [] Tan J., Silk J., Balland C., 1999, ApJ 522, 579
- [] Taniguchi Y., Cowie, L.L., Sato, Y. et al., 1997, A&A 328, L9
- [] Totani T., & Takeuchi T., 2002, ApJ 570, 470
- [] Tran, Q.D., Lutz, D., Genzel, R. et al., 2001, ApJ 552, 527
- [] Wang Y., 2002, A&A 383, 755
- [] Wirth, G.D., Willmer, C.N.A., Amico, P. et al., 2004, AJ 127, 3121
- [] Xu, C., Hacking, P., Fang, F. et al., 1998, ApJ 508, 576
- [] Xu, C., Lonsdale, C., Shupe, D. et al., 2001, ApJ 562, 179
- [] Xu, C. K., Lonsdale, C. J., Shupe, D. L. et al., 2003, ApJ 587, 90