INTEGRAL observations of SS433: Results of a coordinated campaign
Results of simultaneous INTEGRAL and optical observations of the galactic microquasar SS433 in May 2003 and INTEGRAL /RXTE observations in March 2004 are presented. Persistent precessional variability with a maximum to minimum uneclipsed hard X-ray flux ratio of is discovered. The 18-60 keV X-ray eclipse is found to be in phase with optical and near infrared eclipses. The orbital eclipse observed by INTEGRAL in May 2003 is at least two times deeper and apparently wider than in the soft X-ray band. The broadband 2-100 keV X-ray spectrum simultaneously detected by RXTE/INTEGRAL in March 2004 can be explained by bremsstrahlung emission from optically thin thermal plasma with keV. Optical spectroscopy with the 6-m SAO BTA telescope confirmed the optical companion to be an A5-A7 supergiant. For the first time, spectorscopic indications of a strong heating effect in the optical star atmosphere are found. The measurements of absorption lines which are presumably formed on the non-illuminated side of the supergiant yield its radial velocity semi-amplitude km/s. The analysis of the observed hard X-ray light curve and the eclipse duration, combined with the spectroscopically determined optical star radial velocity corrected for the strong heating effect, allows us to model SS433 as a massive X-ray binary. Assuming that the hard X-ray source in SS433 is eclipsed by the donor star that exactly fills its Roche lobe, the masses of the optical and compact components in SS433 are suggested to be and , respectively. This provides further evidence that SS433 is a massive binary system with supercritical accretion onto a black hole.
Key Words.:
stars: individual: SS433 – stars: binaries: eclisping – X-rays: binaries1 Introduction
SS433 is a massive eclipsing X-ray binary system at an advanced evolutionary stage. It is recognized as a supercritically accreting microquasar with a precessing accretion disk and mildly relativistic () jets. Since its discovery in 1978 (Clark and Murdin 1978, Margon et al. 1979), this unique X-ray binary has been deeply investigated in optical, radio, and X-rays (see reviews by Margon 1984, Cherepashchuk 1988, 2002 and Fabrika 2004 for more detail and references).
Among a dozen known microquasars, SS433 is distinguished by its unique properties.
1) In this system the optical star fills its Roche lobe and mass transfer occurs on thermal time scale with the huge rate of per year and accretion onto the relativistic object is supercritical (Shakura and Sunyaev 1973).
2) Two strongly collimated () oppositely directed jets emanate with a velocity of km per second from the center of the accretion disk. The jets are observed not sporadically, as in most microquasars, but persist over tens of years with virtually constant velocity.
3) The accretion disk and relativistic jets regularly precess with a period of 162.5 days. Both the precession period and the disk inclination angle to the orbital plane () on average remain constant over tens of years.
4) The source exhibits orbital eclipsing periodicity with period . The shape of the optical light curve varies significantly with precessional phase (Goranskij et al. 1998ab, Cherepashchuk and Yarikov 1991). The orbital period is found to be very stable over more than 25 years, despite the high mass exchange rate between the binary components and strong wind mass loss ( km/s, /yr) from the supercritical accretion disk.
The unsolved puzzles of SS433 still remaining to be solved include: (1) the nature of the relativistic object, (2) the mechanism of collimation and acceleration of matter in jets to the relativistic velocity km/s, (3) the nature of the precessional phenomena in this X-ray binary system (Chakrabarti, 2002).
The INTEGRAL observations of SS433 in 2003 discovered a hard (up to 100 keV) X-ray spectrum in this supercritically accreting microquasar (Cherepashchuk et al. 2003, 2004), suggesting the presence of an extended hot (with a temperature up to K) region in the central parts of the accretion disk. These new data made it possible to compare the eclipse characteristics of SS433 at different energies: soft X-rays (2-10 keV, the ASCA data), soft and medium X-ray (1-27 keV, the Ginga data), hard X-rays (20-70 keV, the INTEGRAL data), and the optical. This comparison allows us to investigate the innermost structure of the supercritical accretion disk and to constrain the basic parameters of the binary system .
This paper is organized as follows: Section 2 lists the participants of the observational campaign. Section 3 describes the X-ray spectra and light curves obtained. Section 4 presents the analysis of hard X-ray precessional and orbital variability of SS433. Section 5 reports the results of optical and infrared photometry. Section 6 describes in detail the simultaneous optical spectroscopy of SS433 obtained with the 6-m BTA telescope and the measurements of the optical radial velocity curve. The implications of our observations for binary masses in SS433 are summarized in Section 7, and Sections 8 and 9 give the discussion and conclusions, respectively.
2 Observational campaign
The coordinated multiwavelength observational campaign of SS433 was organized during the INTEGRAL observations of the SS433 field in March-June 2003 with the participation of the following research teams.
1. Special Astrophysical Observatory of the Russian Academy of Science (SAO RAS). High signal-to-noise optical spectroscopy of SS433 at the 6-m telescope.
2. Crimean Station of the Sternberg Astronomical Institute. BVR-photometry at the 0.6-m telescope.
3. Kazan State University. Optical photometry at the Russian-Turkish 1.5-m telescope RTT-150 at the TUBITAK National Observatory (Turkey).
4. Infrared K-photometry was performed with the 1.1-m AZT-24 telescope of the Pulkovo Observatory in Italy, Osservatorio di Campo Imperatore.
5. Radio monitoring at cm wavelength: the RATAN-600 radio telescope of SAO RAS. The source was found to be in its non-flaring (quiet) state in May 2003 (Trushkin 2003).
SS433 was within the field of view of the IBIS telescope during the INTEGRAL observations (March 2004) of the Sagittarius arm tangent region centered on . We included part of these observations in our analysis. In contrast to the observations in May 2003, radio monitoring showed that SS433 had been in its flaring (active) state (Trushkin 2004).


3 IBIS/ISGRI light curves and spectra
The INTEGRAL IBIS/ISGRI data were analyzed using both publicly available ISDC software (OSA-3 version) and the original software elaborated by the IKI INTEGRAL team (see Revnivtsev et al. 2004b for more detail). The latter allows better sensitivity in constructing maps and spectra. The main results can be summarized as follows.
| Parameter | Emission line | Line | |
|---|---|---|---|
| energy | width | ||
| (kev) | (keV) | (keV) | |
| Value |
A. The IBIS/ISGRI spectrum of SS433 (25-100 keV) in May 2003 as processed by the OSA-3 software can be fitted by a power-law with photon index , taking into account the 10% systematic errors. A satisfactory fit is also obtained using an exponential cut-off with keV (Fig. 1).
The integrated hard X-ray luminosity in May 2003 was erg/s, erg/s (assuming the 5 kpc distance to SS433), which is about 10% of the soft X-ray jet luminosity.
Using the OSA-3 software, we could not significantly detect the source in the JEM-X data. Instead, we made use of the more detailed RXTE observations of SS433 performed simultaneously with INTEGRAL in March 2004 to obtain the broadband 2-100 keV spectrum of SS433. The source was observed a few days after the disk maximum opening phase. The OSA-3 software also did not allow us to significantly detect the source at energies above 70 keV, so we used the IKI software to obtain the SS433 spectrum up to 100 keV. This software has proven its quality and efficiency in processing INTEGRAL observations of the Galactic center (Revnivtsev et al. 2004b).
The resulting broadband X-ray spectrum of SS433 in March 2004 is shown in Fig. 2. It can be adequately fitted by the bremsstrahlung emission from optically thin thermal plasma with keV ( model ”bremss” from XSPEC package was used; see Table 1). The reduced chi-square value for dof is , which corresponds to a null hypothesis probability of .
B. The IBIS/ISGRI count rates of SS433 in May 2003 are presented in Fig. 3. The X-ray eclipse at hard energies is observed to be slightly narrower than the optical one, slightly broader than in the 4.6-27 keV Ginga energy range and displays extended wings (Fig. 6). This is opposite to what is found in ordinary eclipsing X-ray binaries (like Cen X-3, Vela X-1 etc.), in which the X-ray eclipse duration decreases with energy.
C. The eclipse depth is observed to be at least 80% in hard X-rays compared to in the 4.6-27 keV band (Fig. 4-6).
D. The 25-50 keV X-ray flux increases from to mCrab during March-May 2003 when the source precessed from the crossover (T2) phase to the maximum opening disk phase (T3). This modulation is times larger than observed in the 2-10 keV energy band (see Fig. 5). Thus, both precessional and eclipsing hard X-ray variabilities in SS433 exceed by times those in the standard X-ray band (Fig. 5). This suggests a more compact vertical structure of the hard X-ray emitting region in the central parts of the accretion disk.
4 Analysis of precessional and orbital variability of SS433 in the 25-50 keV energy range
4.1 Precession variability
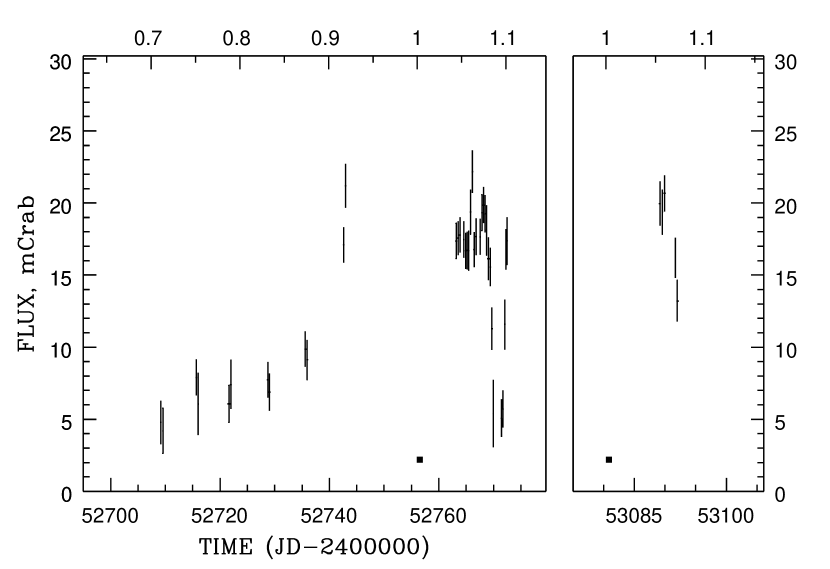

As mentioned above, the 25-50 keV flux of SS433 varies from mCrab to mCrab, with and corresponding to precession phases of the disk seen edge-on (moment T2) and at maximum open (moment T3), respectively, yielding the ratio . In Fig. 4 we present all our available INTEGRAL observations of SS433. The left panel shows the 2003 data (INTEGRAL orbits 49, 51, 53, 56, 58, 60, 67-70). The right panel shows the 2004 data (March 24-25, orbits 176 and 177). The uneclipsed flux of SS433 in 2004 (when the source was observed near the T3 phase) is comparable within the errors with the maximum flux observed near the T3 phase in 2003 (these phases are indicated by the filled squares). This suggests that the precessional hard X-ray variability of SS433 stays constant at least over several precessional cycles.
The amplitude of the precession variability in SS433 in different X-ray bands appears to be monotonically increasing with energy (Fig. 5, the squares and the solid line; Table 2). For example, archive RXTE/ASM data collected over several years (only quiet states of SS433 have been selected) indicate that , (Fabrika et al. 2004). The errors are due to the SS433 flux at the crossover being heavily absorbed (especially at the first crossover). The Ginga data (Kawai et al. 1989, Yuan et al. 1995) also fit this dependence (Table 2). The monotonic increase of the precession amplitude with energy is consistent with the model of an emitting region in SS433 as a cooling outflow.
| Energy range | Data | Ref. | |
|---|---|---|---|
| keV | |||
| 1.5-5 | 1.6 | ASM/RXTE | [1] |
| 4.6-9.2 | 1.88 | Ginga | [2,3] |
| 5-12 | 2.4 | ASM/RXTE | [1] |
| 9.2-18.4 | 2.43 | Ginga | [2,3] |
| 18.4-27.6 | 2.5 | Ginga | [2,3] |
| 25-50 | 4 | INTEGRAL | [4] |
| 50-100 | 4.2 | INTEGRAL | [4] |
[1] - Fabrika et al. 2004; [2] - Kawai et al. 1989; [3] - Yuan et al. 1995; [4] - Cherepashchuk et al. 2003
For a jet of finite length or consisting of individual evolving fragments with finite life times (Lind and Blandford 1985; Begelman et al. 1984; Panferov and Fabrika 1997), the intensity of radiation in the jet rest frame is , where is the observed intensity of the jet emission, is negative for the approaching jet and is the spectral index (). With appropriate values of the spectral index, the precession amplitude due to the relativistic beaming only in the case where both jets are always seen and are not screened by the accretion disk would be , and in the case that the receding jet is fully screened by the disk it would be . So the large ( times) precession variability found in the hard X-ray band 25-50 keV cannot be explained only by the jet relativistic beaming and should be almost fully caused by geometric screening of the inner disk structure producing hard X-rays by the edge of the precessing thick accretion disk. The precession light curve in the 25-50 keV energy band exhibits a significant irregular variability which is apparently related to the non-stationarity of the outer edges of the geometrically thick accretion disk.
4.2 Hard X-ray eclipse
The INTEGRAL observations in May 9-11, 2003, enable us to study in detail its hard X-ray eclipse. We have used our data of May 9 and 11. Data for May 10, 2003, were kindly provided by Dr. Diana Hannikainen. The main eclipse falls on the precession phase (according to the ephemeris by Goranskij et al. 1998a), fairly close to the T3 (disk maximum opening) phase.
The primary X-ray eclipse in the 18-60 keV energy band (IBIS/ISGRI data) is plotted in Fig. 6. The points are averaged over 5 and 10 INTEGRAL scientific windows (10000 and 20000 s, respectively). For comparison, we plot the 4.6-27 keV X-ray eclipse observed by Ginga (Kawai et al. 1989, Yuan et al. 1995) at about the same precession phase. The upper panel in Fig. 6 also shows the optical (V) light curve observed simultaneously with INTEGRAL in Crimea and SAO (see below). The upper panel demonstrates the absence of any noticeable lag between optical and hard X-ray primary eclipses.
Fig. 6 shows that the INTEGRAL eclipse is up to two times deeper than that observed by Ginga in softer X-ray bands. The ascending branch of the hard 18-60 keV eclipse clearly shows some irregularities. These features are similar to those observed by Ginga in the softer 4.6-27 keV X-ray band. If this is indeed the case, we can take the upper envelope of the ascending branch of the X-ray eclipse light curve as a representative shape of the eclipse by the optical star body. Note that the X-ray eclipse minimum observed by Ginga was consistent with the synchronously observed optical one (Aslanov et al. 1993). This proves that there is no appreciable phase shift between the middle of the INTEGRAL and Ginga X-ray eclipses shown in Fig. 6.
| Energy | Data | Ref. | ||
|---|---|---|---|---|
| keV | keV | |||
| 1.0-4.6 | 2.8 | 1.7 | Ginga | [1,2] |
| 4.6-9.2 | 6.9 | 1.8 | Ginga | [1,2] |
| 9.2-18.4 | 13.8 | 2.3 | Ginga | [1,2] |
| 18.4-27.6 | 23.0 | 2.9 | Ginga | [1,2] |
| 25-50 | 37.5 | 3.6 | INTEGRAL | [3] |
[1] - Kawai et al. 1989; [2] - Yuan et al. 1995; [3] - Cherepashchuk et al. 2003

The X-ray eclipse depth as a function of energy is shown in Fig. 5 by the dotted line. The eclipse depth was defined as the ratio of the mean uneclipsed flux before the eclipse to the middle eclipse flux at the T3 precession phase of SS433 in the quiet state. These data are collected in Table 3. Note the tendency for to increase with energy, which may mean that the hotter parts of the X-ray emitting region located closer to its base are totally eclipsed by the optical star.
The dependence of the precession amplitude and X-ray eclipse depth on energy is the same, suggesting similar screening efficiency of the X-ray emitting region by the accretion disk edge and by the optical star. This means that the size of the accretion disk can be comparable with that of the optical star. Such a conclusion has been also inferred from optical photometry (Fabrika & Irsmambetova 2002; Fabrika 2004).
4.3 The geometric model of the system

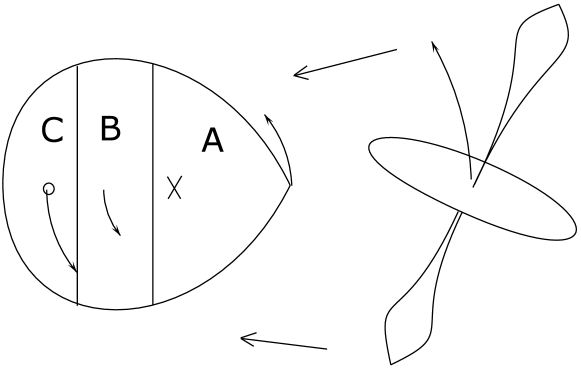
To interpret the X-ray light curve of SS433 we used a geometric model applied earlier to the analysis of the Ginga X-ray eclipse (Antokhina et al. 1992). We consider a close binary system consisting of an opaque ”normal” star limited by the Roche equipotential surface and a relativistic object surrounded by an optically and geometrically thick ”accretion disk”. The ”accretion disk” includes the disk itself and an extended photosphere formed by the outflowing wind. The orbit is circular, the axial rotation of the normal star is synchronized with the orbital revolution.
The disk is inclined with respect to the orbital plane by an angle . The opaque disk body (see Fig. 7) is described by the radius and the opening angle . The central object is surrounded by a transparent homogeneously emitting spheroid with a visible radius and height , which could be interpreted as a “corona” or a “jet” (without any relativistic motion).
Here , and are dimensionless values expressed in units of the binary separation . The radius of the normal (donor) star is determined by the relative Roche lobe size, i.e. by the mass ratio ( here denotes the mass of the relativistic object).
Only the “corona” is assumed to emit in the hard X-ray band, while the star and disk eclipse it during orbital and precessional motion. During precession the inclination of the disk with respect to the observer changes, causing different conditions of “corona” visibility. Observations of the precessional variability can thus be used to obtain a “vertical” scan of the emitting structure, restricting the parameters and . The orbital (eclipse) variability observations scan the the emitting structure “horizontally”, restricting possible values of , , and . The joint analysis of precessional and eclipse variability enables us to reconstruct the spatial structure of the region in the accretion disk center where the hard X-rays are produced.
The position of the components of the system relative to the observer is determined by the binary orbit inclination angle , the disk inclination angle to the orbital plane , the precession phase with at the maximum disk opening of SS433 (T3, maximum separation between the moving emission lines) and when the disk is seen edge-on (at the moving emission line crossover moments T1 and T2, respectively).
To analyze the X-ray eclipse and precession light curve observed by INTEGRAL we have used the following three model shapes of the hard X-ray emitting region which can be parametrized by two parameters and : long narrow jets(), short narrow jets (), and short thick “jets”, or corona (). For all models the formal minimum is reached for a maximum allowed accretion disk radius and the disk opening angle (see discussion below). The accretion disk radius was limited by the distance from the relativistic object center to the inner Lagrangian point, which exceeds the radius of the Roche lobe around the compact star. This is natural for a supercritical accretion disk with a strong radial outflow (Zwitter, Calvani & D’Odorico, 1991). Further extension of the accretion disk is not justified because of the presence of narrow absorption lines of the optical A5-A7 component in the spectrum, which means that there is no appreciable screening of the optical star by the disk. Such an extension of the disk would mean that the binary system is on the common envelope evolutionary stage, and so the narrow absorption lines from the optical star surface could not be observed. The orbital period stability over 30 years of observations also suggests against the presence of a common envelope in SS 433.
The results of our analysis can be summarized as follows.


1. Long narrow jets () outflowing from the central object can be only partially screened by the disk during its eclipse and precession. Neither the observed eclipse depth nor the precession amplitude can be explained by this model. (See Fig. 8).
2. Short narrow jets () where is found from the condition that the precession variability amplitude is . The theoretical eclipse light curves for this model for different mass ratios are displayed in Fig. 9. For any this model is inconsistent with the observed 18-60 keV X-ray eclipse shape.
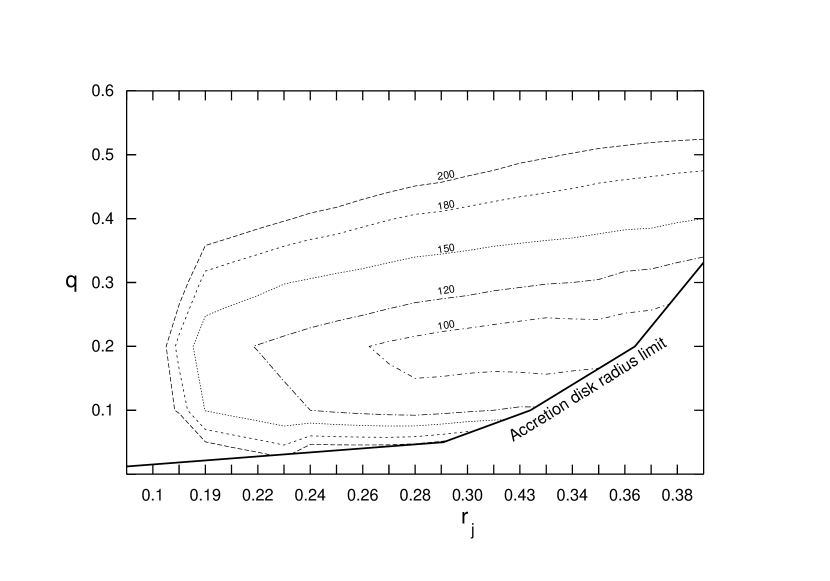
3. An extended corona () gives the best fit for the observed hard X-ray precession amplitude ( ) and the observed eclipse shape (Fig. 10). Minimum residuals in this model are attained for the mass ratio (Fig. 11), which is close to that derived from fitting the Ginga and ASCA observations with a narrow jet model (Kawai et al. 1989, Kotani et al. 1996). If we take into account only the upper envelope of the ascending X-ray eclipse branch (see above), the fit with seems to be acceptable as well (Fig. 10 and 11).
The parameters and appear to be related and cannot be determined separately. Formal decreases as , without any essential change of for . Obviously, the solution with (planar disk with zero thickness) could not provide any precessional variability, so we accepted . This also agrees with the estimates of the thickness of accretion disk from the rapid optical and X-ray variability corellation (Revnivtsev et al., 2004a).
From this analysis we conclude that in the framework of our geometrical model of the hard X-ray emitting region in SS433, the observed precession amplitude and X-ray eclipse shape are best reproduced by a broad oblate corona above an optically thick accretion disk. The best fit parameters are , and , the mass ratio .
Physically, such a corona could be thought of as hot rarefied plasma filling the funnel around the jets. In this picture outer parts of long thin jets that are not screened by the funnel walls are responsible for emission in soft X-rays, while the more extended hot corona inside the funnel produces hard X-ray flux. The estimation of the funnel size cm was obtained by Revnivtsev et al. (2004a) from the analysis of rapid non-coherent variability in SS433. The opening angle of the funnel can be quite large, so the apparent size of the outer funnel that we model here as an extended oblate corona over an opaque disk can be comparable with the accretion disk size, as our best fit parameters suggest. The nature of such a plasma inside the funnel and how it maintains its stationarity requires further studies. We also note that actual detection accuracy of the hard part of the broadband X-ray spectrum of SS433 obtained by INTEGRAL (Fig. 2 ) is insufficient to definitely rule out the presence of the two-component structure of the X-ray emitting region inferred from our analysis.
5 Optical and IR photometry


5.1 Optical photometry
Photometry of SS433 was performed simultaneously with INTEGRAL observations by the Russian-Turkish RTT-150 telescope of Kazan University at the TUBITAK National Observatory, Turkey. Observations were made using commercial camera (model DW436, www.andor-tech.com) which is termoelectrically cooled to C. The CCD was provided for RTT150 by Max-Planck Institute for Astrophysics (Garching, Germany). It is a low noise back-illuminated model from EEV with 2048 x 2048 pixels of 13.5 size. The full field of view is 8 x 8 arcmin with a frame reading time of 40 sec at 2 x 2 binning. To increase the time resolution only parts of the field of view with reference stars N 1,2,3,4,5 ( Leibowits and Mendelson, 1982) around SS433 were captured. The obtained V-light curve is presented in Fig. 12. Strong ( mag) intranight variability of the source on timescales s - 100 min is clearly detected (see Fig. 13 for the night 05/06 May 2003).
The mean V light curve during the eclipse obtained at the Crimean Laboratory of SAI (Nauchnyi, Crimea) simultaneously with the INTEGRAL observations is shown in the upper panel of Fig. 6. The detector was a pulse-counting, single-channel broad-band WBVR photoelectric photometer installed on a Zeiss-600 reflector. The photometer and software were designed and manufactured by I.I.Antokhin and V.G.Kornilov (SAI). The data were collected in the standard way using differential techniques. The main comparison star was C1 with magnitude (Gladyshev et al. 1980). The typical rms measurement errors in V were 0.02-0.03. The mean V light curve during the INTEGRAL observations corresponds to a quiet state of SS433. The optical eclipse minimum is observed at , as predicted by the orbital ephemeris given by Goranskij et al. (1998ab).
5.2 IR-photometry
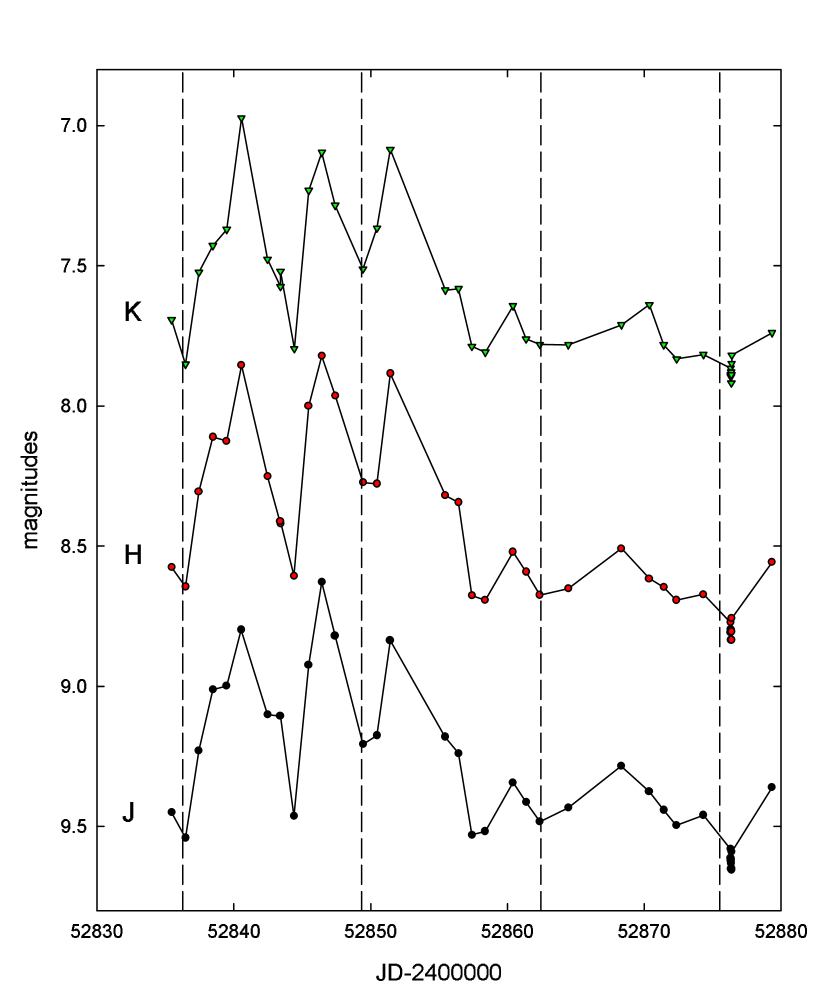
Near IR observations of SS 433 were obtained at AZT-24 1.1m telescope in Campo Imperatore (Italy) during the period of July-August 2003. Some observational data were obtained also in October - November 2003. The AZT-24 telescope at the Campo Imperatore Observatory located 2150 m above sea level (a cooperation between Rome, Teramo and Pulkovo Observatories) is used for photometric studies of variable sources at near infrared (NIR) wavelengths. The telescope is equipped with a SWIRCAM NIR 256x256 pixels imaging camera mounted at the focal plane of AZT-24. This camera was built at the Infrared Laboratories in Tucson (Arizona, USA). The SWIRCAM is equipped with a PICNIC array, an upgrade of the NIGMOS detector, with a working range of 0.9 - 2.5 . It yelds a scale of 1.04 arcsec per pixel resulting in a field of view of 4x4 sq. arcmin. The observations were performed through standard Johnson JHK broadband filters. The NIR monitoring of SS433 started several orbits after the INTEGRAL observations. The JHK light curves are presented in Fig. 14. The observations were done close to the crossover precession phase, where the orbital modulation appears to be significantly reduced. Coincidence of the minima in the IR and optical light curves support our general geometrical model.
6 Optical spectroscopy
6.1 Spectral observations
The optical spectroscopy of SS433 was performed at the 6-m telescope of the Special Astrophysical Observatory during 6 nights on April 28 and May 9-13 2003 simultaneously with the INTEGRAL observations at the precessional phase corresponding to the maximum disk opening angle (T3). The Long-Slit spectrograph (Afanasiev et al. 1995) at the telescope prime focus equipped with a 1000x1000 Photometrics CCD-detector was used to obtain spectra with a resolution of 3 A (1.2 A/pix). Standard techniques were used for spectral reduction and calibration.
Table 4 lists the spectral observations and includes date, JD of the middle of observation, orbital and precessional phases, number of spectra during the night and the mean exposure, and spectral range used. We have taken spectra in the blue region as they are the most informative when searching for the donor star absorption lines (Gies et al., 2002) and include the He II emission line. On two nights, we obtained spectra in the red region to determine the orientation of relativistic jets and identify the moving lines in all our spectra. The blue spectral range was shifted redward in the May 2003 observations because of the rising Moon. The signal-to-noise ratio in our spectra averaged over one night at Åis per resolution element in May 10-13 and it is on other dates. The signal-to-noise ratio increases towards longer wavelengths.
| Date | JD (mid) | Orbital | Precession | N | Exposure | Range (Å) |
|---|---|---|---|---|---|---|
| 2450000+ | phase | phase | (sec) | |||
| 28.04.2003 | 2758.491 | 0.054 | 0.973 | 8 | 900 | 4160–5400 |
| 09.05.2003 | 2769.466 | 0.893 | 0.041 | 3 | 600 | 5170–6410 |
| 09.05.2003 | 2769.507 | 0.896 | 0.041 | 4 | 900 | 3970–5220 |
| 10.05.2003 | 2770.458 | 0.969 | 0.047 | 4 | 600 | 5170–6410 |
| 10.05.2003 | 2770.501 | 0.972 | 0.047 | 4 | 900 | 3970–5220 |
| 11.05.2003 | 2771.490 | 0.048 | 0.053 | 8 | 900 | 4180–5430 |
| 12.05.2003 | 2772.508 | 0.126 | 0.060 | 4 | 900 | 4180–5430 |
| 13.05.2003 | 2773.492 | 0.201 | 0.066 | 4 | 900 | 4180–5430 |
6.2 Search for optical star lines
The strongest lines in SS433, hydrogen, HeI, HeII and some FeII lines, appear in emission. Emission line widths in SS433 have FWHM km/s, corresponding to Å in the blue region. The emission lines are formed in the accretion disk wind and in gas streams in the binary system. A detailed description of the SS433 spectrum can be found in Fabrika (2004). In precession phases close to the crossovers (T2), hydrogen (H and upper lines), HeI and FeII lines have narrow blueshifted absorption components with P Cyg or shell-like profiles, which are formed in gas outflow from the accretion disk. Weaker FeII lines appear as pure absorptions in these precession phases. The absorption components are also strengthened in orbital phase ; they are probably formed in the disk wind interacting with the star (Fabrika et al. 1997).
The absorption components of the shell-like line profiles and even the pure absorption lines are likely be formed in the disk wind too, which follows from the strong dependence of their intensities (Crampton & Hutchins, 1981) and radial velocities (Fabrika et al. 1997) on the precession phase. Therefore, a search for the donor star spectrum in SS433 should be made with a certain caution. The search should be made among the weakest (photospheric) lines and in precession phases where the extended disk and its outflowing wind do not intersect the line of sight. In addition, stellar lines should be stronger in the middle of the accretion disk eclipse and weaker outside the eclipse (Gies et al. 2002). The main criterion that the absorption lines are formed in the stellar photosphere is a sign of the “correct” behavior of their intensities and radial velocities with orbital phase.
Gies et al. (2002), Hillwig et al. (2004) detected weak absorption lines of TiII, FeII, CrII, SrII, CaI, FeI in the blue region 4100–4600 Å of the spectrum. They observed SS433 near the primary eclipse and in precession phases where the disk is the most ”face-on”. These lines are believed to belong to the donor star of SS433 with an A-type spectrum.
One may also try to search for stellar lines in the yellow and red regions among the weakest metallic lines, however these regions are crowded with strong moving lines of hydrogen and HeI formed in the relativistic jets. The moving lines are extremely variable and have structured profiles. This complicates the search for weak lines and the study of their behavior from date to date. For this reason we have investigated only the bluer parts of our spectra. The most informative region for stellar line studies is 4200–4340 Å where no strong emission lines and no appreciable moving lines appear at these precession phases.
The 4100–5300 Å SS433 spectra have been compared with those of the known galactic supergiants with different temperatures. We used publicly available (http://webast.ast.obs-mip.fr/stelib/) library of stellar spectra (STELIB, Le Borgne et al. 2003). These spectra were taken with the same spectral resolution (3 Å) as our spectra of SS433. For identification of lines we have used spectral atlases of Deneb (A2 Iae) (Albayrak et al. 2003) and o Pegasi (A1 IV) (Gulliver et al. 2004). Spectra of SS433 summed over one night were used for the line identification.
7 Spectral type of the optical star
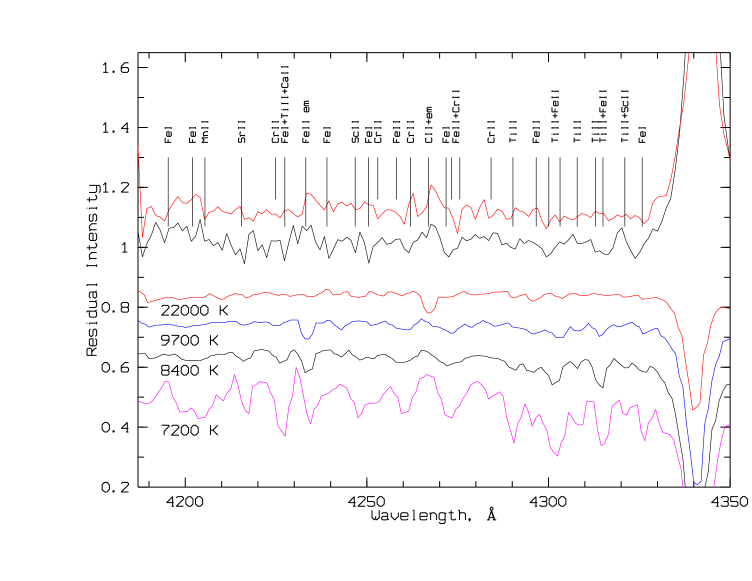
Fig. 15 shows spectra of four supergiants and two SS433 spectra taken outside and inside the eclipse, each averaged over two nights. The eclipse-out spectrum was averaged over nights 09.05.2003 and 12.05.2003 corresponding to orbital phases 0.89 and 0.12 evenly spaced from the eclipse center (the top spectrum). The in-eclipse spectrum was averaged over nights 28.04.2003 and 11.05.2003 corresponding to orbital phase 0.05 (spectrum second from the top in the figure). The supergiants shown in Fig. 15 are HD36673 (F0I, 7,200 K), HD39866 (A2I, 8,400 K), HD87737 (A0I, 9,700 K) and HD164353 (B5I, 22,000 K). All spectra were normalized and shifted along the vertical axis for better visualization.
With our spectral resolution, practically all absorption lines appear as complex blends. In Fig. 15 the lines observed out of the eclipse are marked with short vertical bars; those seen in the eclipse or present in both spectra are marked with long bars. One can see that the strongest absorptions in the spectra of supergiants are also present in SS433 and these absorption lines are deeper in the spectrum during the primary minimum. FeII emission is seen (FWHM Å), CII and NIII + HeII emissions are also marginally present.
The intensity of absorption lines during the eclipse allows us to estimate the effective temperature of the donor star to be K. This limitation was obtained from the fact that the absorption lines in SS433 cannot be deeper than those in spectra of supergiants, because the accretion disk is not totally eclipsed in the primary minima. The relative intensities of the strongest metallic absorption lines indicate a temperature of K, implying that the optical spectral class of the companion is A5-A7I.
7.1 Evidence for a heating effect in the illuminated hemisphere
The analysis of different absorption lines of the optical star reveals a strong heating effect in the illuminated star’s atmosphere. During the disk eclipse egress low-excitation absorption lines strongly weaken. The stellar hemisphere illuminated by the bright accretion disk in SS433 probably has a temperature of K, as the presence of CII absorption + emission line suggests (the top spectrum in Fig. 15). This absorption line is the strongest one in this spectral region among supergiants with temperatures T K. The evolution of the blend (FeI + FeII + CrII) is seen: in the eclipse center the low-excitation FeI line is stronger, while out of the eclipse FeII+CrII lines are enhanced. Other FeI lines also appear only in the eclipse.
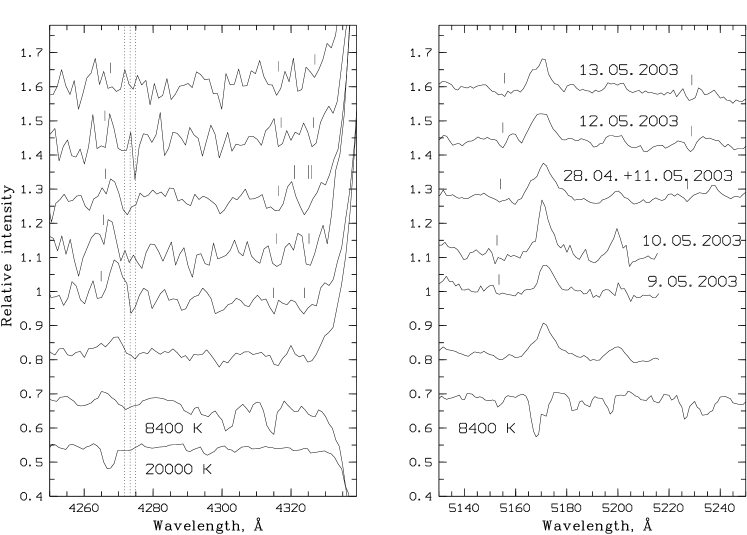
These effects are illustrated by Fig. 16, in which spectra of the standard stars with effective temperatures 8,400 K and 22,000 K are shown together with spectra of SS433 obtained on 9.05, 10.05, 28.04+11.05, 12.05 and 13.05 (orbital eclipses fell on nights 10.05 and 28.04+11.05). The orbital phase rises from bottom to top in the figure. There are emission lines in these spectral fragments — the broad structured emission of CII, and stronger emissions FeII+MgI and FeII. Note that emission lines, which presumably are formed in the disk wind, should move blueward (in phase with the compact object) in the orbital phases of our observations. In contrast, absorption lines, which are formed in the donor photosphere, must move redward during our observations. The strength of the CII absorption component (marked by vertical bars in Fig. 16) increases notably out of the eclipse. The complex blend (FeI+FeII+CrII) is marked by the dotted lines in the figure.
Fig. 16 illustrates absorption lines (marked by the vertical bars) — the blend of TiII+FeII+TiII; ScII line and the blend ScII + FeI. However the last blend may be distorted by the strong blue wing of H in the middle of eclipse. Other absorption lines shown in Fig. 16 (right panel) are (TiII+FeII) and (TiII+FeI). It is seen that these lines shift redward with time.
In Fig. 16 we also show the spectrum of SS433 averaged over all nights of observations (the third from bottom). When averaging spectra obtained on individual nights we shifted them to zero velocity according to the radial velocity curve from Fig. 18. The average spectrum has a better signal-to-noise ratio. All the absorpton lines remain in the spectrum and they are similar to the corresponding lines in the spectrum of the standard supergiant (8,400 K). The shallow emission line (presumably CII) has an absorption component. In our recent spectral observations of SS433, which were carried out around primary mimima on August 24, 2004 and September 6, 2004 (the precession phase is the same, i.e. the maximum disk opening) we confirmed the presence of the absorption lines studied in this paper. Both the spectral resolution and signal-to-noise ratio are better in the new observations. Analysis of the new data will be published elsewhere.
7.2 Measurements of the radial velocity of the optical star
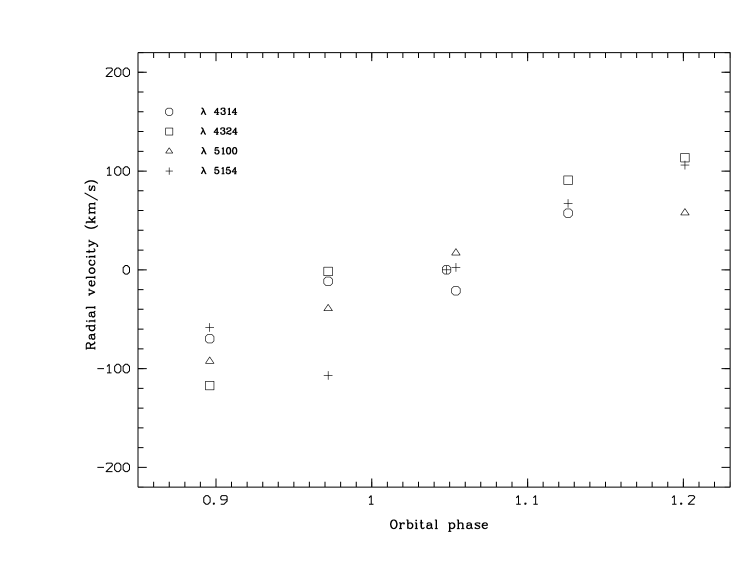
It is important to stress that the strongest absorptions (FeII, HeI) are disfavored for the optical star radial velocity analysis, as they most probably formed in the powerful outflowing disk wind (Fabrika et al. 1997). We studied radial velocities of weak absorption lines of metals. It is easy to confuse the line identification when one traces a line from date to date because of the spectral variability and orbital motion of the companions. In Fig. 17 we present individual absorption line radial velocities for four best-suited lines averaged over one night, as a function of the orbital phase for 6 nights.
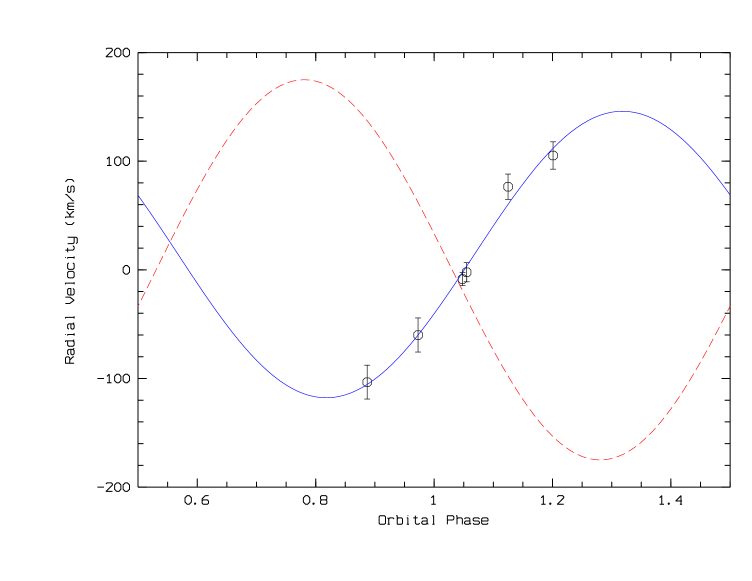
The radial velocity curve measured by the most reliable collection of 22 absorption lines in the spectral range 4200-5300 Å is shown in Fig. 18. Note that with our spectral resolution the absorption lines in the SS433 spectrum are seen as blends containing 2-3 lines, and we measured their relative radial velocities because of unknown ”laboratory” wavelengths of the blends. Relative intensities of the lines change from date to date through the eclipse. For this reason we measured only those lines and on only those dates where the lines were the most convincingly detected. The radial velocity curve (Fig. 18) has been obtained by coadding radial velocity curves of individual lines, and the zero radial velocity of all lines on 11.05.2003 (the orbital phase 0.048) was adopted. If a line was not detected on 11.05.2003, the zero radial velocity was assumed for 28.04.2003 as well (the orbital phase 0.054). If the measured radial velocity on 11.05.2003 disagreed with the whole radial velocity curve of a given line, an additional shift for the curve was applied. However no shifts in excess of 20 km/s were done. This is the reason why the radial velocity error in 11.05.2003 is small, but not zero.
Thus, the radial velocity curve for absorption lines in Fig. 18 consists of individual radial velocity curves. Each point of the curve includes from 10 to 17 individual measurements. Most measurements were carried out at the primary minimum as there the absorption lines are deeper.
The derived radial velocity semi-amplitude of the donor star is km/s, the gamma-velocity of the binary system is km/s with a formal fit uncertainty of km/s. The absorption line radial velocity transition through the -velocity occurs at the middle of the optical eclipse (), confirming that the lines actually belong to the donor star. Note that in the gamma-velocity and in the transition phase some systematic errors can be present because of the method used. However they are less than 30 km/s (no bigger shifts were applied to radial velocity curves of individual lines) and 0.05 correspondingly. The main observational bias in studying radial velocities of the donor star is the faintness of absorption lines outside the primary minima and strong intrinsic spectral variability of SS433. To confirm the derived radial velocity curve further spectral observations are needed.
Our results confirm the earlier determination of by Gies et al. (2002) which was carried out also at the maximum disk opening phases. Note that spectroscopic observations by Charles et al. (2004) were performed at the crossover phase of SS433 when the accretion disk is seen edge-on. Such a phase is disfavored for the donor star radial velocity analysis as strong gas outflows contaminate the disk plane; selective absorption in this gas affects the true radial velocity of the donor star.
The heating effect of the donor star also distorts the radial velocity semi-amplitude. The analysis (Wade and Horne 1988, Antokhina et al. 2005) indicates that the true value of the semi-amplitude of the radial velocity curve as derived from these absorption lines can be reduced to km/s (see below).
Recently Hillwig et al. (2004) obtained an estimate of the radial velocity amplitude of the donor star km/s and the gamma-velocity km/s. In our opinion, some strong lines (which actually are shell-like lines on the background of faint emission) could contribute to the radial velocity cross-correlations of Hillwig et al. (2004). For example, the two strongest lines in their Fig. 5 FeII and FeII are in emission in our spectra in the middle of eclipse.
The KPNO-2003 observations of Hillwig et al. (2004) were made in the orbital phases 0.85-1.07. Absorption lines formed in the rotating and extended envelope of the donor could be probably observed. In these orbital phases, the side of the envelope projected onto the strong continuum source (the accretion disk) moves away from the observer. Then the amplitude of the line shift can be expected to be km/s. This might explain the positive shift of the system velocity +65 km/s found by those authors.
8 Implications for binary masses
Comparison of radial velocities of the accretion disk ( km/s, Fabrika and Bychkova 1990) and optical star ( km/s) yields the mass ratio in the SS433 system (here and stand for relativistic object and optical star mass, respectively). Taken at face value, these values would lead to the optical star mass function and the binary component masses , . However, such a large mass ratio is in a strong disagreement with the observed duration of the X-ray eclipse, which suggests a much smaller mass ratio . We stress that the binary inclination angle in SS433 () is fixed from the analysis of moving emission lines.
There are two possibilities: (1) either the model we used to fit X-ray eclipses should be modified, or (2) the value of and are influenced by additional physical effects. Although there are some reasons to modify the model (e.g., the asymmetric shape of the hard X-ray eclipse, which may suggest an asymmetric wind outflow from the illuminated part of the optical star and wind-wind collision), we shall consider here only the second possibility. The reason is that the actual value of should be decreased in order to account for the observed heating effect.
Let us assume the mass ratio in the system to be , as with this value we can satisfactorily describe the width of X-ray eclipse and the observed X-ray precession amplitude (see Fig. 10). Taking km/s yields and , , km/s. Clearly, this is an unacceptable model. Now let us decrease down to 85 km/s, the lower limit that follows from a more accurate treatment of the heating effect in the radial velocity curve analysis (Wade and Horne 1988, Antokhina et al. 2005). This would yield a better fit with , , and km/s, still too high to be acceptable. Less than half of the stellar surface is sufficiently cool to give the absorption lines under study (e.g. due to sideway heating from scattered UV radiation in the strong accretion disk wind). This additionally decreases the value of the actual radial velocity semi-amplitude. Fig. 19 illustrates these considerations.
So taking, for example, km/s and yields the optical star mass function , binary masses , and the optical star radius . This radius is compatible with a typical bolometric luminosity of a A5-A7 supergiant with K. In this solution, km/s, larger than the measured value 175 km/s, but the true value of may be affected by the strong accretion disk wind.
9 Discussion
The interpretation of the binary parameters presented above is strongly based on the binary mass ratio as inferred from modeling the INTEGRAL observations of the hard X-ray eclipse with account of the observed amplitude () of the hard X-ray precessional variability of the system. The model we use (an optical star filling its Roche lobe + thick accretion disk with a hot corona) is simplistic and cannot perfectly reproduce the apparent asymmetric shape of the X-ray eclipse. In the real situation, an additional X-ray absorption by outflowing gaseous streams, extended stellar envelope or wind seems quite plausible. If we interpret the complex shape of the hard X-ray egress as being due to additional variable absorption effects, we obtain the geometry of the hard X-ray emitting region in the form of an extended oblate corona over the accretion disk. However, a straightforward interpretation of the joint RXTE+INTEGRAL spectrum of the source observed in March 2004 is also possible by a single thermal emission with a temperature of keV. No additional emitting region is required to fit this broadband X-ray spectrum.
There are two possible solutions. First, we could try to describe the observed hard X-ray spectrum by a more complex model involving two components, a hot corona + cooler thin jet radiating in the standard X-ray band. Second, we could try to accept the thin cooling jet interpretation of the X-ray spectrum, but then would have to admit a different shape of the X-ray eclipse. Our modeling shows that a thin short jet could reproduce the observed amplitude () of hard X-ray precessional variability in SS433. In that case, the shape of the X-ray eclipse must be more sharp, with shorter ingress/egress times than actually observed (cf. Fig. 9). If we look at the data, such a shape can indeed be found at the egress phase of the eclipse (see Fig. 6). The (apparently longer) ingress time could be due to additional (apart from the opaque star body) absorption of hard X-ray emission by an optically thick gaseous stream outflowing from the optical star. Apparently the same smooth ingress and egress shape of the eclipse in softer X-rays (the Ginga and ASCA data) in that case could be due to the soft X-ray emitting region located further upstream of the jets. This interpretation also explains the shallower soft X-ray eclipse.
Clearly, in this situation we need more observations of the hard X-ray eclipse to confirm the asymmetric ingress/egress eclipse shape and flatness of its bottom. We hope to do this in future INTEGRAL observations of SS433.
10 Conclusions
The results of the INTEGRAL observations of the peculiar binary system SS433 in 2003-2004 can be summarized as follows.
1. Hard X-ray emission up to keV was discovered from this superaccreting microquasar with uneclipsed hard X-ray luminosity close to the maximum opening precession phase erg/s, erg/s (assuming the 5 kpc distance to SS433), which is about 10% of the soft X-ray jet luminosity.
2. Persistent precessional variability in hard X-rays was discovered with the maximum to minimum flux ratio , which is twice as large as in the softer X-ray band.
3. The observed hard X-ray orbital eclipse is found to be in phase with the optical and near infrared eclipses. The hard X-ray eclipse is observed to be at least two times deeper than the soft X-ray eclipse. The width of the X-ray eclipse increases with energy, which is opposite to what is observed in classical X-ray binary systems.
4. The broadband X-ray spectrum 2-100 keV of SS433 simultaneously obtained by INTEGRAL and RXTE in March 2004 when the source was in its flaring state can be fitted by bremsstrahlung emission from optically thin plasma with a temperature keV.
5. Optical spectroscopic observations of SS433 on the SAO 6-m telescope which were performed in the framework of the multiwavelength INTEGRAL campaign of the source confirmed the spectral class of the optical star to be A5-A7I. The radial velocity curve of the optical component was obtained with a semi-amplitude km/s near the maximum disk opening precession phase (T3). The spectroscopic data revealed a heating effect of the hemisphere of the optical star illuminated by the accretion disk.
6. From the analysis of the hard X-ray eclipse and precession variability in SS433 we estimate the mass ratio in this binary system to be . This mass ratio and radial velocity measurements corrected for the heating effect enable us to evaluate the masses of the optical and compact star in SS433 to be , , respectively. This finding lends further support to the presence of a black hole in this peculiar superaccreting galactic microquasar.
Acknowledgements.
The authors thank E.M.Churazov for developing methods and analysis of the IBIS data and software. We acknowledge Vitaly Goranskij for comments and discussion. We also ackhowledge E.K. Sheffer, S.A. Trushkin, V.M. Lyuty, S.Yu. Shugarov, N.A. Katysheva, A.A. Lutovinov for discussions and collaboration. We especially thank Dr. D. Hannikainen for providing us with data on SS433 X-ray egress observations and M.G. Revnivtsev for processing RXTE spectra of SS433. IFB thanks the Turkish National Observatory night assistants Kadir Uluc and Murat Parmaksizoglu for their support in the photometric SS433 observations. A.N. Burenkov is acknowledged for help in spectral observations. The work of SNF is partially supported by the RFBR grant 04-02-16349. The work of KAP, ANT and IEP is partially supported by the RFBR grant 04-02-16720. The work of KAP was also partially supported by the Academy of Finland through grant 100488. NIS and IEP acknowledge the financial support from the RFBR by the grant 03-02-16068. SVM and ES acknowledge the European Space Agency for support and the Integral Science Data Center (Versoix, Switzerland) for providing computing facilities. ANT also acknowledges the financial support from the Russian Federation President Grant Program through grant MK-895.2003.02. The work of AMCh, EAA, EVS and ANT was partially supported through the grant of Leading Scientific Schools of Russia NSh-388.2003.2 and RFBR grant 02-02-17524. NAS and IFB acknowledge the support of RFBR grant 02-02-17174 and grant of Leading Scientific Schools of Russia NSh-1789.2003.2. EAB was partially supported by the RFBR grant 03-02-16133. The IR observations (YNG and AAA) are partially supported by the RFBR grant 03-02-17223a , the Program of Prezidium RAN ”Nonstationary Processes in Astronomy” and the FBNTP ”Astronomy”. We are grateful to the anonymous referee for the useful remarks which helped us to improve and clarify the article.References
- (1) Afanasiev, V.L., Burenkov, A.N., Vlasyuk, V.V., & Drabek, S.V. 1995, SAO RAS internal report No.247
- (2) Albayrak, B. Gulliver, A.F., Adelman, S.J., Aydin, C., & Kocer, D. 2003, A&A, 400, 1043
- (3) Antokhina, E.A., Seifina, E.V, & Cherepashchuk, A.M. 1992, Soviet Astron., 36, 143
- (4) Antokhina, E.A., Cherepashchuk, A.M., & Shimansky, V.V. 2005, Astron. Rep., 49, N2, in press
- (5) Aslanov, A.A., Cherepashchuk, A.M., Goranskij, V.P., Rakhimov, V.Yu., & Vermeulen, R.C. 1993, A&A, 270, 200
- (6) Begelman, M.C., Blandford, R.D., & Rees, M.J. 1984, Rev. Mod. Phys., 56, N2, 1
- (7) Chakrabarti, S. K. 2002, In ”Exotic Stars as Challenges to Evolution”, ASP Conference Proceedings, Vol. 279. Also IAU Colloquium 187, ed. C.A. Tout, W. Van Hamme (San Francisco: Astronomical Society of the Pacific), 5
- (8) Charles, P.A., Barnes, A.D., Casares, J., et al. 2004, astro-ph/0402070
- (9) Cherepashchuk, A.M. 1988, Sov. Sci. Rev. Ap. Space Phys., ed. R.A. Sunyaev, 7, 1
- (10) Cherepaschuk, A.M. 2002, Space Sci. Rev., 102, 23
- (11) Cherepashchuk, A.M., & Yarikov S.F. 1991, Soviet Astron. Lett., 17, 258
- (12) Cherepashchuk, A.M., Sunyaev, R.A., Seifina, E.V., et al. 2003, A&A, 411, L441
- (13) Cherepashchuk, A.M., Sunyaev, R.A., Fabrika, S.N., et al. 2004, in Proc. V INTEGRAL Workshop, ed. V. Schoenfelder, G. Lichti, C. Winkler (ESA SP-552), 207
- (14) Clark, D.H., & Murdin P. 1978, Nature, 276, 54
- (15) Crampton, D., Hutchings, J.B. 1981, Vistas Astron., 25, 13
- (16) Fabrika, S.N. 2004, Astrophys. Space Phys. Rev. 12, 1
- (17) Fabrika, S.N., & Bychkova L.V. 1990, A&A, 240, L5
- (18) Fabrika, S.N., Bychkova, L.V., & Panferov A.A. 1997, Bull. Spec. Astrophys. Obs., 43, 75
- (19) Fabrika, S.N., Abolmasov, P., Irsmambetova, T., 2004, in preparation
- (20) Fabrika, S., & Irsmambetova, T. 2002, in ‘New Views on Microquasars”, the Fourth Microquasars Workshop, ed. Ph. Durouchoux, Y. Fuchs, J. Rodriguez (Center for Space Physics, Kolkata, India), 268
- (21) Gies, D.R., Huang, W., & McSwain, M.V. 2002, ApJ, 578, L67
- (22) Gladyshev, S.A., Goranskii, V.P., Kurochkin, N.E., & Cherepashchuk A.M. 1980, Astron. Tsirk., 1145, 1
- (23) Goranskij, V.P., Esipov, V.F., & Cherepashchuk, A.M. 1998a, Astron. Rep., 42, 209
- (24) Goranskij, V.P., Esipov, V.F., & Cherepashchuk, A.M. 1998b, Astron. Rep., 42, 336
- (25) Gulliver, A.F. Adelman, S.J., & Friesen, T.P. 2004, A&A, 413, 285
- (26) Hillwig, T.C., Gies, D.R., Huang, W., et al. 2004, astro-ph/0403634
- (27) Kawai, N., Matsuoka, M., Pan, H.-C., & Stewart G.S. 1989, PASJ, 41, 491
- (28) Kotani, T., Kawai, N., Matsuoka, M., & Brinkmann, W. 1996, PASJ, 48, 619
- (29) Le Borgne, J-F., Bruzual, G., Pello, R., et al. 2003, A&A, 402, L433
- (30) Leibowits, E.M., & Mendelson, H. 1982, PASP, 94, 977
- (31) Lind, K.R., & Blandford, R.D. 1985, ApJ, 295, 358
- (32) Margon, B. 1984, ARA&A, 22, 507
- (33) Margon, B., Stone, R.P.S., Klemola, A., et al. 1979, ApJ, 230, L41
- (34) Panferov, A.A., & Fabrika, S.N. 1997, Astron. Rep. 41, 506
- (35) Revnivtsev, M., Burenin, R., Fabrika, S., et al. 2004a, A&A, 424, L5
- (36) Revnivtsev, M.G., Sunyaev, R.A., Varshalovich, D.A., et al. 2004b, Astron. Lett., 30, 382
- (37) Shakura, N.I., & Sunyaev R.A. 1973, A&A, 24, 337
- (38) Trushkin, S.A., Bursov, N.N., & Smirnova, Yu.V. 2001, Astron. Rep. 45, 804
- (39) Trushkin, S.A. 2003, Bull. Spec. Astrophys. Obs., 56, 57 (astro-ph/0403037)
- (40) Trushkin, S.A. 2004, http://cats.sao.ru/ satr/XB/SS433/
- (41) Wade, R.A., & Horne K. 1988, ApJ, 324, 411
- (42) Yuan, W., Kawai, N., Brinkmann, W., & Matsuoka, M. 1995, A&A, 279, 451
- (43) Zwitter, N., Calvani, M., & D’Odorico, S. 1991, A&A, 251, 92