Extreme X-ray spectral variability in the Seyfert 2 Galaxy NGC 1365
Abstract
We present multiple Chandra and XMM-Newton observations of the type 1.8 Seyfert Galaxy NGC 1365, which shows the most dramatic X-ray spectral changes observed so far in an AGN: the source switched from reflection dominated to transmission dominated and back in just 6 weeks. During this time the soft thermal component, arising from a kpc region around the center, remained constant. The reflection component is constant at all timescales, and its high flux relative to the primary component implies the presence of thick gas covering a large fraction of the solid angle. The presence of this gas, and the fast variability time scale, suggest that the Compton-thick to Compton thin change is due to variation in the line-of-sight absorber, rather than to extreme intrinsic emission variability. We discuss a structure of the circumnuclear absorber/reflector which can explain the observed X-ray spectral and temporal properties.
1 Introduction
According to the Unified Model of Active Galactic Nuclei (AGNs, see
review by Urry & Padovani, 1995), an axisymmetric
absorber/reflector is present around the central black hole of AGNs,
with a size between that of the Broad Emission Line Region (BELR,
, Schwarzschild radii, corresponding to pc
for a black hole) and that of the Narrow Emission Line region
(tens to hundreds parsecs). The simplest geometrical and physical
configuration of such absorber is that of a homogeneous torus (Krolik & Begelman 1988)
beyond the dust sublimation radius ( pc,
Barvanis 1987, where
is the UV luminosity in units of erg s-1).
However, this view has been recently challenged by several pieces of
observational evidence:
(1) Dramatic X-ray absorbing column density changes (factors of 10)
over a few years have been seen in several type 2 (narrow permitted
line) Seyferts (Risaliti, Elvis & Nicastro 2002),
ruling out a homogeneous absorber.
(2) Rapid column density variability, on time scales of hours,
requires an X-ray absorber no larger than the BELR. Such changes have
been detected in the brightest absorbed Seyfert Galaxy, NGC 4151
( hours, Puccetti et al. 2004) and in the Seyfert 2 Galaxy NGC 4388
(4 hours, Elvis et al. 2004). Assuming that the absorber is made of
material moving with Keplerian velocity around the central source,
these observations imply that its distance is of the order of that of
the broad line clouds, i.e. , where is
the Schwartzschild radius.
(3) The reflection components in the X-ray spectra of Compton thin
Seyfert Galaxies are systematically stronger than expected from
reflection off gas with the same column density measured in
absorption. This has been shown convincingly for a few sources in
which a detailed measurement of the reflection component has been
possible (NGC 1365, Risaliti et al. 2000; NGC 2992, Gilli et
al. 2002; NGC 6300, Guainazzi et al. 2003) and in a statistical sense
in a sample of bright Seyfert 2s (Risaliti 2002).
NGC 1365 (=0.0055) is a particularly striking example of extreme X-ray variability and highly efficient reflection. It was observed by ASCA in 1995 (Iyomoto et al. 1997) in a reflection-dominated state (Thomson optical depth , corresponding to N cm-2) and, three years later, in a Compton-thin state ( cm-2) by BeppoSAX (Risaliti et al. 2000). The 2-10 keV flux of the reflection emission was more than 5% that of the intrinsic spectrum measured by BeppoSAX. This corresponds to a ratio R=1 between the normalizations of the reflected and direct components in the PEXRAV reflection model (Magdziarz & Zdziarski 1995) Such a high reflection efficiency can be achieved only if a thick (N cm-2) reflector covers a large fraction of the solid angle around the central source (Ghisellini, Haardt & Matt 1994).
Similar switching from reflection-dominated to transmission dominated states has now been observed in a handful sources on timescales of a few years (Matt, Guainazzi & Maiolino 2004) and could be due either to extreme variations of the intrinsic luminosity and so of the ionization state of the absorber (as suggested by Matt et al. 2004), or to Compton-thick clouds moving across the line of sight, so changing the line of sight column density111It is worth noticing the conceptual difference between “reflection dominated” (which merely refers to the observed spectral shape) and “Compton thick” (which implies a physical interpretation of the observed reflection dominated spectrum as due to Compton thick absorption of the direct component)..
Here we present an X-ray observational campaign on NGC 1365, consisting of 3 XMM-Newton observations, plus a Chandra observation (Obsid 3554) performed just three weeks before the first XMM-Newton observation. The observing times are relatively short ( ksec), therefore a temporal analysis within single observations is not possible. We will therefore discuss the spectra extracted from the whole observations. Two more, longer (60 ksec), XMM-Newton observations were recently performed, as a continuation of our program of monitoring of this source. Detailed spectral analysis of all the XMM-Newton observations will be presented in a forthcoming paper (Risaliti et al. 2005, in prep.)
Here we will concentrate on the analysis of the most striking
result of our study, i.e. dramatic hard X-ray continuum variations:
changes from
reflection-dominated to transmission-dominated
spectra occurred on times scale
shorter than three weeks.
During this time, the soft thermal component remained constant in all
observations. The high resolution of Chandra allowed us to
resolve this emitting region, which extends over kpc from the
center, while the hard component originates in a region pc
(2 arcsec) diameter222Throughout this paper we adopt
km s-1 Mpc-1 (Spergel et al. 2003)..
The observation log of the X-ray observations of NGC 1365 is reported in Table 1 together with basic spectral fitting results (§2).
2 Data Analysis and Results
The spectra presented here have been obtained with CCD detectors: the ACIS-S instrument on board Chandra, and the EPIC PN and MOS instruments on board XMM-Newton. All observations were performed in full-frame mode. We did not find any significant pile-up. This was expected for XMM-Newton (the previous published 2-10 keV flux is erg s-1 cm-2, mostly emitted at energies keV) , while for Chandra this is a consequence of the extremely faint state of the source (Table 1) at that time.
The data were reduced using the standard procedures, using the CIAO v.3.0 package for the Chandra observation and SAS v6.0 for the XMM-Newton observations. The spectra were extracted from circular regions of a radius of 2” (Chandra) and 30” (both Chandra and XMM-Newton). The background spectra were extracted from regions close to our source and free from contamination by bright serendipitous sources. The background contribution is negligible for the Chandra spectrum of the central 2” radius region (thanks to the small extraction region), and for the two XMM-Newton spectra when the source was caught in a bright state (XMM 1 and XMM 3). In the remaining two spectra (XMM 2, and the Chandra spectrum from the 30” radius region) the background contamination is %.
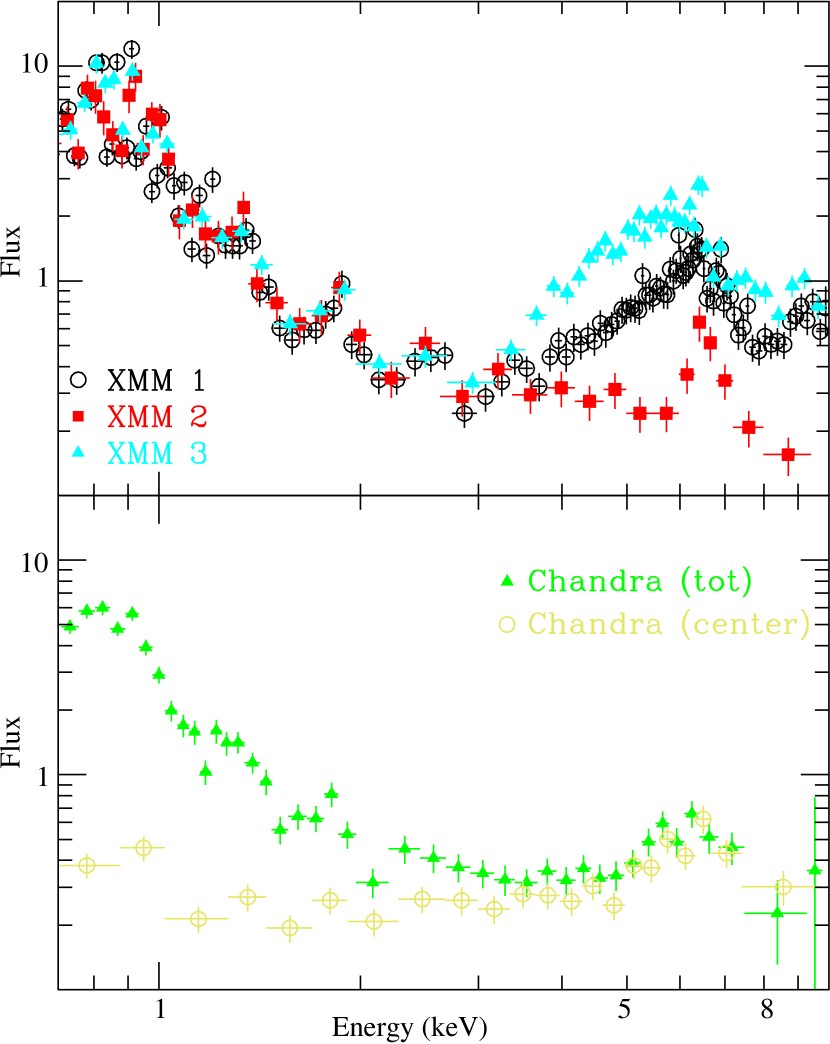
The spectra were analyzed using the XSPEC 12.0 package. The spectra of the XMM-Newton observations are shown in Fig. 1. A visual inspection of this figure is sufficient to clearly notice the main spectral variation: in the 2-10 keV band the XMM 2 spectrum is an order of magnitude weaker than the XMM 1 and XMM 3 observations and has a prominent iron line with an equivalent width EW keV. The continuum is also significantly flatter than in the XMM 1 and XMM 3 5-10 keV spectra (at lower energies, the XMM 1 and XMM 3 spectra are inverted, due to a photoelectric cut off). These features strongly suggest that during the XMM 2 observation the source was in a reflection-dominated state.
One more interesting aspect is the constancy (within 5%) of the soft emission. This suggests that the soft spectrum is dominated by a component not directly related to the primary AGN emission. This is confirmed by the visual analysis of the Chandra spectra of the central 2” region, and of the 30” region: most of the soft emission comes from the extended region between 2” and 30” (corresponding to a sphere of outer radius of kpc).
In order to confirm the results of this visual inspection, we performed a detailed spectral analysis of each observation. The complete report on this work will be presented elsewhere (Risaliti et al. 2005, in prep.). In the following we briefly summarize the results relevant for our interpretation of the continuum variations.
Chandra. The Chandra spectrum obtained from the central 2” is unusually flat: the photon index of a simple power law model is . A good fit is obtained with a cold reflection model (PEXRAV in XSPEC), plus an iron emission line at 6.4 keV (equivalent width EW=200 eV). A soft thermal component is not required by the data. The spectrum obtained from the larger 30” radius region can be fitted with the same components, plus thermal emission with kT0.8 keV, with a normalization consistent with that found in all the XMM-Newton observations. This implies that a) the hard emission comes from the central region; b) the soft component originates from a larger nuclear region (radius kpc).
XMM 1. The first XMM spectrum, obtained only 3 weeks after the Chandra observation, is clearly dominated by the direct emission of the AGN above keV. The best fit model consists of all the components used to fit the Chandra spectrum, plus an absorbed power law, completely dominating the emission above a photoelectric cut off at keV ( cm-2) The best fit parameters for the cold reflection are fully consistent with those found in the Chandra observation. The ratio between the normalizations of the reflection component and the power law is R=1.2.
XMM 2. The second XMM spectrum was obtained 3 weeks after the first. The spectrum is now back in a reflection-dominated state (Fig. 1). The best fit model consists of two components: a cold reflection emission, and an iron emission line at E=6.4 keV, with EW1.2 keV. All the parameters of the cold reflection component are consistent with those found in the previous XMM 1 and Chandra spectra.
XMM 3. This spectrum, obtained 5 months after the XMM 2 observation, is dominated by the direct emission from the central source. The best fit model is the same as in XMM 1, with a normalization of the direct component higher by 50%, and an absorbing column density N cm-2. The reflection component is consistent with that of XMM 1 and XMM 2. The ratio between the normalizations of the reflection component and the power law is R=0.8.
The fit is significantly improved () by the addition of a broad (possibly relativistic) iron emission line333This is an important point in itself, however it does not affect our treatment of the continuum variations, therefore we will not discuss it further here, but in Risaliti et al. (2005)., although other models, e.g. partial covering and a second, lower , absorber (as in NGC 4151, Zdziarski et al. 2002) may also fit.
3 Discussion
The spectral analysis of multiple Chandra and XMM-Newton observations of NGC 1365 reveals transitions from reflection-dominated to transmission-dominated, on time scales no longer than 3 weeks. This is, by a factor of 30, the shortest time scale observed so far for such extreme X-ray spectral variations (Matt et al. 2003) While we also find a kiloparsec scale diffuse origin for the soft thermal component and the possible presence of a relativistic iron line in the highest statistics observation, we will defer discussing of these issues to where we can also consider two new, longer ( ksec) XMM-Newton observations (Risaliti et al. 2005, in prep.). Here we concentrate on the fast spectral transitions.
The extreme column density variations observed from the Chandra and XMM 1 observations, and from XMM 1 and XMM 2 can be due to either: (A) fading of the central source, down to a flux 50 times or more fainter than in the “transmission dominated” observations; (B) increased ionization making the absorber more transparent; (C) column density variability, with the reflection dominated spectra having cm-2 along the line of sight,
(A) Fading of the central source. In the intrinsic variability
scenario, an almost complete switch-off of the source (down to a flux
% of the intrinsic flux in the XMM 1 observation) is needed, in
a time shorter than 3 weeks. This can be compared with the typical cooling time
of the inner part of the accretion disk444Here we assume that
the fading in the X-rays is due to a decrease of the seed photons
from the disk which are up-scattered by the coronal hot electrons..
The thermal timescale in a Shakura-Sunyaev (1972) disk is approximately
(Frank, King & Raine 2002, Starling et al. 2004), where is the
viscosity parameter ( for a realistic model), and
is the Keplerian angular velocity, .
The black hole mass, can be estimated from the K magnitude
of the galaxy (K=8.4, Jarrett et al. 2003), through the relation
between black hole mass and luminosity in the K band (Marconi & Hunt 2003).
We obtain , and
days, where is the linear
dimension of the X-ray source in units of .
Given the uncertain assumptions this result is in
marginal agreement with our observational requirement
days. However, this requires an
extreme scenario, i.e. the complete switch off of the source right after
the XMM 1 observation. We conclude that intrinsic variability due to disk cooling
is an unlikely explanation for the observed spectral changes.
However, in order to rule it out completely, shorter
variations (in a timescale of a few days) should be observed.
(B) Ionization changes. In order to make the cold absorber
found in the Chandra and XMM 2 observations transparent, an
increase of the ionization parameter 555
, where is the number density of the absorbing gas.
by at least orders of magnitude
would be needed (from , as required in order to completely
obscure the 1-10 keV emission, to , as required in order to make
the gas transparent. This would in turn imply a similar increase in
the intrinsic luminosity, which is not seen.
(C) variability.
We assume (as in Risaliti et al. 2002, Elvis et al. 2004) that the
absorber is made up of gas clouds moving around the central source
with Keplerian velocity (motions close to Keplerian dominate in the
high ionization parts of the BELR in AGNs, Peterson & Wandel 2000).
The variability timescale is then given, to a first approximation, by
the crossing time for a cloud across the line of sight.
Assuming
spherical clouds, the distance of the absorber
from the center is (Risaliti et al. 2002):
where is the variability time in units of 100 ksec,
is the cloud density in units of 1010 cm-3
and is the column density of a single cloud in
units of 1024 cm-2.
Assuming that the variations from Compton thick to Compton thin
states were due to
a single cloud passing along the line of sight, the measured
variation, cm-2, corresponds to the
column density of a single cloud.
We further assume the cloud
crossing time to be no longer than the time interval between the XMM 1 and XMM 2
observations, .
With these numbers we obtain
.
A further stringent requirement for
the absorbing cloud is to be large enough to cover the X-ray source.
Using (see above), and assuming again a linear dimension
of the X-ray source D20 , we obtain cm-3 and
cm. For comparison, the dust sublimation
radius (assuming the standard X-ray to bolometric correction of Elvis et al. 1994)
is of the order of cm.
The Compton thick - Compton thin variation discussed here is, by
a factor 30,
the fastest observed so far (Matt et al. 2003, Guainazzi et al. 2004).
Therefore, the arguments used to rule out
the intrinsic variability scenario are significantly less stringent in the other
known cases. As a consequence, it is at present impossible to tell
whether the observed extreme variability in NGC 1365 is an unique
case or is representative of the other known state-changing sources.
However, several general considerations
can be made on the occurence of such variations, which are relevant
in modeling the circumnuclear medium of AGN, and in driving further
studies:
- Compton thick gas seems to be present in (almost) all X-ray obscured
Seyfert Galaxies.
In 40-50% of the sources it covers the line of sight to the central
X-ray source (Risaliti, Maiolino & Salvati 1999). In the other X-ray obscured
Seyfert Galaxies bright enough to allow a careful X-ray spectral analysis, the
high reflection efficiency suggests the presence of Compton thick gas
reflecting the primary emission (see Introduction).
- Even if we ascribe all the known thick-thin transitions to variability,
this event is still quite rare:
only four objects are known to show such variations (Matt et al. 2003) out
of the more than 30 known Compton thick AGNs (Comastri 2004). Recently
Guainazzi et al. (2004) found one more example (NGC 4939) in a sample of 11 objects.
- The few indications available on short time scale variations (for example
this work, and Elvis et al. 2004) suggest that the absorber is rather
compact, at a distance of from the central source.
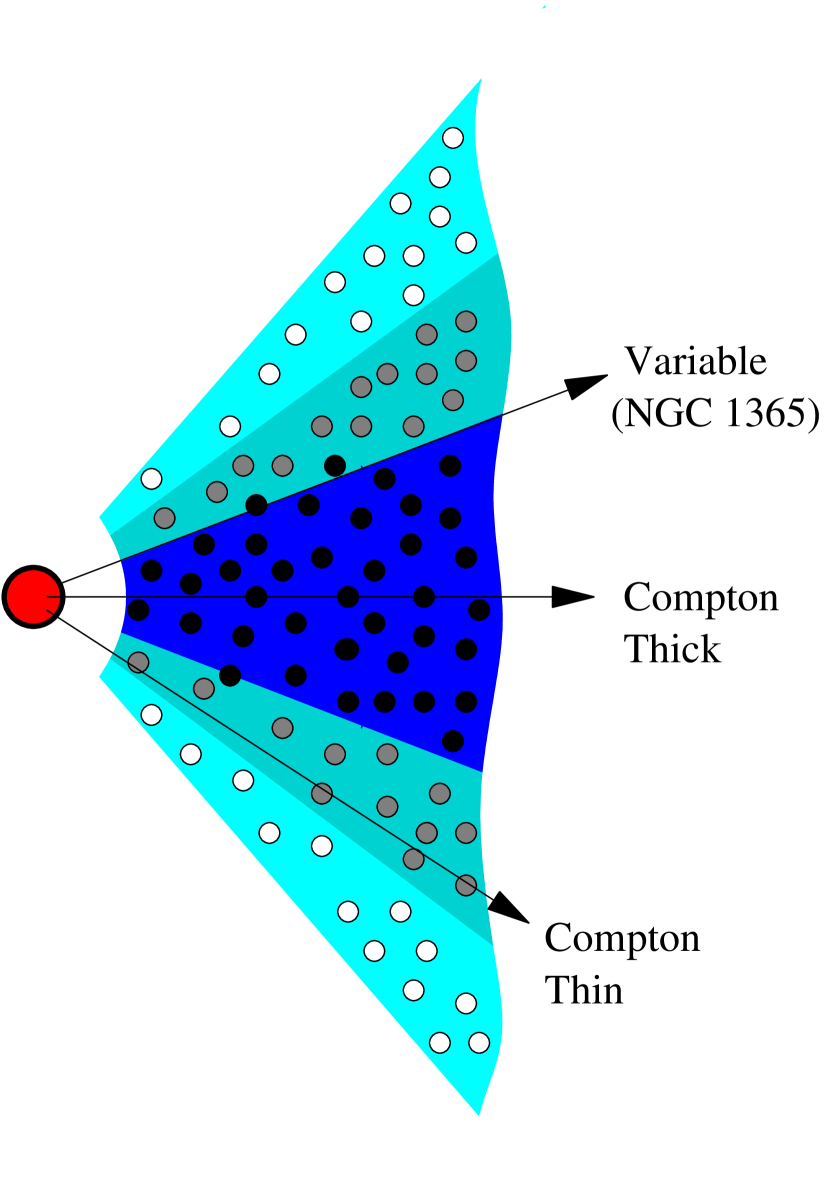
This observational evidence can be explained if we assume a stratified structure for the circumnuclear absorber/reflector, with a central planar Compton-thick region and a decreasing average column density at greater angles or distance above the disk (Fig. 2). The gas is clumpy and at the distance of the order of that found in NGC 1365 (). The average number of clouds along a given line of sight is (except, possibly, for the completely Compton thick region), in order to reproduce the observed average variability in bright AGNs (Risaliti et al. 2002). The angles have been chosen in order to reproduce the observed column density distribution of Risaliti et al. (1999), with fractions of 45%, 25% and 10% of the solid angle covered by gas with column density cm-2, cm-2, and cm-2, respectively, and with the remaining 20% free from absorption, in agreement with the obscured/unobscured Seyferts ratio of Maiolino & Rieke (1995).
In this scheme strong absorption variations are unlikely in the extreme cases of heavily Compton-thick sources (line of sight through the central region of the absorber) and low obscuration ( cm-2) sources (line of sight far from the absorber), while they can happen if the line of sight intersects the transition region between the Compton thick and Compton thin zones. In this simple scheme, NGC 1365 is one of the sources seen through this “transition region”. We note that a similar stratified and compact structure has been proposed to explain the relative X-ray/mid IR absorption properties of Luminous Infrared Galaxies (Risaliti et al. 2000), and to explain the distribution and the megamaser emission in AGNs (Kartje, Königl & Elitzur 1999). In this latter case the distribution arises as the result of a disk wind.
The proposed scheme needs to be tested with more detailed studies of the single sources showing the most extreme variability (a new XMM-Newton observational campaign is on going) and with an unbiased statistical analysis of the occurence of such extreme variations.
References
- (1) Comastri, A. 2004, in “Supermassive Black Holes in the Distant Universe”, ed. A. J. Barger, (Boston: Kluwer Academic Publishers), 308, 245-172
- Elvis et al. (2004) Elvis, M., Risaliti, G., Nicastro, F., Miller, J., & Puccetti, S. 2004, ApJ, 635, L25
- Frank, King, & Raine (2002) Frank, J., King, A., & Raine, D. J. 2002, Accretion Power in Astrophysics: Third Edition, by Juhan Frank, Andrew King, and Derek J. Raine. Cambridge University Press, 2002
- Ghisellini, Haardt, & Matt (1994) Ghisellini, G., Haardt, F., & Matt, G. 1994, MNRAS, 267, 743
- Gilli et al. (2000) Gilli, R., Maiolino, R., Marconi, A., Risaliti, G., Dadina, M., Weaver, K. A., & Colbert, E. J. M. 2000, A&A, 355, 485
- Guainazzi (2002) Guainazzi, M. 2002, MNRAS, 329, L13
- Guainazzi et al. (2004) Guainazzi, M., Fabian, A. C., Iwasawa, K., Matt, G., & Fiore, F. 2004, MNRAS, in press (astro-ph/0409689)
- Iyomoto et al. (1997) Iyomoto, N., Makishima, K., Fukazawa, Y., Tashiro, M., & Ishisaki, Y. 1997, PASJ, 49, 425
- Jarrett et al. (2003) Jarrett, T. H., Chester, T., Cutri, R., Schneider, S. E., & Huchra, J. P. 2003, AJ, 125, 525
- (10) Kartje, J. P., Königl, A., & Elitzur, M. 1999, ApJ, 513, 180
- Krolik & Begelman (1988) Krolik, J. H. & Begelman, M. C. 1988, ApJ, 329, 702
- Magdziarz & Zdziarski (1995) Magdziarz, P. & Zdziarski, A. A. 1995, MNRAS, 273, 837
- Marconi & Hunt (2003) Marconi, A. & Hunt, L. K. 2003, ApJ, 589, L21
- Matt, Guainazzi, & Maiolino (2003) Matt, G., Guainazzi, M., & Maiolino, R. 2003, MNRAS, 342, 422
- Peterson & Wandel (2000) Peterson, B. M. & Wandel, A. 2000, ApJ, 540, L13
- (16) Puccetti, S., Risaliti, G., Fiore, F., Elvis, M., Nicastro, F., Perola, G.C., Capalbi, M. 2003, Proc. of the BeppoSAX Symposium, The Restless High-Energy Universe, E.P.J. van den Heuvel, J.J.M. in ’t Zand, and R.A.M.J. Wijers (Eds), astro-ph/0311446
- Risaliti et al. (1999) Risaliti, G., Maiolino, R., & Salvati, M. 1999, ApJ, 522, 157
- Risaliti, Maiolino, & Bassani (2000) Risaliti, G., Maiolino, R., & Bassani, L. 2000, A&A, 356, 33
- Risaliti (2002) Risaliti, G. 2002, A&A, 386, 379
- Risaliti, Elvis, & Nicastro (2002) Risaliti, G., Elvis, M., & Nicastro, F. 2002, ApJ, 571, 234
- Shakura & Sunyaev (1973) Shakura, N. I., & Sunyaev, R. A. 1973, A&A, 24, 337
- Spergel et al. (2003) Spergel, D. N., et al. 2003, ApJS, 148, 175
- Starling, Siemiginowska, Uttley, & Soria (2004) Starling, R. L. C., Siemiginowska, A., Uttley, P., & Soria, R. 2004, MNRAS, 347, 67
- Urry & Padovani (1995) Urry, C. M. & Padovani, P. 1995, PASP, 107, 803
- Zdziarski et al. (2002) Zdziarski, A. A., Leighly, K. M., Matsuoka, M., Cappi, M., & Mihara, T. 2002, ApJ, 573, 505
Observatory Date Counts Ta N F(2-10)c L(2-10)d Chandraf 2002 Dec 24 7478 14.6 1.98(g) – – 0.21 0.14 1.09 XMM-1 2003 Jan 16 14866 17.8 2.06 47.6 1.2 0.48 1.23 1.09 XMM-2 2003 Feb 09 3503 5.8 2.09(g) – – 0.17 0.11 1.06 XMM-3 2003 Aug 13 9466 8.7 2.33 33.5 0.8 0.70 2.30 1.21
a: Duration (ksec). b: in units of 1022 cm-2. c: Ratio between the normalizations of the reflected and transmitted components. d: Observed 2-10 keV flux, in units of 10-11 erg s-1 cm-2. e: 2-10 keV luminosity in units of erg s-1. For the transmission dominated spectra, the luminosity is absorption corrected. f: 2 arcsec dia. aperture. g: photon index of the intrinsic power law in the PEXRAV model.