Near-Infrared echelle spectroscopy of Proto-Planetary Nebulae: probing the fast wind in H2
Abstract
Echelle spectroscopy of H2 2.122 m, [FeII] 1.644 m and Br line emission from a very young planetary nebula, IRAS 21282+5050, and from four proto-planetary nebulae, IRAS 19343+2926 (M 1-92), IRAS 17150-3224 (AFGL 6815), IRAS 17423-1755 (Hen 3-1475), and IRAS 17441-2411 is presented. H2 line emission is detected in discrete shock fronts in the lobes of each nebula, regardless of source spectral type (although non-detections in IRAS 09371+1212 (Frosty Leo) support claims that late spectral types do not produce bright H2 line emission). In IRAS 17150-3224 we also uncover possible signs of rotation, as would be expected if the H2 features were excited in a magneto-centrifugal disk wind. [FeII] 1.644 m emission was detected in only one source, M 1-92 (notably, the source with the brightest H2 features). Again, the emission is predominantly excited in high-velocity shocks in the bipolar lobes of the PPN. The H2 and [FeII] observations of M 1-92, and the complex H2 profiles in IRAS 21282+5050, are explained using the shock models of Smith and collaborators. We show that bow shock models are generally able to account for the observed line profiles, peak velocities, the double-peaked profiles in IRAS 21282+5050 and the spatial distribution of H2 and [FeII] in M 1-92. J-type bow models are adequate in each case, i.e. a strongly-magnetised wind is not required.
Finally, Br is detected in each of the five targets; in absorption in the G-type PPN though in emission in the O and B-type sources. Br emission is detected predominantly toward the near-IR continuum peak in each PPN, with only very weak emission detected in the extended lobes of the O- and B-type sources. In Br, low peak velocities, though very broad profile widths, are measured in each target, regardless of nebula inclination angle. The emission must therefore derive from ionised regions in a fast wind very close to the central star (rather than from shocks in the bipolar lobes), or, in the late-type sources, from absorption in an equatorial torus.
keywords:
circumstellar matter – infrared: stars – infrared: planetary nebulae – ISM: jets and outflows – ISM: kinematics and dynamics1 Introduction
The proto-planetary nebula (PPN) phase is a short-lived episode in the rapid evolution of stars from the asymptotic giant branch (AGB) to the planetary nebula (PN) phase (Kwok 1993). The central stars of PPN are still too cool to ionise the slow-moving circumstellar shell ejected during the AGB phase, yet they appear to drive collimated, high-velocity winds which shock and shape this shell, and almost certainly entrain slow-moving AGB ejecta to produce a fast molecular wind (Lee & Sahai 2003).
From recent observations, particularly high-resolution imaging studies (e.g. Sahai et al. 1998; Bujarrabal et al. 1998a; Sahai, Bujarrabal & Zilstra 1999; Ueta, Meixner & Bobrowski 2000; Su, Hrivnak & Kwok 2001), it has become clear that the rapidly-evolving PPN phase ultimately shapes the morphology of the resulting PN. At some point during or soon after the detachment of the AGB envelope, the mass-loss geometry changes from more-or-less spherically symmetric to axially symmetric. Bipolar morphologies, knotty jets and Herbig-Haro (HH)-like “bow shocks” are all manifestations of this evolutionary process. Indeed, they seem to be present even in relatively “young” PPN.
Recently, Bujarrabal et al. (2001) have found that radiatively-driven winds cannot account for the high momentum and energy implied by their CO observations of PPN fast winds. This has prompted theorists to look beyond the classical “interacting stellar winds” model of Kwok et al. (1978) and investigate whether an accretion disk scenario, similar to that used to explain jets from young stars and active galactic nuclei, could be used to explain both the high degree of collimation and the point symmetry seen in many PPN jets (Soker & Rappaport 2000; Frank & Blackmann 2004). In these models, the accretion disk must form through binary interactions. Magneto-centrifugal launching from the surface of the disk is then a means of converting gravitational energy into kinetic energy in a fast wind. If magneto-hydrodynamics (MHD) do dictate the energetics and collimation of PPN outflows (see also García-Segura et al. 1999; Blackman et al. 2001), then they will also define the physics of the shocks in these flows, an effect which can be investigated with high-resolution observations of the emission regions associated with the shocks.
We therefore observed a modest number of PPN and young PN at high spectral resolution. Our sample includes reddened PPN (IRAS 17150-3224, IRAS 17441-2411, IRAS 09371+1212 [Frosty Leo] and IRAS 17106-3046) as well as more evolved PPN and young PN (M 1-92, IRAS 17423-1755 and IRAS 21282+5050), sources with earlier spectral types that are on the brink of the transition to the PN stage. We sought observations in a number of atomic and molecular gas tracers. H2 1-0S(1) emission at 2.122 m is an important probe of excited molecular gas in the detached AGB envelope (90% of the AGB ejecta will be atomic/molecular), while Br recombination line emission is potentially a useful tracer of the fast, ionised wind. [FeII] at 1.64 m could also be an excellent tracer of moderate-to-high excitation shocks in the fast wind and/or the interaction zone between the wind and AGB envelope (the Fe+ ionisation fraction peaks at K for cm-3; [FeII] has been shown to be a useful diagnostic in studies of HH shocks, e.g. Nisini et al. 2002; Davis et al. 2003a). In the dense, inner-core regions of each PPN, these near-IR lines are also less affected by extinction than their optical counterparts, and so are expected to be ideal probes of the dynamical interaction between the fast wind and AGB envelope.
| IRAS | Other | Central1 | RA3 | Dec3 | Date4 | Date4 | Date4 | Slit5 | Ref7 | ||
|---|---|---|---|---|---|---|---|---|---|---|---|
| number | name | star | (kpc) | (2000.0) | (2000.0) | (H2) | (Br) | ([FeII]) | P.A. | ||
| 21282+5050 | O9 | 3 | 21 29 58.5 | 51 04 00 | 040728 | 040728 | 040728 | 160° | 0° | 1 | |
| 19343+2926 | M 1-92 | B0.5V | 2.5 | 19 36 18.9 | 29 32 51 | 040430,040705 | 040530 | 040530 | 133° | 35° | 2 |
| 17423-1755 | Hen 3-1475 | Be | 5 | 17 45 14.2 | -17 56 47 | 040615,040705 | 040624 | 040624 | 135° | 50° | 3 |
| 17441-2411 | AFGL 5385 | G0 | 4 | 17 47 13.5 | -24 12 51 | 040625,040703 | 040625 | 040705 | 197° | 30° | 4 |
| 17150-3224 | AFGL 6815 | G2I | 2.4 | 17 18 19.8 | -32 27 21 | 040615,040705 | 040625 | 040625 | 125° | 30° | 5 |
| 09371+1212 | Frosty Leo | K7II | 3 | 09 39 53.6 | 11 58 54 | 040428 | – | – | 156° | 15° | 6 |
| 17106-3046 | ? | ? | 17 13 51.6 | -30 49 40 | 040625 | – | – | 128° | 52° | 7 |
-
1
Optical spectral type of the central object
-
2
Estimated distance to the source
-
3
Central source position.
-
4
UT date of the H2 2.122 m, Br and [FeII] 1.644 m observations of each target (year/month/day). The “left” and “right” H2 slits referred to in Section 3 were, in most cases, observed on the second date in column 7.
-
5
Position angle, measured East of North, of the echelle slit. The same angle was used at each wavelength, and for each of the three adjacent H2 slit positions (the angle corresponds to the axis of the bipolar lobes in each PPN).
-
6
Inclination angle of the bipolar nebula with respect to the plane of the sky.
-
7
References to and : 1) Meixner et al. 1997; 2) Bujarrabal et al. 1997, Bujarrabal et al. 1998b; 3) Riera et al. 1995, Borkowski & Harrington 2001; 4) Su et al. 1998, Weintraub et al. 1998; 5) Loup et al. 1993; 6) Mauron et al. 1989, Roddier et al. 1995; 7) Kwok et al. 2000
2 Observations and Data Reduction
Echelle spectra at 1.6440 m, 2.1218 m and 2.1662 m were obtained at the 3.8 m United Kingdom Infrared Telescope (UKIRT), on Mauna Kea, Hawaii, on various dates in Spring 2004 (see Table 1). The cooled grating spectrometer CGS 4 (Mountain et al. 1990) was used. This instrument is equipped with a 256256 pixel InSb array and a 31 lines/mm echelle grating. The pixel scale is 0.41″0.88″ (0.41″ in the dispersion direction). A 2-pixel-wide slit was used, resulting in a velocity resolution of km s-1 (this being the Full Width at Half Maximum (FWHM) of unresolved sky or arc lamp lines).
At the above wavelengths the H2 1-0S(1) ( 2.1218334 m; Bragg, Smith & Brault 1982), Hi Br ( 2.166167 m) and [FeII] ( 1.643998 m; Johansson 1978) transitions are well centred on the array. The wavelength coverage at each of these wavelengths was approximately 2.115-2.128 m, 2.158-2.173 m and 1.638-1.649 m (these ranges shifted slightly from night-to-night, depending on the setting of the echelle grating angle).
For each target, and for each line, an exposure at a “blank sky” position was followed by five on-source “object” exposures, the former being subtracted from all of the object frames. This sequence of six frames was repeated two or three times in each line to build up signal-to-noise. To avoid saturation on the bright continuum associated with each PPN, relatively short exposures were used; 60 sec (2 coadds) for the two K-band lines, and 80 sec (2 coadds) in the H-band. The total integration time on each source was: 30 mins in H2 – central slit (in all seven targets); 20 mins in H2 – left and right slits (in the five targets with H2 detections); 26.5 mins in [FeII] (40 mins for IRAS 17150-3224 and IRAS 17423-1755), and 30 mins in Br.
With the above exposure times, at the high spectral resolution of the instrument (), there is essentially no detectable thermal emission (or associated shot noise) from the sky or background between the well-resolved OH sky lines. Thus, the process of “sky subtraction” mainly serves to remove the OH lines and any “warm” pixels that remain after bad-pixel masking and flat-fielding (all data frames are bad-pixel-masked, using a mask taken at the start of each night, and flat-fielded, using an observation of an internal blackbody lamp obtained before each set of target observations). At 2.122 m and 2.166 m the H2 1-0S(1) and Br lines are well separated from any bright OH sky lines. Thus, any residual sky lines in the reduced spectral images resulting from imperfect sky subtraction do not affect the data. However, the [FeII] 1.644 m line is close to an OH line, the 1.644216 m 5-3 R2 transition, so residual emission from this OH line was removed using the STARLINK package FIGARO, specifically the polysky routine. This routine fits a polynomial to regions above and below the target spectrum (along columns in the spatial/slit direction): the fit to these sky regions is then used to subtract sky emission, column-by-column, across the spectral image.
Coadded H2 and [FeII] spectral images were wavelength calibrated using OH sky lines, there being four lines well spaced across the array in both cases (Rousselot et al. 2000). The first raw object frame observed at each wavelength on each source was used as the reference frame. The STARLINK:FIGARO software packages used to do this also correct for distortion along the columns in each image (i.e. along arc or sky lines), via a polynomial fit to the OH lines in each row. Examination of the OH lines in distortion-corrected and wavelength-calibrated raw frames showed that the velocity calibration along the length of the slit, measured from Gaussian fits to the sky lines, is extremely good for the H2 and [FeII] data. The relative velocity calibration along the slit and between adjacent slits and targets is estimated to be accurate to km s-1 .
Unfortunately, only one bright OH line was evident in the raw Br spectral images, at 2.1711170 m. A pair of weaker lines appears in some the data at the blue end of the spectrum, and a second pair of weak lines occurs near the centre of the array. However, these lines were generally too faint for accurate calibration, and were in any case unresolved by Rousselot et al. (2000). We therefore used telluric absorption features in the standard star spectrum to wavelength calibrate the central region in each Br spectral image. Note that in this case no correction was made for optical distortions along the slit axis. Fortunately, the Br emission was confined to a region very close to the source continuum in each spectral image, so distortion was not considered to be a major source of uncertainty in the wavelength/velocity calibration. Three or four telluric lines were observed in each standard star spectrum; these were identified in the Arcturus atlas of Hinkle, Wallace & Livingstone (1995) and their wavelengths measured from the solar atlas available from the BAse de donnees Solaire Sol 2000 solar archive hosted by l’Observatoire de Paris (http://bass2000.obspm.fr/solar_spect.php). Br absorption lines, seen in each standard, were also used (after correction for the radial velocity of the standard). The OH lines noted above were subsequently used to check the calibration. The telluric features were relatively weak in most cases, and their wavelengths only measured to an accuracy of Angstrom. The velocity calibration in the Br data is therefore only considered to be accurate to km s-1.
At all three wavelengths velocities were calibrated with respect to the kinematic Local Standard of Rest [LSR]. They were not corrected for the systemic velocity in each region.
Finally, spectra of A or G-type standard stars were obtained and reduced in a similar fashion. In each case an extracted, wavelength-calibrated spectrum was “grown” into a 2-D image so that division by this image would correct each reduced PPN spectral image for telluric absorption (Br absorption lines were removed from the standard star data before they were used to calibrate the 2.166 m images). Although most of the data were obtained in photometric conditions, variable cirrus on 15 June, 24 June and 3 July introduced 0.5-1.5 magnitudes of attenuation. The absolute flux calibration of these observations (i.e. the centre H2 slit in IRAS 17150-3224 and IRAS 17423-1755, the [FeII] and Br observations of IRAS 17423-1755, and the left and right H2 slits in IRAS 17441-2411) will therefore only be accurate to within a factor of 2-3. The seeing was in the range 0.5″–0.8″, i.e. equal to or somewhat less than the slit width and offsets used for the adjacent H2 observations.
3 Results
In this paper we have targeted a very young PN and six PPN; the sources are listed in order of spectral type in Table 1. The spectral energy distribution (SED) of each source is double-peaked, though in most cases dominated by a strong infrared component, as expected for a detached, dusty shell surrounding a stellar photosphere (e.g. Kwok et al. 1996; Ueta et al. 2000). Bipolar lobes are evident in published, high-resolution images of each target (except for IRAS 21282+5050, though see Figure 1). The lobes in each case extend over at least a few arcseconds in projection on the sky. In the optical, the aspect ratio of the bipolar lobes (length/width) is typically 2–5.
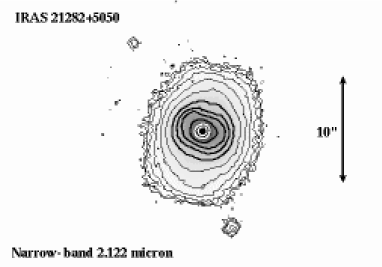
For each source the spectrometer slit was centred on the bright near-IR continuum peak; the slit was aligned along the axis through the bipolar lobes, as defined by high-resolution images (e.g. M 1-92 – Bujarrabal et al. 1998a; IRAS 17423-1755 – Reira et al. 2003; IRAS 17441-2411 – Su et al. 1998; IRAS 17150-3224 – Kwok et al. 1998; IRAS 09371+1212 – Sahai et al. 2000; IRAS 17106-3046 – Kwok, Hrivnak & Su 2000). We refer to this position as the “central slit” (cen) position in each case. We found no high-resolution narrow-band images of IRAS 21282+5050 in the literature (although see the K-band image of Latter et al. 1995). We therefore obtained a narrow-band () 2.122 m image of this target under good seeing conditions (″) with the UKIRT Fast Track Imager (UFTI) (Roche et al. 2003). An adjacent continuum image was not obtained; nor were the data flux-calibrated. In this image (Figure 1), IRAS 21282+5050 was seen to be slightly extended in a north-north-west to south-south-east direction, as seems to be the case in the K-band image of Latter et al. (1995): a position angle (p.a.) of 160° was thus adopted for this target.
Although H2 observations were obtained for seven targets, line emission was detected in only the first five sources in Table 1. The upper limit to the line flux in the lobes of the two non-detections was mJy arcsec-1 ( W m-2 arcsec-2). When H2 was detected in the central slit position, i.e. along the polar axis of a source, H2 data at adjacent, parallel slit positions were also obtained. In each case the slit was offset ″ either side of the central axis. The exact offset – reported in the H2 position-velocity (PV) diagram Figure captions – is measured perpendicular to the slit axis. We refer to these offset positions as “left” and “right”. In this way, H2 spectra were obtained at three adjacent, parallel slits across the width of the first five sources listed in Table 1.
[FeII] 1.644 m and Br observations were also then obtained for these five targets, with the slit centred on the same continuum peak position and using the same position angle. In [FeII] and Br only this one central slit position was observed in each source. Br was detected in all five targets. However, [FeII] was only detected in M 1-92. The upper limit to the [FeII] flux in the lobes of the IRAS 17150-3224, IRAS 17423-1755, IRAS 17441-2411 and IRAS 21282+5050 nebulae was mJy arcsec-1 ( W m-2 arcsec-2).
Below we discuss the sources individually. H2 PV diagrams are shown for each target. For the central slit position a PV diagram showing the line and continuum emission is presented along-side a continuum-subtracted PV diagram. In the latter the continuum has been removed from the spectral image, row-by-row, by fitting the continuum on either side of the line emission region with a second-order polynomial. The PV diagram showing both the line emission and the continuum serves to illustrate the relative strength of the two emission components. For the left and right slit positions, only continuum-subtracted PV plots are presented. In all PV diagrams positive offsets are approximately to the north or north-west, depending on the slit position angle. Slit angles are listed in Table 1 and in the Figure captions.
3.1 IRAS 21282+5050
IRAS 21282+5050 is probably slightly more evolved than the other targets discussed in this paper. It is considered to be a very young PN with a WR central star (reclassified as O9 by Crowther, De Marco & Barlow 1998) surrounded by a dusty core with a central hole (Meixner et al. 1997; 1998). It exhibits weak radio continuum emission at 2 cm and 6 cm (Likkel et al. 1994) and has probably evolved from a carbon-rich, intermediate mass star.
Our narrow-band, 2.12 m image of IRAS 21282+5050 (Figure 1) shows the target to be elongated in two directions. The outer, faint contours extend toward the north-north-west and south-south-east, along an axis orientated at a position angle of about 160°. We assume this to be the orientation of the bipolar lobes and adopt this angle for our spectroscopy. However, the brighter contours in the core of IRAS 21282+5050 are orientated perpendicular to this axis, at a position angle of 75°(10°). The near-IR image in Figure 1 bears a striking resemblance to the 12.5 m image of Meixner et al. (1997). They observe the same elongation toward the north-north-west and south-south-east (p.a. 165°) and also, in their deconvolved image, resolve the inner core into two peaks, aligned along an axis orthogonal to the fainter emission (p.a. 70°). They interpret their images and the source’s spectral energy distribution in terms of dust emission from a disk viewed edge-on, implying that the bipolar lobes must lie close to the plane of the sky.
Hora et al. (1999) included IRAS 21282+5050 in their extensive spectroscopic survey of PN. They obtained spectra at two positions, toward the core and toward a position offset 3″N, 3″W. They detected H2 emission lines from the latter. Davis et al (2003b) later presented an integrated spectrum of this target; they too detected line emission from H2.
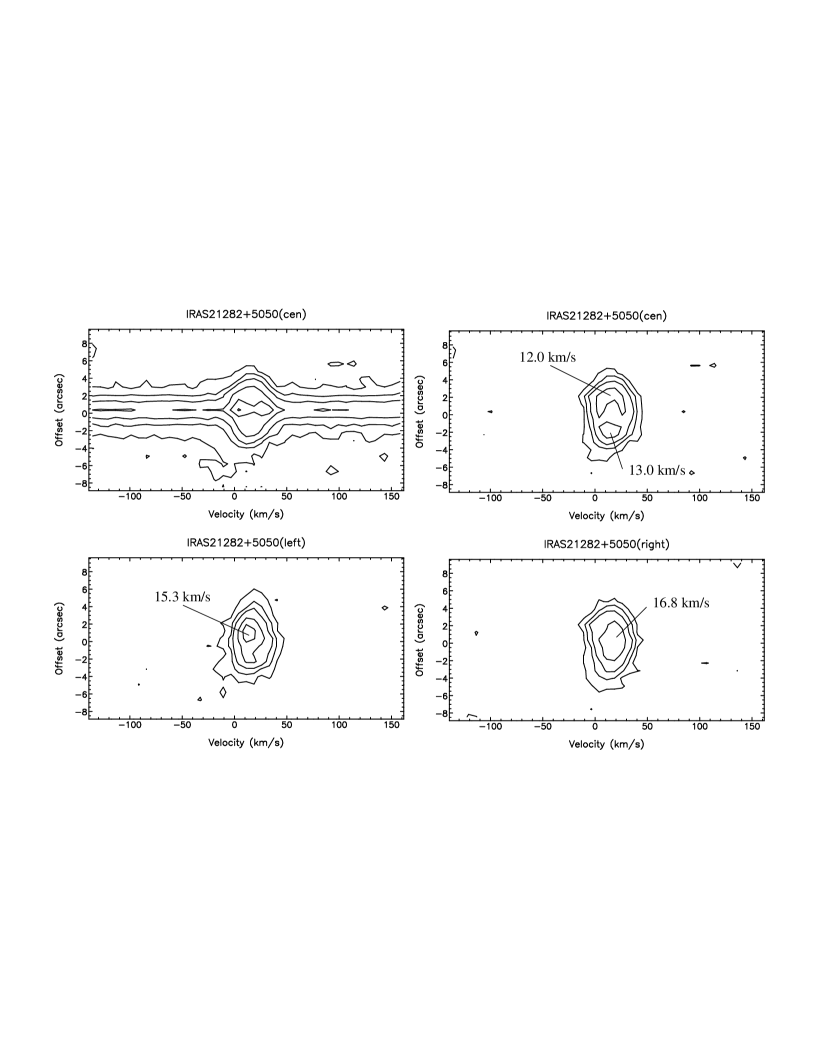
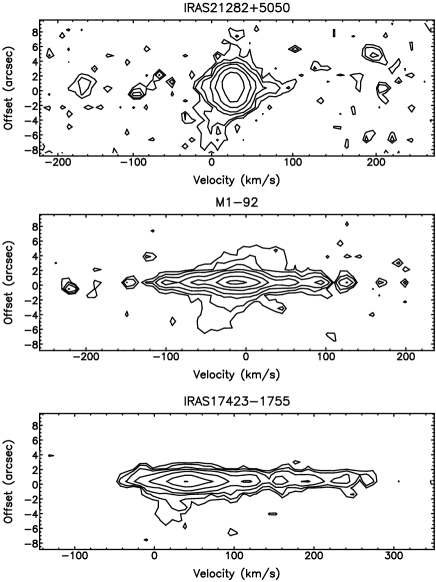
In the central slit data in Figure 2 we see H2 2.122 m emission along the slit axis and toward the source continuum position. As we demonstrate in subsequent sections, this is somewhat unexpected, particularly for a source with bipolar lobes orientated close to the plane of the sky: in the other targets discussed later, the H2 is confined to discrete knots in the bipolar lobes. The H2 near the continuum position in IRAS 21282+5050 is therefore unusual. It may be excited either very close to the central star, perhaps in the extended wings of bow shocks in the bipolar lobes, or in a second outflow component orientated along the line of sight and therefore in the equatorial plane. Equatorial H2 features have been observed in at least one other PPN, namely CRL 2688, where multiple bow-shaped shock structures are spatially resolved in both the bipolar lobes and in the equatorial regions (Sahai et al. 1998).
Our three near-IR slits were orientated perpendicular to the dust ring found by Meixner et al. (1997). Consequently, the spatial variations along each slit probably correspond to offsets along the bipolar lobes, and the emission above and below the continuum in each PV diagram must be associated with the bipolar lobes. In other words, each PV plot could include H2 line emission from an equatorial flow and from the bipolar lobes.
In the continuum-subtracted H2 PV diagram for our central slit, the emission describes a ring in position-velocity space. From a slice taken along the slit axis (i.e. along a single 0.52 A/7.4 km s-1-wide column in the PV diagram), the diameter of this ring is found to be of the order of 4.4″(0.9″). This diameter probably represents the distance between emission features in the bipolar lobes, above and below the source continuum position. (It does not correspond to the diameter of the dust torus observed by Meixner et al. 1997.)
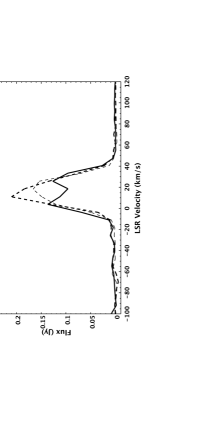
Continuum-subtracted PV diagrams from the “left” and “right” slits are also shown in Figure 2. Spectra extracted from the middle three rows (offset = 0″) in each of the spectral images are shown in Figure 3. The broadest profile is seen in the centre slit data. Here the emission line is double peaked, and can be well fitted with a two-component Gaussian profile with peaks separated by 22 km s-1. The spectra from the left and right slit positions, although slightly skewed to blue and red-shifted velocities, peak at an intermediate velocity of km s-1. These spectra – all obtained toward the central continuum position – may therefore be understood in terms of: (1) emission excited in the wings of extended bow shocks seen side-on (the double-peaked profiles representing emission from the near and far sides of the bow), or (2) an expanding shell or curved shock directed toward the observer. These two scenarios will be investigated in Sect. 4.3.1, where we discuss whether an equatorial wind is needed in addition to an orthogonal, bipolar flow to explain the H2 profiles in Figures 2 and 3.
3.2 M 1-92
M 1-92 (IRAS 19343+2926) is a bipolar, oxygen-rich PPN (spectral type B0.5V). The relatively-high temperature of its central star ( K) suggests that it is probably more evolved than the other PPN targets in Table 1. Bujarrabal, Alcolea & Neri (1998b) estimate a kinematic age of about 900 yrs for M 1-92. The nebula comprises two bipolar lobes of scattered, polarised light (Herbig 1975; Trammell & Goodrich 1996; Bujarrabal et al. 1998a). Spectra from these lobes consist of a stellar continuum, scattered permitted Balmer and HeI lines, and a variety of low-excitation forbidden emission lines, the latter being confined to fast (200-300 km s-1) shocks in the bipolar lobes (Solf 1994). The two lobes are separated by a dark lane, although the central star is just visible because of the inclination of the north-western, blue-shifted lobe toward the observer. In optical HST images the continuum in the lobes appears smooth, while the shock-excited [SII] and [OI] is shown to delineate knotty, collimated jets that are roughly, though not precisely, aligned with the axis of the nebula (Trammell & Goodrich 1996; Bujarrabal et al. 1998a).
Two hollow molecular shells surround the bipolar lobes (Bujarrabal et al. 1997). Observed in CO, these probably represent the ejecta from the AGB phase; gas swept up by the fast, post-AGB wind. They contain most of the nebula material and are expanding at high speed (up to 70 km s-1). Bujarrabal et al. also report the detection of fast molecular clumps at the tips of the bipolar lobes/shells (i.e. along the jet axes), as well as a dense, expanding, equatorial torus, with a diameter of about 2″-3″.
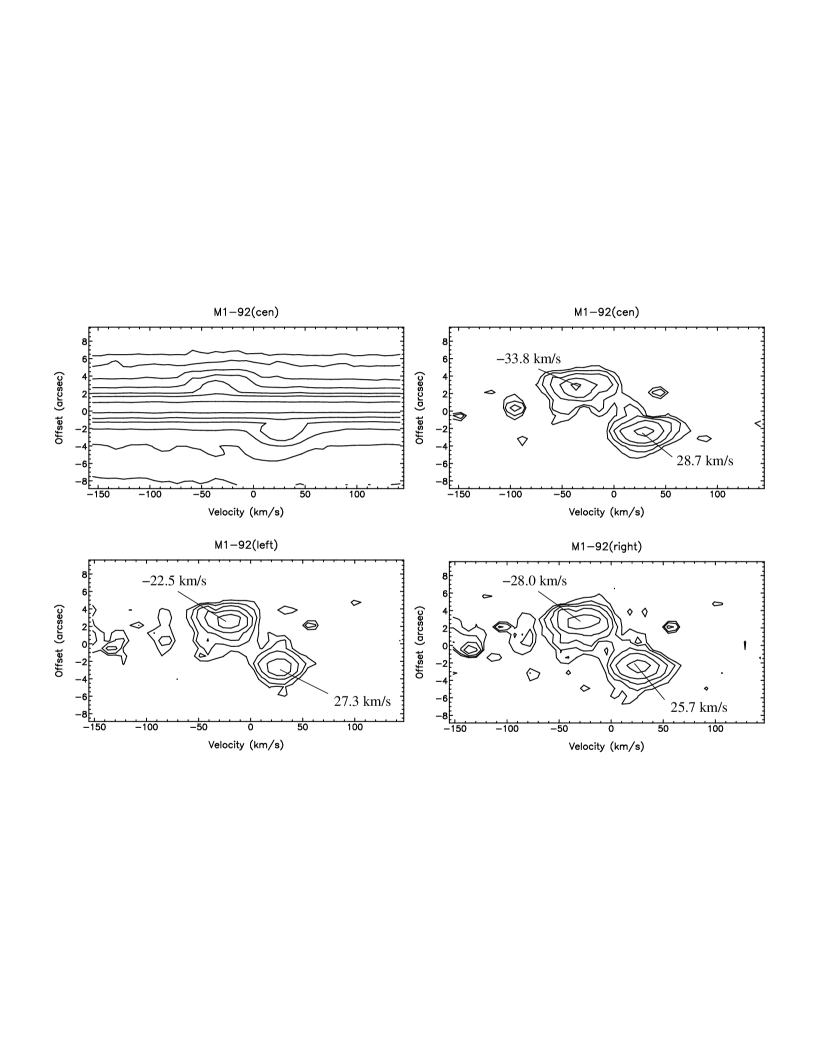
In near-IR images of M 1-92, knots of H2 2.122 m emission are observed along the axes of the two bipolar lobes (Bujarrabal et al. 1998a; Davis et al. 2003b). The emission from these regions is evident in our echelle data; spectroscopy at the three parallel slit positions across the width of M 1-92 are shown in Figure 4. Discrete H2 emission features are seen in all three slits; H2 is not detected toward the continuum position. The emission knot to the north-west is blue-shifted (radial velocity, km s-1) while the emission in the counter-lobe is red-shifted ( km s-1). When corrected for inclination, these values convert to a velocity along the bipolar axis of the system of about km s-1, a speed that is comparable to the velocity of the molecular AGB ejecta (Bujarrabal et al. 1998b).
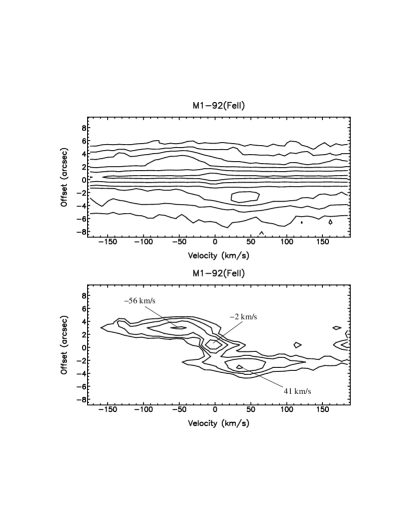
Of the five sources detected in H2 2.122 m emission, M 1-92 was the only target where [FeII] 1.644 m was detected. In these [FeII] data (Figure 5) we see blue-shifted and red-shifted features in the bipolar lobes similar to those seen in H2. Extracted H2 and [FeII] spectra are compared in Figure 6. These data were extracted over the same regions in the two bipolar lobes. The [FeII] spectra peak at slightly more blue-shifted/red-shifted velocities ( km s-1 and km s-1); the [FeII] profiles are also considerably broader. Gaussian fits to the extracted H2 profiles yield FWHM velocities of 35 – 45 km s-1; the [FeII] spectra are roughly twice as wide, and they exhibit strong blue- and red-shifted line wings on the blue- and red-shifted peaks, respectively. At the 10% peak intensity level, the [FeII] lines are 330 – 340 km s-1 wide.
The blue and red [FeII] peaks are also slightly further apart in separation along the slit, as compared to their H2 counterparts. From profiles taken along the slit axis from the continuum-subtracted spectral images, integrated over the same velocity range in each case, the separation between the [FeII] peaks was found to be 5.53″ compared to 5.20″ for the H2 peaks. An error of ″ is assumed, based on the accuracy with which we were able to calibrate the pixel scale (from observations of standard stars); the errors from the gaussian fits to the peaks in the profiles were considerably smaller than this.
Note, finally, that although no H2 emission was detected toward the central continuum position (0″ offset in each of the PV diagrams), a spatially-compact feature is detected in [FeII]. In an extracted spectrum (not shown) this feature peaks at km s-1, i.e. roughly the nominal systemic velocity based on the blue- and red-shifted velocities seen in the lobes in H2 and [FeII]. At only km s-1 wide FWHM, this feature is also considerably narrower than the [FeII] profiles in the lobes, being only moderately broader than the instrumental profile.
3.3 IRAS 17423-1755
Optical images of the bipolar PPN IRAS 17423-1755 (Hen 3-1475) reveal a spectacular S-shaped distribution of point-symmetric knots along the axis of the nebula, which extend over 17″ (Borkowski, Blondin & Hartigan 1997; Riera et al. 2003). Like M 1-92, this chain of knots is enveloped in a diffuse, dumbell-shaped, bipolar nebula. From optical spectroscopy, velocities for the fast wind in the lobes of the nebula of km s-1 have been inferred, and shocks are once again thought to play a major role in the excitation of the optical line-emission features (e.g. Riera et al. 2003). Riera et al. suggest that IRAS 17423-1755 may have evolved from a relatively high mass progenitor. VLA observations do reveal a compact radio-continuum source near the central star (Knapp et al. 1995), so the central object may already be hot enough to produce an ionised region.
H2 observations at three positions across the width of IRAS 17423-1755 are shown in Figure 7. The outer slits coincide with the edges of the diffuse lobes of scattered light, while the central slit covers many (though not all) of the optical knots along the central axis. Even so, H2 line emission was only detected in the north-western outflow lobe (positive offsets in Figure 7), probably toward the bright optical knot NW1a (Riera et al. 2003). Our continuum-subtracted spectral images do not reveal emission coincident with the central star, although the shot noise associated with the bright continuum is much stronger than in the bipolar lobes.
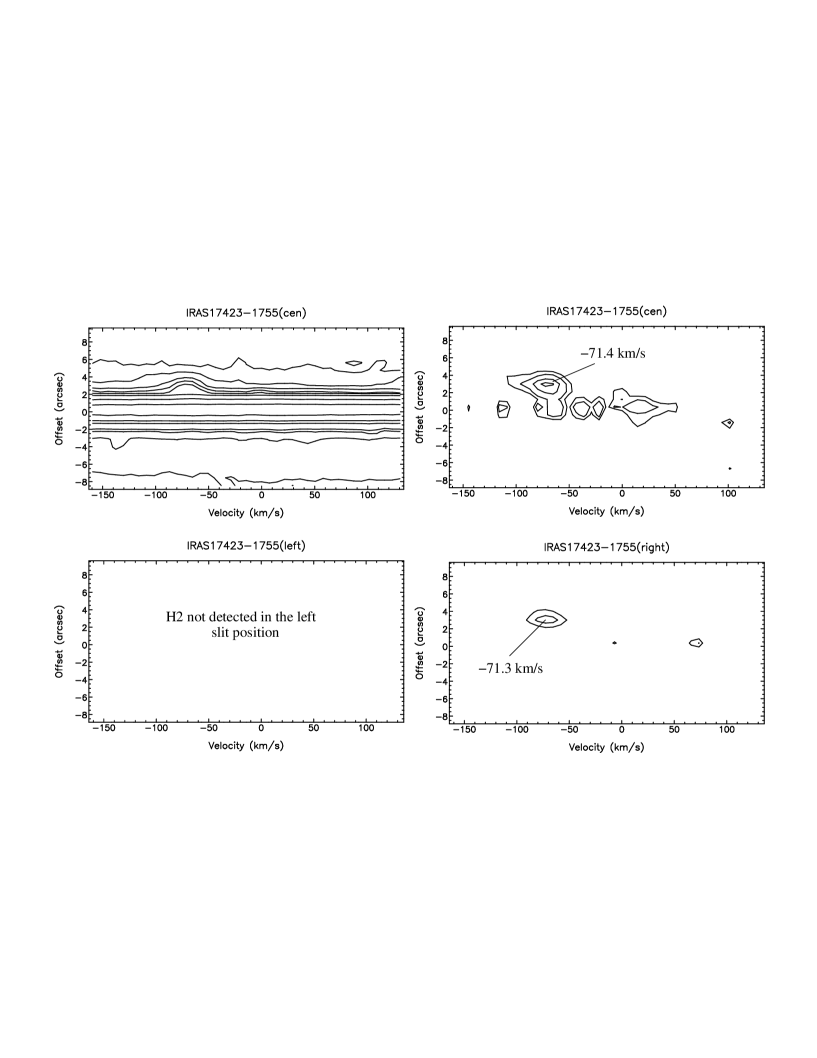
The H2 emission in the north-western lobe peaks at an offset of 3″; it is also strongest in our “right” slit position, which corresponds to the south-western edge of this lobe. The emission feature peaks at a highly blue-shifted velocity ( km s-1). This is not too surprising when one considers that IRAS 17423-1755 is probably the most obliquely-orientated source in our target list (Table 1). The line profile is narrow (FWHM km s-1) though there is also possibly a weak wing extended to higher blue-shifted velocities.
3.4 IRAS 17441-2411
With respect to angular size, aspect ratio and overall structure, IRAS 17441-2411 (AFGL 5385) is very similar to IRAS 17150-3224 (discussed below). Both targets are also associated with late-type central sources. In HST images IRAS 17441-2411 comprises two bulbous lobes superimposed onto a series of concentric arcs, which may be associated with spherically-symmetric AGB mass loss (Su et el. 1998; 2003). The lobes themselves are not uniformly illuminated, instead exhibiting an “S” shaped geometry (Ueta et al. 2000). IRAS 17441-2411 is probably orientated close to the plane of the sky, since the object has a well-defined dark lane across its waist which obscures the central star. The star is itself extremely red; V-K11.5 (Su et al. 2003).
Weintraub et al. (1998) report the detection of weak H2 emission toward the core region in IRAS 17441-2411 (Davis et al. 2003b failed to detect H2 in this source, probably because of the increased shot noise in their lower-spectral-resolution observations). Weintraub et al. postulate that the H2 emission may be associated with an expanding equatorial torus. However, their slit was orientated east-west, rather than along the almost north-south bipolar lobes.
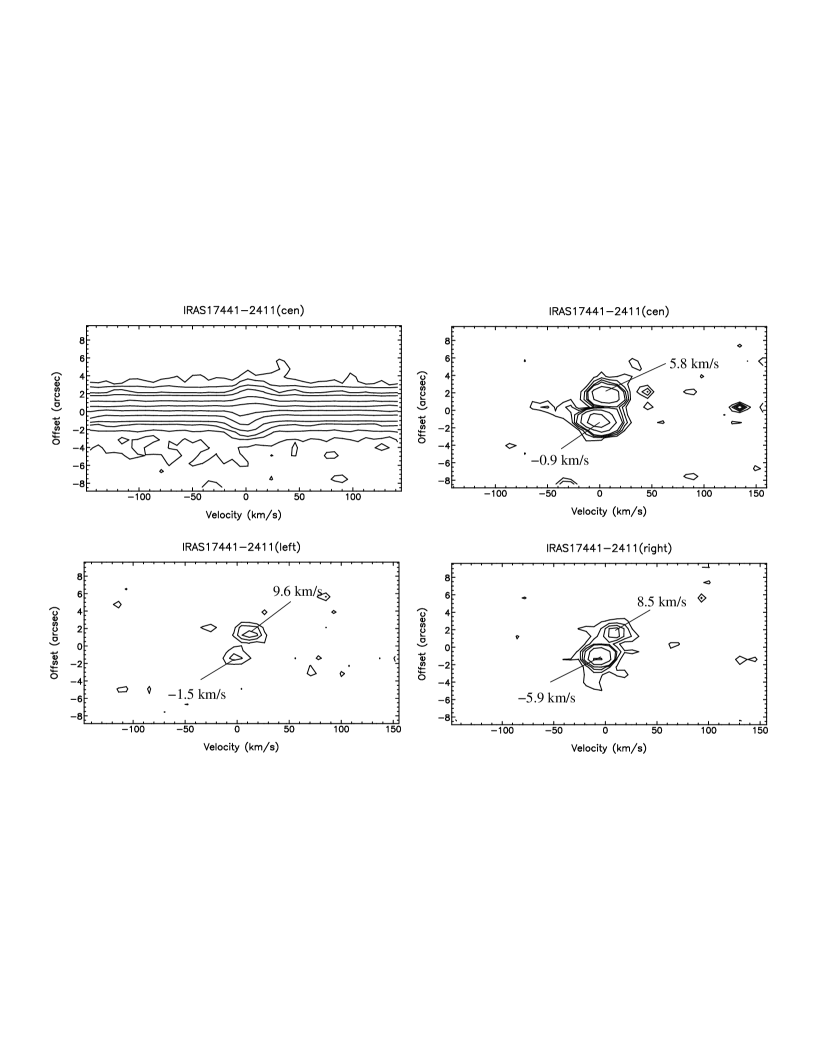
In Figure 8 we again show continuum-subtracted H2 spectral images at three slit positions across the width of the nebula. As with the other PPN, the H2 emission is confined to discrete knots in the bipolar lobes; in IRAS 17441-2411 these are offset approximately 1″-2″ from the central continuum peak in our PV diagrams. In optical images the lobes appear to be somewhat limb-brightened. In H2 we detect the strongest line emission along the central axis, although notably the northern, red-shifted knot (positive offsets in Figure 8) is brighter in the “left” slit than the emission feature in the counter-lobe, with the inverse seen in the “right”slit. Note also that the velocity difference between the blue and red lobes is marginally larger in the left and right slits than it is along the central slit. Curiously, this implies higher radial velocities along the edges of the bipolar lobes than along the central axis. Higher spatial- and spectral-resolution observations would be useful to confirm this finding.
Overall, the low radial velocities in H2 support the idea that the system is orientated close to the plane of the sky. Emission lines in H2 spectra extracted from the two bipolar lobes are again very narrow; Gaussian fits yield FWHM values of km s-1.
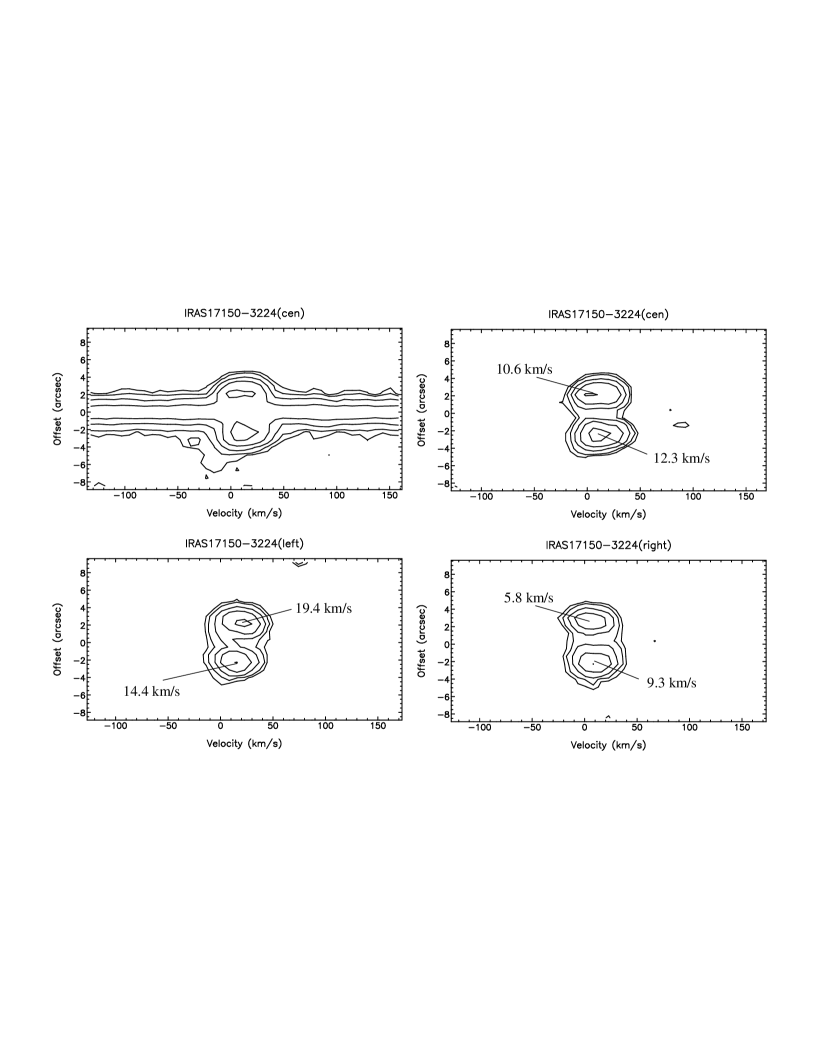
3.5 IRAS 17150-3224
IRAS 17150-3224 (AFGL 6815) also appears to be orientated close to the plane of the sky, with its equatorial torus viewed nearly edge-on (Kwok, Su & Hrivnak 1998). The central G-type star is largely obscured at optical wavelengths and is highly reddened (V-K11.0; Su et al. 2003). Like IRAS 17441-2411, in optical and near-IR HST images a series of concentric arcs are superimposed onto the bipolar lobes; these may again be associated with spherically-symmetric mass loss from the AGB phase (Kwok et al. 1998; Su et al. 2003). Overall, the angular extent of the PPN, measured in the optical across both bipolar lobes, is about 8″-10″, although fainter rings of emission extend radially further outward.
H2 emission was detected by Weintraub et al. (1998) and Davis et al. (2003b) in both bipolar lobes. Our PV diagrams in Figure 9 reveal the kinematics of these emission features. The plots show that the emission extends across the width of the nebula, and that once again it is confined to knots in the two bipolar lobes. The knots are offset by 2″ from the central continuum. The emission is therefore excited roughly half-way along the optical bipolar lobes, rather than at the ends of the lobes.
Much lower radial velocities are recorded in IRAS 17150-3224 ( 10 – 12 km s-1, FWHM km s-1) than were seen in some of the other targets, as one would expect for a system orientated close to the plane of the sky. (The same peak velocity was measured by Weintraub et al. (1998) in their H2 2.122 m spectrum obtained with an east-west slit.)
| Target | H2 (blue) | H2 (blue) | H2 (red) | H2 (red) | Br | Br |
|---|---|---|---|---|---|---|
| FWHM | FWHM | FWHM | ||||
| (km s-1) | (km s-1) | (km s-1) | (km s-1) | (km s-1) | (km s-1) | |
| IRAS 21282+5050 | 14.5 | 27.6 | 14.7 | 29.7 | 26.8 | 25.8 |
| M 1-92 | -33.8 | 43.3 | 28.7 | 37.2 | -11.4 | 87.4 |
| IRAS 17423-1755 | -69.7 | 17.7 | – | – | 43.5 | 83.7 |
| IRAS 17441-2411 | -1.0 | 25.9 | 5.9 | 26.4 | 4.9∗ | 65.3∗ |
| IRAS 17150-3224 | 10.9 | 36.3 | 12.3 | 34.6 | 20.4∗ | 93.1∗ |
-
∗
HI lines seen in absorption
3.6 H2 non-detections in IRAS 09371+1212 and IRAS 17106-3046
Two other PPN were also observed at 2.12 m, IRAS 09371+1212 (Frosty Leo) and IRAS 17106-3046 (see Table 1). Both targets appear to be bipolar PPN, much like those described above, and both are associated with collimated, knotty outflows (e.g. Langill, Kwok & Hrivnak 1994; Sahai et al. 2000; Kwok, Hrivnak & Su 2000). Even so, H2 2.122 m line emission was not detected along their central bipolar axes.
The angular extent of IRAS 09371+1212 on the sky is considerably larger than the other targets in our sample, so it is certainly possible that our chosen slit position angle missed line-emission features along the walls of the nebula. Our slit was aligned through bright, optical ansae at the ends of the bipolar lobes (labeled AN and AS by Sahai et al. (2000)), features which tend to be H2 line emitters in other PPN. Also, the outflow itself may have changed direction in recent years, as evidenced by the multiple, miss-aligned optical features observed in the lobes of this nebula (Sahai et al. 2000).
IRAS 17106-3046 has a much smaller angular extent on the sky, though it is still comparable in size to IRAS 17423-1755 and IRAS 21282+5050, PPN where H2 was detected and spatially resolved.
Inclination angle does not seem to be a factor in whether H2 is detected or not. In the other targets discussed above, H2 is detected in sources with a range of inclination angles (see Table 1).
Both targets certainly show evidence for collimated flows, and the knots and ansae in IRAS 09371+1212 in particular indicate the presence of shocks. Shock velocities should be high enough to excite H2 into emission; the 1-0S(1) line targeted here can be excited in shocks with velocities of km s-1 (e.g. Smith 1991). The lack of detectable emission must therefore be related to a lack of dense, molecular gas in the polar lobes.
Our H2 non-detections in IRAS 09371+1212 and IRAS 17106-3046 may be related to their progenitor mass and/or evolutionary state. Weintraub et al (1998), García-Hernández et al. (2002) and Davis et al. (2003b) all find that H2 is not detected in targets with spectral types later than about G2. Our non-detection in IRAS 09371+1212, which has a K7II central object (Mauron, Le Borgne & Picquette 1989), would support this hypothesis. The spectral type of IRAS 17106-3046 is not known.
3.7 Br observations
Br observations were acquired for the central slit position, using the same slit position angle, in each of the five targets where H2 was detected. In two of the five sources – the two late, G-type sources in our sample – Br is seen in absorption. This is typically the case in F or G-type PPN (e.g. Hrivnak, Kwok & Geballe 1994). In the “more evolved” B-type PPN and the “young PN” IRAS 21282+5050, Br is strong and seen in emission, indicating the onset of ionisation. M1-92, IRAS 17423-1755 and IRAS 21282+5050 are probably on the brink of the transition from PPN to PN (Kwok 1993). In these three targets the emission is largely confined to the source continuum position (Figure 10), although weak, blue-shifted emission, presumably associated with the inner regions of the post-AGB wind, is also seen in each case.
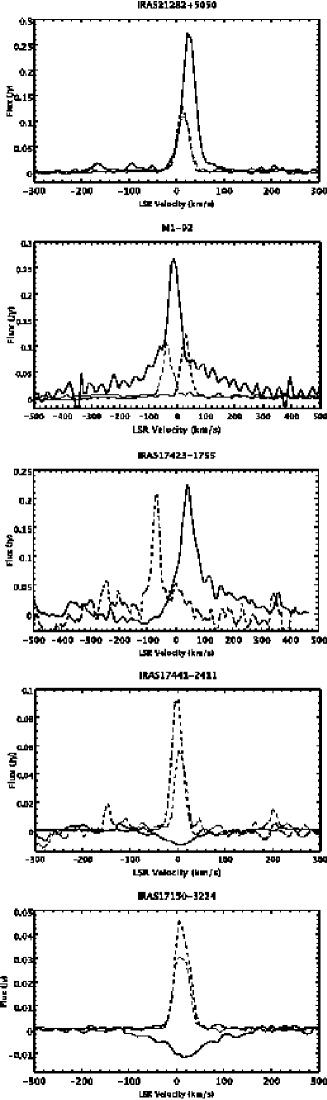
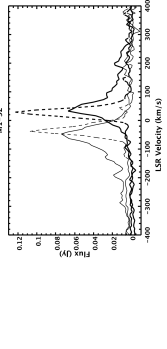
In Figure 11 we compare Br profiles to H2 2.122 m profiles, the latter being extracted from the bipolar lobes of each PPN. The central slit images were used for the H2 spectra. The results of Gaussian (H2) or Lorentzian (Br) fits to these lines are listed in Table 2. The Br profiles generally peak at low radial velocities, velocities that are comparable (to within 10 km s-1) to systemic velocities derived from CO observations of the molecular gas associated with each system (Bujarrabal et al. 20001 and references therein). Considering the targets individually;
-
•
The two H2 profiles from the young O-type PN IRAS 21282+5050 peak at essentially the same low velocity, as one would expect for a system orientated close to the plane of the sky. The Br profile peaks at a similarly low velocity, and is notably much narrower than the Br profiles observed toward the other sources (Table 2).
-
•
In the B-type PPN M1-92, the Br emission peaks midway between the two H2 emission lines. Here, the HI recombination line is probably centred at the systemic velocity, while the H2 lines reflect the blue- and red-shifted gas velocities in the bipolar lobes.
-
•
In the B-type PPN IRAS 17423-1755 there is a considerable shift between the H2 and Br peak velocities. Again, the Br line peaks at the systemic velocity (as reported by Riera et al. 2003), while the H2 traces the high-velocity blue-shifted outflow lobe. The red-shifted lobe may be obscured by a circumstellar torus inclined toward the plane of the sky. The large velocity shift ( km s-1) between the H2 and Br profiles would likewise be caused by the large inclination angle of the system.
-
•
In the G-type PPN IRAS 17441-2411 and IRAS 17150-3224 the Br absorption features again probably mark the systemic LSR velocity in each system. The H2 profiles in the bipolar lobes in both targets peak at roughly the same radial velocity, as one would expect for nebulae orientated close to the plane of the sky.
In four of the five sources (the PPN) the extracted Br profiles are considerably broader than the H2 profiles, by a factor of (Table 2). The Br emission must trace ionised regions within the fast post-AGB wind, while the H2 instead reflects the shock velocity at the interface between the ionised wind and the slow-moving AGB envelope. Note in particular the broad blue and red-shifted wings superimposed onto the otherwise Lorentzian profile in M 1-92. These wings reach velocities of km s-1 (at the 10% peak intensity level). For an inclination angle of this indicates a post-AGB ionised wind speed of at least 350 km s-1.
In contrast with the other sources, the Br profile toward the young PN IRAS 21282+5050 is very narrow, being comparable in width to the H2 profiles. We also see no evidence for associated line wings. Together, the H2 and Br data support Meixner et al (1997)’s claim that the bipolar lobes are orientated close to the plane. Our data also suggest that the HI recombination line emission must be excited in a poloidal rather than equatorial wind, and that this wind must be highly collimated, perhaps by the torus reported by Meixner et al., since any lateral expansion would serve to broaden the line profile.
4 Further Discussion
4.1 Br and H2 as tracers of the fast wind
Br and H2 clearly trace different components in the outflows from the sources considered in this paper. Br emission is produced close to the central continuum source, the line profiles are generally broad though they peak close to the systemic velocity, and the Br flux in each system rapidly decreases with distance along the bipolar axes. H2, on the other hand, is predominantly excited in the bipolar lobes in each PPN and appears to be confined to shocks within each flow (we detect molecular line emission toward the continuum-peak in only one system, IRAS 21282+5050). H2 profiles are narrow, though their peak velocities are blue- and red-shifted in bipolar nebulae that are inclined out of the plane of the sky (note in particular IRAS 17423-1755). We will discuss the origin of the H2 emission in subsequent sections. However, we first consider possible excitation mechanisms for the observed Br emission.
Detectable Br recombination-line emission requires high gas densities or an intense ionising flux. The former is produced in post-shock gas; the latter exists close to intermediate or high-mass stars. High-resolution imaging and kinematic studies of PPN show them to be associated with outflows and shock phenomena. PPN, as precursors to PN, are also potentially associated with compact, photo-ionised regions. Either environment may therefore be a source of the observed Br emission.
Atomic hydrogen is collisionally-ionised in shocks, provided the post-shock gas temperature exceeds K, i.e. for shock velocities greater than about 50 km s-1. Radiative recombination then leads to bright Lyman and Balmer emission. The higher-energy Bracket lines will be much weaker, of the order of 0.01–0.03 times the H intensity for shock velocities up to 150 km s-1 and gas densities in the range cm-3 (Hollenbach & McKee 1989). Indeed, for a shock velocity of 100-150 km s-1 and a pre-shock gas density of cm-3, Hollenbach & McKee predict a Br line intensity of the order of erg cm-2 s-1 sr-1. For a shock covering an area of 1″ ( sr) on the sky, and for a line width of km s-1 (Table 2), this is equivalent to a Br line flux density of about 0.01 Jy. This is an order of magnitude lower than the observed flux levels in the two early-type PPN and the young PN, IRAS 21282+5050 (Figure 11). Much higher gas densities, of the order of 105–106 cm-3, would be needed to produce the observed line strengths.
In an ionised region at the base of a fast wind,
Br will again be relatively weak in comparison to Lyman and
Balmer lines, 0.03 times the H intensity for an
electron temperature and density of K and cm-3 (under Case B [optically thick to Ly]
recombination theory; Hummer & Storey 1987). The total integrated
intensity in Br from an optically thin PPN nebula of radius at
a distance will be (Kwok 2000):
For kpc, pc (2″), cm-3 and a filling factor, , of unity, the total Br flux will be erg cm-2 s-1. For a line width of km s-1(Table 2), the flux density will be Jy, comparable to the values in our extracted spectra (Figure 11).
Thus, from the observed line intensities, a photo-ionised nebula close to the central object seems to be the most likely origin for the Br emission. The spatial distribution of Br along the slit also tends to support recombination at the base of the outflow, rather than in shocks between the fast wind and the AGB envelope, since these shocks, traced in H2 in each system, are at a resolvable distance from the central source and yet the Br emission is largely confined to regions near the central source. The low peak velocities though broad line widths in the Br spectra also support recombination in a fast, possible poorly collimated or even spherical wind close to the source.
Finally, we mention that the observations of Guerrero et al. (2000) and Davis et al (2003b) and the models of Natta & Hollenbach (1998) indicate that the H2 2.122 m/Br ratio is highest in PN with large, well-defined rings and bright central stars, i.e. in evolved and/or intermediate-to-high mass sources. The ratio seems to be lower in “less-evolved” PN. When we consider PPN, particularly those with late-type central stars like IRAS 17441-2411 and IRAS 17150-3224, where thermal and probably shock-excitation dominates the production of H2 line emission, the H2 2.122 m/Br ratio is again high.
4.2 The “three wind” model
Three phases of mass loss have been invoked to explain the multiple shells observed in some PN (e.g. Frank 1994). In this scenario the phase of slow, spherical AGB mass loss (Ṁ– M⊙ yr-1; km s-1) is followed by a slow though more massive “superwind” (Ṁ– M⊙ yr-1; km s-1). A diffuse, fast wind (Ṁ M⊙ yr-1; km s-1) follows a few thousand years after the superwind has been terminated. The model is probably a simplification of a continually changing post-AGB mass-loss rate, and in Frank (1994)’s treatment only the “preionisation stage” is relevant to PPN. Nevertheless, we investigate briefly whether our near-IR spectra can be used to distinguish between the traditional “Two-Wind” model of Kwok (1993) and a more complex scenario. Is an additional superwind required to explain the H2 observations?

The density discontinuity between a slow superwind and an equally-slow AGB envelope drives a boundary shock (Frank 1994) which could produce strong H2 line emission. However, it would not generate the high radial velocities seen in our H2 spectra (velocities approaching 50-100 km s-1 in some case; Table 2) since neither the superwind nor the AGB wind expand at high speed. So the observed H2 emission must not derive from a Superwind/AGB wind boundary. Instead, a fast wind impacting the back of either a superwind or an AGB wind is needed to produce the observed high velocities.
The boundary layer between a diffuse, fast wind and a dense, neutral
superwind or AGB wind would comprise a weak, outer/forward shock and a
strong, inner/reverse shock. The latter, with km s-1, decelerates and heats the fast wind material to very high
temperatures (K). The velocity of the forward shock would be
much lower, comparable to though somewhat higher than the velocity of the
AGB wind, depending on the ratio of the fast wind density and the AGB or
superwind density. For example, a fast wind velocity () of
1000 km s-1 and a density ratio between the fast wind and AGB wind
(/) of 100 would result in an outer shock
velocity, given by
of km s-1. By comparison, a density ratio of 10,000 between the same fast wind and a much denser superwind would yield a much lower shock velocity, of the order of 10 km s-1. In both cases, because the shocked H2 would more-or-less move with the shock front, the peak H2 velocity in observed spectra (and the proper motions of H2 emission knots), when corrected for the flow inclination angle, should be comparable to these shock velocities. Since moderately high H2 velocities have been observed, our observations tend to support a lower density ratio and so, at least for the H2 emission regions considered here, a third, dense superwind component may not be required.
4.3 H2 excitation in bow shocks
The morphologies and excitation of molecular hydrogen features in PPN, when combined with the kinematic data presented here and elsewhere (e.g. Weinbtraub et al. 1998), strongly support excitation in curved or conical shocks. Models of similar “bow” shocks have been invoked to explain line profiles and excitation maps in HH jets and molecular outflows from young stars, most recently the molecular bow shocks observed in embedded systems (e.g. Smith 1991, 1994; Davis et al. 1999; Smith, Khanzadyan & Davis 2003; O’Connell et al. 2004). In these papers the effects of varying orientation angle, bow shock speed, bow shape, pre-shock density, and the Alfvén speed and magnetic field orientation are investigated and discussed in detail. Here we present only the models which best fit the kinematic data obtained for two systems: IRAS 21282+5050, where complex and double-peaked profiles are observed, and M 1-92, where H2 and [FeII] emission is detected. In both cases we find that a J-type bow shock fits the data reasonably well; in other words, C-shocks and therefore strongly magnetised winds are not required.
Wherever possible we use parameters derived from other observations to constrain the models.
4.3.1 IRAS 21282+5050
The bipolar lobes of the IRAS 21282+5050 nebula appear to be orientated close to the plane of the sky. In H2 we observe emission along the flow axis, but also toward the central continuum peak, where double-peaked profiles with a peak-to-peak separation of 22 km s-1 are observed (Figure 3). In Section 3.1. we discuss whether the emission toward the continuum could be excited in an equatorial wind. We have attempted to model such an equatorial outflow with bow shocks propagating along the line of sight. This might be considered consistent with the details displayed in Figure 3 and discussed in Section 3.1; specifically, the double-peaked 1–0 S(1) profile plus single peaked profiles from the left and right-hand spectra. However, after detailed modeling we were unable to reproduce the peak shifts. This is because bow shocks tend to deflect material away from the shock surface rather than plough it up. Even with a slow non-dissociative bow shock, most of the emission arises from the wings where the emission peak is shifted by only a few km s-1.

Instead, we more easily model the IRAS 21282+5050 H2 emission if it arises from bow shocks moving in the plane of the sky, as displayed in the left panel in Figure 12. In this case, the deflection from the bow flanks is found to be sufficient to generate a twin-peaked H2 profile from the central slit, with a peak-to-peak separation consistent with the observations in Figure 3; a single-peaked profile is also produced in the bow wings, corresponding to the left or right slit in Figure 3. The overall line widths are also roughly consistent with the observations, and the model profiles peak at the systemic velocity, as is more-or-less observed to be the case. The profiles have been convolved with a Gaussian profile to represent turbulent motions which will, in any case, be generated wherever there are curved shock fronts.
In Figure 12 we also reproduce synthetic H2 (and [FeII]) images, for comparison with future high-resolution imaging, and an integrated PV diagram, for comparison with the plots in Figure 2. (Note that the model only yields emission from one bow shock and therefore only one outflow lobe; in the observed PV diagrams the emission is presumably excited in both lobes.)
The model employed solves the 1-D MHD equations at each point on the bow surface. The cooling behind the shock and the motion away from the bow surface is taken into account with the assumption that the cooling length is short (but not negligible) in comparison to the bow size. The orientation derived from this model is consistent with the direction of the bipolar outflow on larger scales (Table 1). However, we cannot exclude other models given the present limited dataset and modest resolution.
4.3.2 M1-92
M 1-92 was the only PPN where we detected H2 and [FeII] emission: we therefore attempted to model both emission lines, using bow shocks orientated at various angles to the line of sight. We also varied the density, bow shape, field strength, molecular fraction and bow speed. We obtained good agreement with the data for a high-velocity bow shock propagating at 3510∘ to the sky plane, for a density exceeding 103 cm-3 and a bow shape , where the bow shape is defined by in cylindrical coordinates (e.g. Smith et al. 2003). The density, velocity and inclination angle used are consistent with those derived through modeling of atomic lines in the optical (Bujarrabal et al. 1998a).
The model results are shown in Figure 13, where we again display synthetic H2 and [FeII] images of the bow structure. As is typically observed in HH bow shocks, the [FeII] emission is confined to the apex of the bow, with the H2 brightest in the non-dissociating bow flanks. Because the M 1-92 bow model is advancing at a much higher speed than the IRAS 21282+5050 bow, the [FeII] emission is more extended and the H2 is pushed further back into the bow flanks (compare Figure 13 with Figure 12). In high-resolution H2 images of M 1-92, the H2 emission does seem to be confined to off-axis peaks that could be the wings of a bow shock (Bujarrabal et al. 1998a; Davis et al. 2003b). From profiles extracted along the slit axis (Section 3.2), we also find that the [FeII] peaks in the two lobes of the bipolar nebula are slightly further apart than their H2 counterparts, as would be expect from two oppositely-directed bow shocks.
The predicted PV diagram for the [Fe II] data is shown in the second panel of Figure 13. The plot displays a boot-shaped structure comprising an extended red wing and faint, low-velocity emission trailing back toward the source. The overall shape of the model PV diagram agrees quite well with the observed profile in Figure 5 for the southern emission lobe, although the model does predict double-peaked profiles which are not observed.
Extracted H2 (dotted line) and [FeII] (full line) spectra are shown in the third panel in Figure 13. The model reproduces the general structure of both the H2 and [Fe II] lines; i.e. the narrow, Gaussian H2 profile from the bow wings together with the broader, asymmetric [FeII] profile from the bow apex (compare the dotted H2 and full-line [FeII] model spectra in Figure 13 with the observed spectra in Figure 6).
The extreme [Fe II] line wings, which extend out to km s-1, are not reproduced by the model. Moreover, the predicted H2 and [FeII] lines peak at or very near to the velocity of the ambient medium, which was taken to be stationary. The observed profiles are red-shifted (and blue-shifted) by km s-1 (Figure 6). The observations imply that the pre-shock medium is expanding with a radial speed of 70 km s-1. Such a fast-moving pre-shock medium ahead of each bow would be sufficient to shift the model line profiles and PV diagram by about 35 km s-1.
As with IRAS 21282+5050, the bow models do an adequate job of explaining the observations, although additional high-spatial-resolution near-IR imaging and spectroscsopy would again be useful to more tightly constrain the theory.
4.4 Rotation in a magneto-centrifugal disk wind
Finally, since we have observed H2 spectra at three positions across the width of each PPN, we are potentially in a position to search for signs of rotation. Hints of jet rotation have recently been identified on large scales in an outflow from a young star by Davis et al. (2000), and investigated in more detail in HH jets by Bacciotti et al. (2002) and Coffey et al. (2004). In magneto-centrifugal disk winds, the outflow is expected to maintain a record of disk rotation, particularly close to the central star, so their findings are not unexpected.
IRAS 17150-3224 is the only source that shows possible signs of rotation. This source is orientated close to the plane of the sky, is one of the brightest H2 emitters in our sample, and has emission features well resolved from the central continuum. In Figure 9 we see a trend of increasing velocity from right to left across the width of the outflow. In other words, the south-western edges of both lobes appear to be moving toward the observer, with the north-eastern edges moving away from the observer, with a toroidal velocity of 3-7 km s-1, depending on which lobe is considered. The trend is consistent across all three slits, and is in the same sense in both lobes. If we adopt the slit offset (0.8″, or m at a distance of 2.4 kpc) as the radial distance, then an angular velocity of rad s-1 and an orbital period of 20,000 years is implied.
Disk wind models are reviewed by Königl & Pudritz (2002) and discussed in the context of jet rotation by Bacciotti et al. (2000) and in terms of PPN by Frank & Blackman (2004). Briefly, in a disk wind material is ejected from the surface of the disk at a “footprint” radius, , and carried poloidally outward along field lines, provided the base of the field lines are inclined at less that 60° to the disk plane. The point along the flow where the poloidal flow velocity reaches the poloidal Alfvén speed is known as the Alfvén surface; the flow radius at this point is called the Alfvén radius. The outflowing gas is accelerated only between the disk surface and the Alfvén surface, where gas motions can be approximated to solid body rotation. In this region the toroidal velocity is proportional to the radius; . Beyond the Alfvén surface angular momentum is conserved as the gas moves along the field lines; in this region . Consequently, at some point further downwind along the flow axis, the observed linear rotational velocity and radius, and , can be related to the rotational velocity and radius at the Alfvén surface, and , and the Keplerian velocity and radius at the flow footprint, and , by:
| (1) |
We assume that the flow does not interact with (and be appreciably decelerated by) the ambient medium: hence, measurements as close as possible to the disk are desirable. For a “cold” flow the maximum poloidal velocity along the magnetic field lines will be equivalent to the outflow velocity. This is given by:
| (2) |
With measurements of and , together with an estimate of the outflow velocity , from equations 1 and 2 one can estimate the Alfvén radius, , i.e.:
| (3) |
Disk wind models typically predict a value of 2-5 for the ratio . If we assume a value of 3, then an estimate of yields an estimate for the footprint radius, .
Finally, from Kepler’s law (), we may estimate the mass of the central star:
| (4) |
In this way the footprint radius for the disk wind and the mass of the central object may be derived using observable quatities, , and , provided the theory is correct. For IRAS 17150-3224 our slit spectra imply a toroidal velocity km s-1 at a radius m. The poloidal velocity of the molecular flow traced in H2 is difficult to measure because the bipolar nebula lies close to the plane of the sky. We assume a canonical speed of 100 km s-1 which, judging from our observations of other PPN, does not seem unreasonable. These values lead to an Alfvén radius of AU and a source mass of 30 M⊙.
Both seem to be somewhat on the high side (e.g. Frank & Blackmann 2004; Kwok 1993). Because we are observing the molecular component of the flow, a lower flow velocity might be considered more approriate. This would serve to reduce , though (and ) would then increase. Large Alfvén and footprint radii might be expected for the molecular component of a disk wind, since molecular hydrogen would probably not survive acceleration close to the central object. Alternatively, could be overestimated, particularly given the modest spatial resolution of our observations, and the fact that the bow shock will be broader than the underlying outflow. and are both directly proportional to the observed flow radius; reducing would lower both quantities.
The interaction of the fast wind with the AGB envelope could of course produce asymmetries across the width of the flow. In particular, entrainment along one side of the flow could decelerate gas along the flow edge producing skewed velocities that mimic rotation. Such an effect would not be expected in both lobes of the flow, however, and probably would not explain the gradual increase in velocity seen across the three slit positions.
We conclude that, give the limited spatial resolution afforded by our data, IRAS 17150-3224 is certainly a candidate for nebula rotation, one that deserves further study in a number of emission lines with a high-resolution adaptive-optics spectrometer.
5 Conclusions
From our high spectral-resolution near-IR spectroscopy we arrive at the following conclusions:
-
1.
In bipolar PPN, H2 emission is excited in – and largely confined to – molecular shocks in the bipolar lobes. The emission is probably excited in shocks between the slow-moving AGB ejecta and the much faster, post-AGB wind, specifically in the dense, swept-up layer behind the forward shock at the fast wind/AGB wind interface (Frank 1994). H2 velocities are certainly more comparable to the velocity of the detached AGB envelope than the fast wind.
-
2.
Unlike García-Hernández et al (2002), we find (albeit in a very limited sample biased toward bipolar PPN) bright H2 emission in PPN associated with early and reasonably late-type central stars. Our sample includes one O, two B and two G-type objects. However, we did fail to detect H2 along the axis of a bipolar PPN associated with an M-type star.
-
3.
H2 emission is associated with PPN, regardless of whether they exhibit Br in emission or absorption. This is, at least in part, due to the fact that the H2 and HI regions are physically separate.
-
4.
Our H2 observations of IRAS 21282+5050, and both H2 and [FeII] observations of M 1-92, are convincingly modeled with molecular bow shocks viewed roughly side-on. Line widths, peak velocities, and double-peaked profiles are reproduced. The models also predict a spatial offset between the H2 and [FeII] emission regions, the former being excited in the oblique bow flanks, the latter at the bow apex. There is evidence for such an offset in M 1-92, although additional observations at higher spatial resolution in these and other PPN are warranted.
-
5.
We find possible evidence for outflow rotation in one target, IRAS 17150-3224. Rotation is expected if the flow is driven magneto-centrifugally from the surface of a disk. Spectroscopy at high spatial and spectral resolution would be extremely useful, with a system that operates in the near-IR (such as NACO at the VLT) to confirm our results and to search for similar trends in other targets, since rotation would validate disk wind models, which have recently been invoked to explain other aspects of outflows from evolved stars.
6 Acknowledgments
We thank the Telescope System Specialists at UKIRT, the numerous observers who obtained data for this project through flexible scheduling, and the referee for his/her thorough review of this article. The UKIRT is operated by the Joint Astronomy Centre on behalf of the U.K. Particle Physics and Astronomy Research Council. This research has also made use of the SIMBAD database, operated at CDS, Strasbourg, France, and the NASA ADS database hosted by the Harvard-Smithsonian Center for Astrophysics.
References
- (1) Bacciotti F., Ray T.P., Mundt R., Eislöffel J., Solf J., 2002, ApJ, 576, 222
- (2) Blackman E.G., Frank A., Markiel J.A., Thomas J.H., Van Horn H.M., 2001, Nature, 409, 485
- (3) Borkowski K.J., Blondin J.M., Hartigan P., 1997, ApJ, 482, L97
- (4) Borkowski K.J., Harrington J.P. 2001, ApJ, 550, 778
- (5) Bragg S.L., Smith W.H., Brault J.W., 1982, ApJ, 263, 994
- (6) Bujarrabal V., Alcolea J., Neri R., Grewing M., 1997, A&A, 320, 540
- (7) Bujarrabal V., Alcolea J., Sahai R., Zamarano J., Zijlstra A.A., 1998a, A&A, 331, 361
- (8) Bujarrabal V., Alcolea J., Neri R., 1998b, A&A, 504, 915
- (9) Bujarrabal V., Castro-Carrizo A., Alcolea J., Sánchez C.C., 2001, A&A, 377, 868
- (10) Coffey D., Bacciotti F., Woitas J., Ray T.P., Eislöffel J., 2004, ApJ, 604, 758
- (11) Crowther P.A., De Marco O., Barlow M.J., 1998, MNRAS, 296, 367
- (12) Davis C.J., Whelan E., Ray T.P., Chrysostomou A., 2003a, A&A, 397, 693
- (13) Davis C.J., Smith M.D., Stern L., Kerr T.H., Chiar J., 2003b, MNRAS, 344, 262
- (14) Davis C.J., Smith M.D., Eislöffel J., Davies J.K., 1999, MNRAS, 308, 539
- (15) Davis C.J., Berndsen A., Smith M.D., Chrysostomou A., Hobson J., 2000 MNRAS, 314, 241
- (16) Frank A., 1994, AJ, 107, 261
- (17) Frank A., Blackmann E.G., 2004, ApJ, 614, 737
- (18) García-Segura G., Langer N., Rozyczka M., Franco J., 1999, ApJ, 517, 767
- (19) García-Hernández D.A., Manchado A., García-Lario P., Dominguez-Tagle C., Conway G.M., Prada F., 2002, A&A, 387, 955
- (20) Guerrero M.A., Villaver E., Manchado L., García-Lario P., Prada F., 2000, ApJS, 127, 125
- (21) Herbig G.H., 1975, ApJ, 200, 1
- (22) Hinkle K., Wallace L., Livingstone W., 1995, in Infrared Atlas of the Arcturus Spectrum, 0.9-5.3 m, Astron. Soc. Pac., San Francisco, p.199
- (23) Hollenbach D., McKee C.F., 1989, ApJ, 342, 306
- (24) Hora J.L., Latter W.B., Deutsch, L.K., 1999, ApJS, 124, 195
- (25) Hrivnak B.J., Kwok S., Geballe T.R., 1994, ApJ, 420, 783
- (26) Hummer D.G., Storey P.J., 1987, MNRAS, 224, 801
- (27) Johansson S., 1978, Physica Scripta, 18, 217
- (28) Knapp G.R., Bowers P.F., Young K., Phillips T.G., 1995, ApJ, 455, 293
- (29) Königl A., Pudritz R.E., 2000, in Mannings V., Boss A.P., Russell S.S. eds., Protostars and Planets IV, Univ. Arizona Press, Tucson, p.759
- (30) Kwok S., 1993, ARA&A, 31, 63
- (31) Kwok S., 2000, in The origin and evolution of Planetary Nebulae, CUP, Cambridge, p.30
- (32) Kwok S., Hrivnak B.J., Su K.Y.L., 2000, ApJ, 544, L152
- (33) Kwok S., Hrivnak B.J., Zhang C.Y., Langill P.L., 1996, ApJ, 472, 287
- (34) Kwok S., Purton C.R., Fitzgerald P.M., 1978, ApJ, 219, L125
- (35) Kwok S., Su K.Y.L., Hrivnak B.J., 1998, ApJ, 501, L117
- (36) Langill P.P., Kwok S., Hrivnak B.J., 1994, PASP, 106, 736
- (37) Latter W.B., Kelly D.M., Hora J.L., Deutsch L.K., 1995, ApJS, 100, 159
- (38) Lee C-F., Sahai R., 2003, ApJ, 586, 319
- (39) Likkel L., Morris M., Kastner J.H., Forveille T., 1994, A&A, 282, 190
- (40) Loup C., Forveille T., Omont A., Paul J.F., 1993, A&AS, 99, 291
- (41) Mauron N., Le Borgne J.F., Picquette M., 1989, A&A, 218, 213
- (42) Meixner M., Campbell M.T., Welch W.J., Likkel L., 1998, ApJ, 509, 392
- (43) Meixner M., Skinner C.J., Graham J.R., Keto E., Jernigan J.G., Arens J.F., 1997, ApJ, 482, 897
- (44) Mountain C.M., Robertson D., Lee T.J., Wade R., 1990, in Instruments in Astronomy, SPIE v1235, VII, p.25
- (45) Natta A., Hollenbach D., 1998, A&A, 337, 517
- (46) Nisini B., Caratti o Garatti A., Gianninni T., Lorenzetti D., 2002, A&A, 393, 1035
- (47) O’Connell B., Smith M.D., Davis C.J., Hodapp K.W., Khanzadyan T., Ray T.P., 2004, A&A, 419, 975
- (48) Riera A., García-Lario P., Manchado A., Bobrowsky M., Estalella R., 2003, A&A, 401, 1039
- (49) Riera A., García-Lario P., Manchado A., Pottasch S.R., Raga A.C., 1995, A&A, 302, 137
- (50) Roche P.F. et al., 2003, in Iye M., Moorwood A.F., eds., Instrument Design and Performance for Optical/IR Ground-Based Telescopes, SPIE, 4841, 901
- (51) Roddier F., Roddier C., Graves J.E., Northcott M.J., 1995, ApJ, 443, 249
- (52) Rousselot P., Lidman C., Cuby J.-G., Moreels G., Monnet G., 2000, A&A, 354, 1134
- (53) Sahai R., et al., 1998, ApJ 492, L163
- (54) Sahai R., Bujarrabal V., Castro-Carrizo A., Zylstra A., 2000, A&A, 360, L9
- (55) Sahai R., Bujarrabal V., Zylstra A., 1999, ApJ, 518, L115
- (56) Smith M.D., 1991, MNRAS, 253, 175
- (57) Smith M.D., 1994, MNRAS, 266, 238
- (58) Smith M.D., Khanzadyan T., Davis C.J., 2003, MNRAS, 339, 524
- (59) Soker N., Rappaport S., 2000, ApJ, 538, 241
- (60) Solf J., 1994, A&A, 282, 567
- (61) Su K.Y.L., Volk K., Kwok S., Hrivnak B.J., 1998, ApJ, 508, 744
- (62) Su K.Y.L., Hrivnak B.J., Kwok S., 2001, AJ, 122, 1525
- (63) Su K.Y.L., Hrivnak B.J., Kwok S., Sahai R., 2003, ApJ, 126, 848
- (64) Trammell S.R., Goodrich R.W., 1996, ApJ, 468, L107
- (65) Ueta T., Meixner M., Bobrowski M., 2000, ApJ, 528, 861
- (66) Weintraub D.A., Huard T., Kastner J.H., Gatley I.A., 1998, ApJ, 509, 728