G313.3+00.3: A New Planetary Nebula discovered by the Australia Telescope Compact Array and the Spitzer Space Telescope
Abstract
We present a new planetary nebula, first identified in images from the Australia Telescope Compact Array, although not recognized at that time. Recent observations with the Spitzer Space Telescope during the GLIMPSE Legacy program have rediscovered the object. The high-resolution radio and infrared images enable the identification of the central star or its wind, the recognition of the radio emission as thermal, and the probable presence of polycylic aromatic hydrocarbons in and around the source. These lead to the conclusion that G313.3+00.3 is a planetary nebula. This object is of particular interest because it was discovered solely through radio and mid-infrared imaging, without any optical (or near-infrared) confirmation, and acts as a proof of concept for the discovery of many more highly extinguished planetary nebulae. G313.3+00.3 is well-resolved by both the instruments with which it was identified, and suffers extreme reddening due to its location in the Scutum-Crux spiral arm.
1 Introduction
The GLIMPSE (Galactic Legacy Infrared Mid-Plane Survey Extraordinaire) Legacy program (Churchwell et al. 2004) is surveying 220 deg2 of the plane in all four bands of the Infrared Array Camera (IRAC: Fazio et al. 2004) aboard the Spitzer Space Telescope (Werner et al. 2004). GLIMPSE is generating a wealth of detailed imagery of the plane at mid-infrared (MIR) wavelengths. The greatest scientific yield from any such survey occurs when multiwavelength data are compared. Detailed panoramic comparisons of areas of the Galactic plane in the radio continuum and MIR were undertaken by Cohen & Green (2001), who examined 8 deg2 in the l = 312∘ region using matched resolution imagery. These authors investigated the detailed 843-MHz inventory of this field made by Whiteoak et al. (1994) with the Molonglo Observatory Synthesis Telescope (MOST; Mills 1981; Robertson 1991). The Midcourse Space eXperiment (MSX: Price et al. 2001) detected a substantial number of Hii regions, of diverse morphology, in its MIR survey of the Galactic Plane, which Cohen & Green (2001) used to calibrate the ratio of 8.3-m to 843-MHz flux densities, , as a discriminant between thermal and nonthermal radio sources. We are engaged in a detailed comparison of the GLIMPSE images of the same l = 312∘ field previously studied with MSX and the MOST.
This paper presents high-resolution radio continuum and Spitzer images of G313.3+00.3, an object which appears as a nebulous ring with a central star. The radio images, together with a new 843-MHz image, have been used to estimate a spectral index for the source, which implies that the object is thermal (§2). Previous infrared (IR) and optical information available in the literature constitute §3. IR images of the nebula taken with the IRAC are discussed in §4, and alternative explanations for the nebula are considered in §5, after which (§6) we conclude that the source is an extremely highly reddened planetary nebula (PN).
2 Radio continuum observations
The original impetus for carrying out high-resolution radio continuum images of this region was to search for posssible counterparts to an unidentified Galactic plane -ray source. The initial radio survey used to pinpoint the target region was the first epoch Molonglo Galactic Plane Survey (MGPS1; Green et al. 1999) from the MOST. That 843-MHz continuum observation has a resolution of cosec and a 1 sensitivity of mJy beam-1. The MOST image used in the present paper to calculate flux densities is a mosaic (J1430M60) of the second epoch survey MGPS2 (Green 2002) which is available at the website http://www.astrop.physics.usyd.edu.au/SUMSS. The observational parameters are essentially unchanged from MGPS1.
The targeted radio continuum images were part of the project to search for the radio counterpart of the EGRET source GeV (Roberts et al. 1999). Observations were made at 13 and 20 cm with the Australia Telescope Compact Array (ATCA; Frater et al.1992) in three configurations: 1.5A (1998 January 11), 0.75A (1998 April 22), and 0.375 (1998 March 28). In addition, high-resolution 20-cm data were included from three observations taken in 1999 and 2001 in the 6D, 0.375, and 0.75C configurations by Froney Crawford and Simon Johnston (these are detailed by Roberts et al. (2001)). The ATCA can observe two simultaneous frequency bands and 1384 and 2496 MHz were selected. For the 1.5A array, the lower frequency was slightly different, at 1344 MHz. For all observations a bandwidth of 128 MHz was used and full Stokes parameters were recorded. For most of the analysis in Roberts et al. (1999), images were used which did not include the baselines to the 6-km antenna.
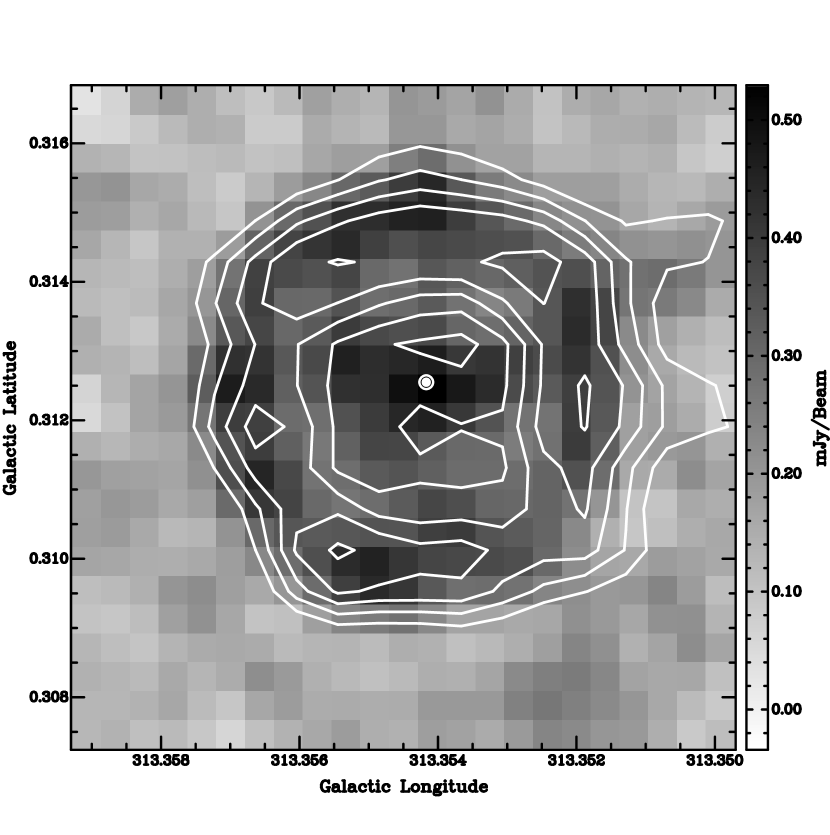
High-resolution images including the 6-km antenna of the ATCA were also made, using the MIRIAD (Sault et al. 1996), maximum entropy method to minimize artefacts. The ring source presented in this paper is shown in the high-resolution 13-cm image of Figure 3 of Roberts et al. (1999), but there is no discussion on its nature. This image has an angular resolution of and an rms noise of 0.1 mJy beam-1. The high-resolution 20-cm image presented in this paper has an angular resolution of and an rms noise of 0.1 mJy beam-1. In both the high-resolution images a shell is clearly seen. In the low resolution images, the source is seen as slightly extended which allows an accurate measure of the total flux density for spectral index calculations. These total flux densities at the three frequencies appear in Table 1. A formal regression yields a slope of , and an essentially constant flux density of mJy, with = 4.3, consistent with a flat spectrum from thermal bremsstrahlung. Note that, at these frequencies, the Galaxy is optically thin so the issue of synchrotron self-absorption along the line-of-sight does not arise.
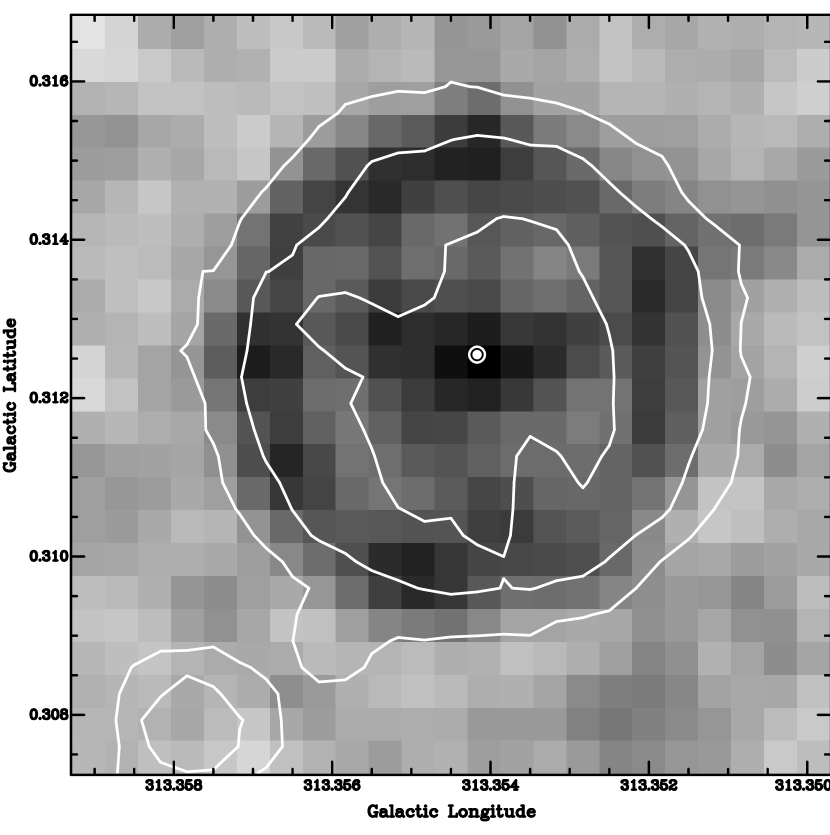
Figure 1 presents the high-resolution 13-cm image of the nebula overlaid by contours of high-resolution 20-cm emission. A central point source is detected at both frequencies although its peak is better determined at 13 cm: , (J2000), corresponding to l=313.3541∘, b=+0.3125∘. It lies at the geometric center of the nebula. We identify this as the location of the central star of the nebula.
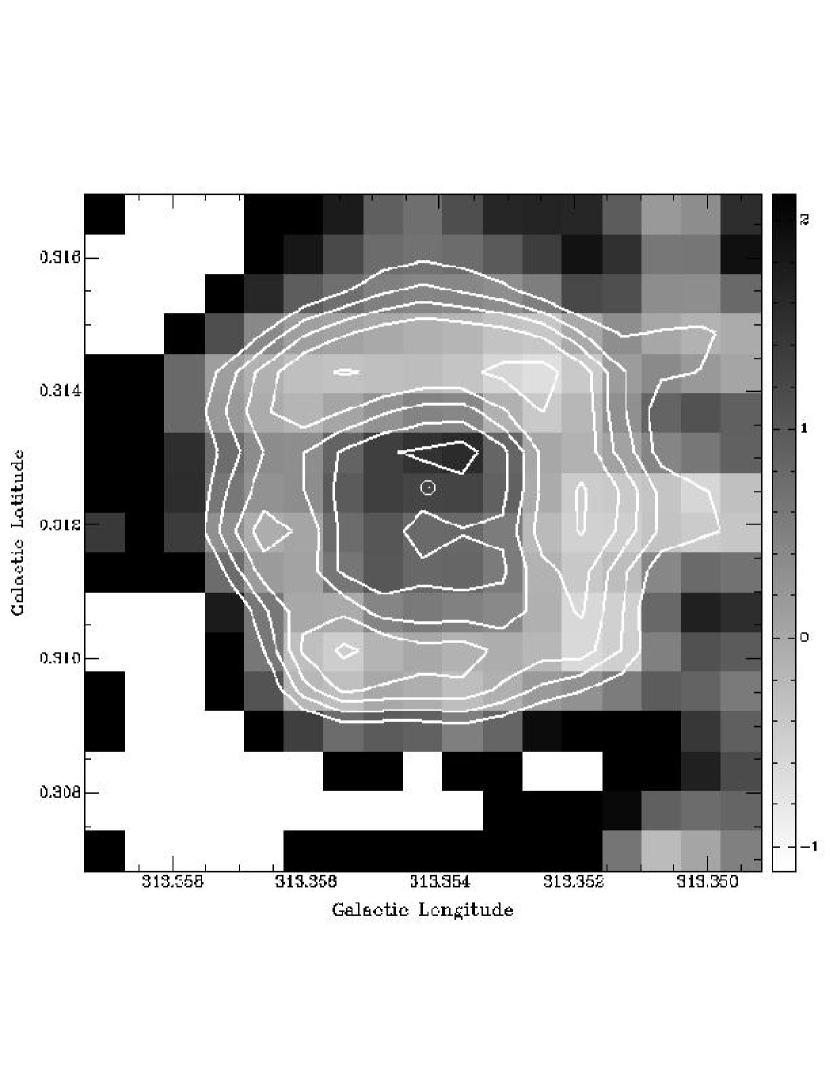
Figure 2 shows the spatial variation of spectral index between 13 and 20 cm across the nebula and at the stellar location. This map was made by matching the 13-cm image to the resolution and pixel grid of the 20-cm map. The ratio of these two images was scaled to represent the spectral index, , where Sν . At the star, , which is somewhat flatter than a Rayleigh-Jeans slope for emission from optically thick gas. At the location of the central star is a 13-cm point source with a flux density of 1 mJy. It is difficult to extract a 20-cm counterpart because locally there is extended emission of comparable brightness to the stellar peak. The formal fit yields 2.6 mJy although this peak is 1.5 beams away from the well-determined 13-cm peak. If this does represent the star at 20 cm then the spectral index is 1.7, with probable uncertainty large enough to include an index of 2, i.e. emission in the Rayleigh-Jeans regime of a hot object. The region immediately surrounding the star is occupied by nebular gas with an average index of . The outer annulus of the nebula has = , indicative of thermal (free-free) emission.
3 Infrared and optical data from the literature
The first detection of a MIR source at this location was made by IRAS. The IRAS Point Source Catalog lists IRAS , whose original (B1950) position corresponds to , (J2000). It was detected only at 25 m with a flux density below 1 Jy. Consequently, the object has never been classified, because neither color nor color-color criteria could be applied.
During their MIR and radio study of the l = 312∘ region Cohen & Green (2001) used MSX imagery of the Galactic plane with 20′′ resolution from the “CB-02” data collection events. The nebula is faint but was detected in these images, although it was essentially unresolved. Additional, deeper MSX data are now available (the “CB-03” data) which are roughly 5 deeper than the CB-02 images. The nebula is not listed in the MSX Point Source Catalog (Ver. 2.3: Egan et al. 2003), although it was covered in the CB-03 field centered near l = 315∘ (Price et al. 2001). In this deeper 8.3-m image it appears as a resolved object about , i.e. with a deconvolved size of . The same source is also detected in the 14.6-m CB-03 image of this same field. These MIR flux densities are collected into Table 1.
A search of the 2MASS archives and images shows no near-infrared (NIR) counterpart to the nebula. Likewise, no southern broadband optical () image, from the UK Schmidt Telescope/SuperCosmos surveys shows a counterpart to the nebula. However, there may be an extremely faint counterpart in the highly sensitive narrowband Southern H Survey of the Galactic plane (SHS: Parker & Phillipps 1998,2003), which can serve at least as an upper limit to H brightness (see §5). These attributes suggest a highly reddened and/or distant object.
4 New Spitzer infrared images
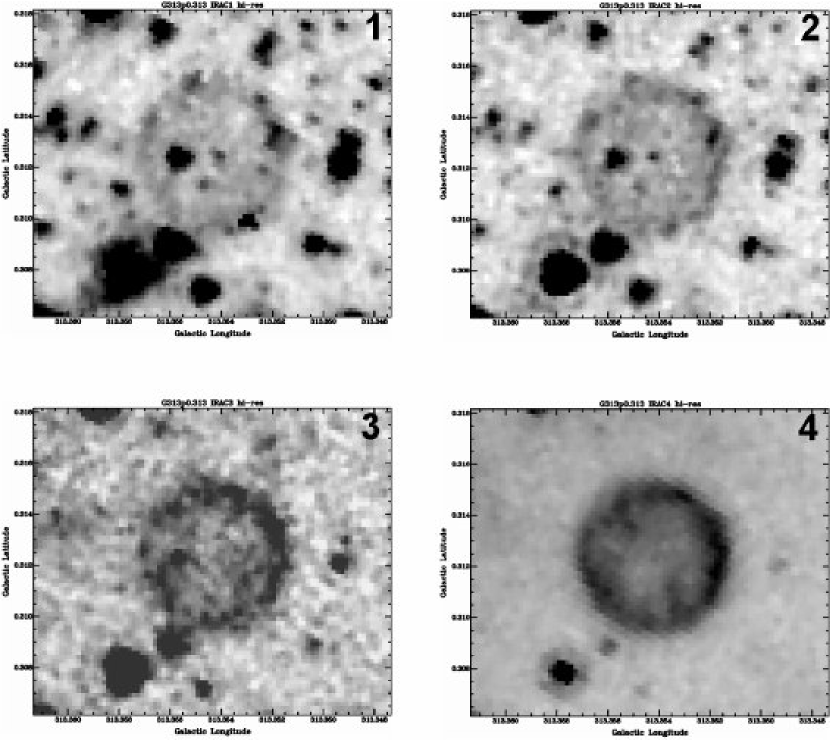
Cohen & Green (2001) established a distinction between thermal and nonthermal radio emission by comparing MIR and radio counterparts of many different types of Hii region in the l = 312∘ area. GLIMPSE offers a deeper exploration of this field and could potentially unravel the most complex areas in which MIR-emitting thermal filaments are juxtaposed with regions known to be nonthermal from their radio emission. When we examined the IRAC Band-4 (8.0-m) mosaic images in the vicinity of the EGRET source (Roberts et al. 1999) we immediately saw an IR ring nebula and a central star, where the lower-resolution MSX data showed just a faint blob at 8.3 m.
The individual IRAC frames were calibrated by the Spitzer Science Center (SSC), and further processed by the GLIMPSE pipeline to remove instrumental artifacts such as column pulldown and banding (Hora et al. 2004a). Point sources were extracted from each frame using a modified version of DAOPHOT (Stetson 1987), and cross-referenced using the SSC bandmerger. Mosaics were created using the Montage package111available at http://montage.ipac.caltech.edu. The final GLIMPSE image format has 0.6′′ pixels and appears in Figure 3, which illustrates the four IRAC images of this nebula, which becomes progressively more conspicuous with increasing wavelength. The mosaic images conserve surface brightness. Spatially integrated, background-subtracted fluxes for the whole nebula were extracted at each wavelength (see Table 1) after correcting for obvious point sources within the ring or lying near its rim. The flux calibration of GLIMPSE is cumulatively checked after completion of each segment of the survey against a network of calibrators established in the survey area along the Galactic Plane (Cohen 2004). At present, the observed absolute flux densities of a sample of about 70 early A-dwarf and 60 K-giant calibrators show agreement with predictions to within 3% in all IRAC bands (Cohen 2004).
At the center of the ring is a local peak in the IRAC Band 1 (3.6 m) and Band 2 (4.5 m) images, which is swamped by bright nebulosity in Band 3 (5.8 m) and Band 4 (8.0 m). This peak pixel is at l=313.3541∘, b=+0.3125∘ and is clearly the IR counterpart of the central point source detected in the radio. Its designation in the GLIMPSE archive is: SSTGLMA G313.3541+00.3124. Two circles with radii of 12.6′′ and 7.6′′, centered on this NIR peak, provide good fits to the outer and inner edges of the ring, validating the choice of the central source as the exciting star. PSF-fitting photometry of the central star was extracted from the 3.6 and 4.5-m images, above the locally determined nebular emission inside the ring. There is no noticeable central star in the 5.8 or 8.0-m images.
Profiles in Galactic latitude through the center of the ring are presented in Figure 4. Each normalized profile was constructed from the average of the three adjacent spatial slices centered on, and flanking, the position of the peak Band1 pixel of the central star. Negative distances from the center correspond to southward latitudes from the star.
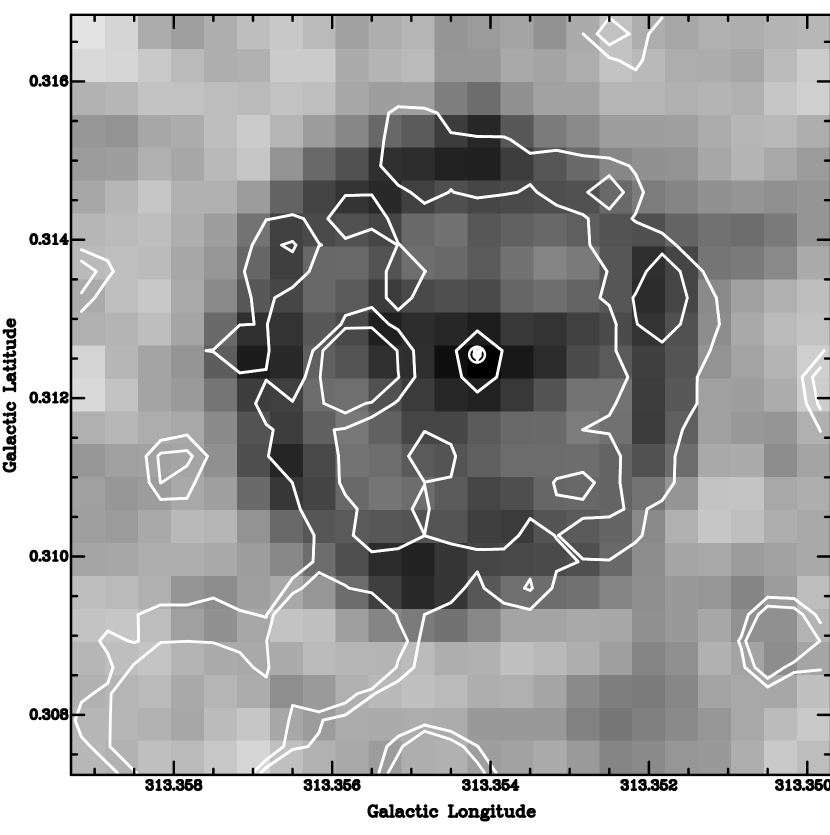
Figures 5 and 6 compare the high-resolution 13-cm with the 4.5-m and 8.0-m images. In each IR band the lowest contour corresponds to 4 above the local background level. Only the 4.5-m IRAC band should contain no significant contribution from PAH emission. Radiation in this band might represent line emission from ions (e.g. [Mgiv]), or molecular gas (e.g. ro-vibrational H2 lines, 0-0 S(8)-S(11)), thermal emission from free-free continuum, or from heated dust grains.
The good match in nebular extent and morphology between the 4.5-m and radio maps would suggest that both these images trace ionized gas. By contrast, the 8.0-m emission clearly extends beyond the radio thermal emission, consistent with the presence of polycyclic aromatic hydrocarbon (PAH) emission in the 8.0-m bandpass. This would be expected if the PAHs resided in the photodissociation region (PDR) surrounding the ionized gas (e.g. Cohen & Green 2001). This 8.0-m extension beyond the ionized gas could also be consistent with the presence of molecular hydrogen emission lines in IRAC Band 4.
5 The nature of the nebula
We will calculate the mass and distance of the nebula, after determining the contribution of recombination lines, and free-free and bound-free continua, to the IRAC fluxes, based on the radio free-free fluxes, and estimating the interstellar extinction from an upper limit to the H flux, and from extinction maps based on DIRBE data.
We have calculated the contributions suggested by the radio emission at 13 cm, assumed to be thermal, to the H-line emission within each of the IRAC filters. The strongest expected recombination lines are Pf and Pf in IRAC1; Br and Pf in IRAC2; Hu in IRAC3; and Pf and Hu in IRAC4. All the 13-cm emission was attributed to free-free, using emissivities from Storey & Hummer (1995) for Te=104 K (the density is almost unimportant), approximating the radio free-free Gaunt factor by Osterbrock (1989: eqn. 4.30), and ignoring the effects of any dust mixed with the ionized gas. The free-free continuum within the IRAC bands was computed with IR Gaunt factors from Beckert et al. (2000), and the bound-free component was estimated following Seaton (1960) for transitions from the continuum to levels with n = 6 to 9. The resulting intrinsic flux densities expected from the entire nebula, combining these thermal processes, are 4, 8, 1, and 2 mJy in IRAC Bands 1,2,3,4, respectively. We now require an estimate of the intervening extinction to assess whether these processes make any observable MIR contributions to the nebular emission.
The thermal radio emission provides an estimate of the intrinsic emission line flux in H (see Condon (1992), eqns. (3) and (4a)). Using this formulation yields 2.1 erg cm-2 s-1 for the integrated intrinsic H flux, before the effects of extinction. To determine an upper limit for the spatially-integrated H flux of the nebula, we have applied the absolute calibration procedure to the SHS H image that Pierce (2004) describes. The SHS obtains short-red (SR) continuum exposures of each H field. Numerically scaled versions of these were intended to be used to remove any continuum that is included in the narrowband H filter. After detailed cross-comparison with the absolutely calibrated, but spatially much lower-resolution, Southern H Sky Survey Atlas (Gaustad et al. 2001), Pierce provides both the SR scale factors and the number of flat-fielded SHS H counts pixel-1 that are equivalent to 1 Rayleigh ( erg cm-2 s-1 sr-1 at H). The ring lies in the SHS field HAL0182, for which Pierce gives an SR scale factor of 1.12 and 7.8 counts pixel, although there is a very large amount of scatter about the latter value in this field (Pierce 2004, Table 2). Visual examination of this calibrated SHS H image, guided by overlaying the 13-cm outer radio contour of the nebula, suggests that a potential excess of H emission exists within the ring. However, there is no statistically significant excess compared with other regions of the image lacking point sources. Taking the measured H flux within the ring as a conservative upper limit to the H emission, the brightness integrated over the nebula is less than 9.0 erg cm-2 s-1. Comparing this limit with the predicted H emission implies that AV exceeds 13m (e.g. using the reddening law of Cardelli et al. (1989) in the optical, assuming AV/ = 3.1 (appropriate for the diffuse interstellar medium)). Using the extinction maps of Schlegel et al. (1998), the total Galactic extinction along the line-of-sight to the nebula is AV36m. Although this is large it is not atypical for the cores of spiral arms.
The influence on IRAC flux densities of this substantial visual extinction cannot be neglected. Adopting an AV of yields extinctions () in the IRAC bands of 2.280.25, 1.750.32, 1.750.40, and 1.750.40m, respectively, from the empirical reddening law found by Indebetouw et al. (2005) for the IRAC bands along two lines-of-sight. A conventional reddening law (e.g. Cohen et al. 2003) gives extinctions of 1.85, 1.26, 0.94, and 1.59m, respectively. Both these sets of attenuations would render the expected contributions of gaseous thermal processes to the observed flux densities negligible (1 mJy or less) in all IRAC bands.
The radio flux density can be converted into the ionized mass of the ring (Mezger & Henderson 1967, Appendix A, eqn. A.14), using Te = 104 K, assuming the simplest model of a uniformly filled sphere, and adopting a 5-GHz flux density of 25 mJy, equal to the best fit to the three lower frequencies described above. The ionized mass is 0.0022D M⊙, where Dkpc is the distance to the ring in kpc. The mean ionized mass of planetary nebulae (PNe) is between 0.1 and 0.25 M⊙ (Boffi & Stanghellini 1994), suggesting that the ring is between 4.6 and 6.6 kpc from the Sun. In this direction the line-of-sight extinction based on reddened OBA stars amounts to only 3m out to a distance of 3 kpc (Neckel et al. 1980). The nebula is seen in the direction of the tangent to the Scutum-Crux spiral arm. The tangent point lies 6.6 kpc from the Sun (Taylor & Cordes 1993). We, therefore, favor a distance close to 6.6 kpc because it provides a natural explanation for the extremely high extinction that the PN suffers at a relatively modest distance from the Sun, namely in the dust lane associated with this arm. Identifying the reddening with an arm links the bulk of the DIRBE-derived extinction in this longitude to the spiral arm, rather than being distributed along an extended line-of-sight through the Galaxy as, for example, the 30m of AV associated with the direction to the Galactic center. The implied nebular radius is 0.4 pc, close to the median (0.3 pc) for a set of PNe in the Magellanic Clouds (Stanghellini et al. 1999).
6 Discussion
The morphology of the MIR and radio continuum images suggests that ionized gas dominates the 4.5-m image, while PAHs contribute dominantly at 8.0-m. However, as demonstrated above, the contributions to the 4.5-m emission from thermal processes that involve atomic hydrogen are very small. Therefore, any ionic lines within this band must come from heavy elements with rather strong gf values; for example, [Mgiv] at 4.485 m, and [Avi] at 4.530 m. Both these lines are seen in high-excitation PNe. In NGC 7027 and NGC 7662, which have significant MIR continua, the lines account for almost 10% of the flux in the 4.5-m band. In a PN lacking such a continuum the lines’ contribution could be larger. Alternatively, a variety of H2 emission lines could contribute in several IRAC bands, but chiefly at 8.0 m, as Hora et al. (2004b) found from an IRAC survey of nine PNe.
Were the nebula to be a supernova remnant (SNR) we would expect a negative radio spectral index. Even if the SNR were young, such a shell source would have a negative index reflecting the synchrotron emission mechanism. Examples of young SNRs with a ringlike structure include Tycho, Kepler, Cas A, and SN 1006, and all their radio indices are around . Accretion onto a compact object can produce a flat spectrum, as could a plerion. The cm spectral index (1.7) for the central source is rather uncertain, but probably excludes a flat spectrum, making this interpretation unlikely. If the central source were a very young pulsar wind nebula, the spectrum could even be inverted as in SN 1986J, which recently showed a double power law with slopes and (Bietenholz et al. 2002). However, this time-dependent inversion appears only at high radio frequences (10 GHz). These authors found synchrotron self-absorption within the source was an unlikely explanation for the steeply positive power law. The ring’s radio emission is too weak to measure polarization reliably with current instrumentation.
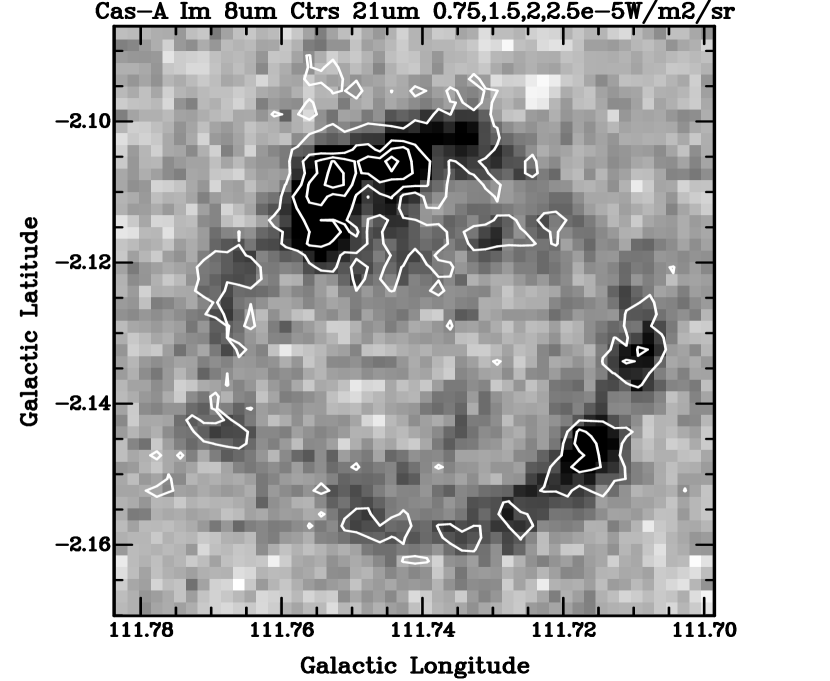
The MIR morphology is also very different from that of a young SNR, e.g. Cas A. Figure 7 illustrates the MSX data for this young remnant, overlaying 21.3-m contours on the 8.3-m image. The SNR is highly clumpy, shows large apparent density contrast and ragged inner and outer edges. These characteristics are unlike those of G313.3+00.3. Recent imaging with the Spitzer Space Telescope (Hines et al. 2004) demonstrates that MIR emission in Cas A correlates well with X-ray and optical emission lines rather than with synchrotron regions. These authors attribute the MIR energy to thermal emission from dust inside the SNR, or associated with emission-line gas inside the reverse shock region. This correlation may arise from grain formation in regions with sufficiently cool gas, militating against a smoothly varying distribution of MIR emission.
Nonthermal emission in the IR and radio would lead to a ratio of 3 (Cohen & Green 2001). In fact, the nebular ratio is about 6 for G313.3+00.3. This is closer to the values found for PNe, for which the median ratio is 12, with a semi-interquartile range of 6, than to Hii regions (median 24). If the MIR spectrum were that of a PN or an SNR dominated entirely by emission lines, as in high-excitation objects, one would expect spatial variations across the nebula in the intensity ratios among the IRAC bands (implicit in Figure 7). We now investigate the integrated intensity ratios of 8.0-m/5.8-m and 8.0-m/3.6-m in G313.3+00.3 and compare these with known PNe. If it were a PN in which PAHs dominated the spectral energy distribution (SED) then band-to-band ratios should be rather uniform across the nebula. We eliminated the contributions from the presumed unrelated, bright point source within the ring, and from the central star. The nebular mean intrinsic values for these two ratios in G313.3+00.3, derived by dereddening the observed maps, are and , and are quite uniform over the nebula. These uncertainties incorporate the differences in corrections between a conventional extinction law and that presented by Indebetouw et al. (2005).
A rough estimate of what to expect for a PN with only PAH emission comes from assigning the observed 3.6, 5.8, and 8.0-m PN intensities purely to the 3.3, 6.2, 7.7, and 8.7-m PAH bands. The predicted ratios would then be 2.7 (Band 4/Band 3) and 17 (Band 4/Band 1) (Cohen et al. 1986: Table 2, for PNe; Cohen et al. 1989: Tables 3 and 4, for PNe). These are very similar to the ratios for G313.3+00.3. A more precise approach is to synthesize IRAC photometry from MIR spectra of PNe. Volk & Cohen (1990) characterized the 7.7 to 22.7-m spectra of 170 PNe according to the dominance of PAHs, broad or narrow dust emission features, and of atomic fine structure lines of low, high, or very high excitation. The recognition that, in some bands, almost all the MIR emission in a PN can be contributed by pure rotational lines of H2 (e.g. Cox et al. 1998) implies that one must additionally consider H2 line emission. To quantify this emission in an extreme case of a PN entirely dominated by H2 lines, we have combined the line data for the Helix Nebula (Cox et al. 1998) with those for NGC 6302, NGC 7027, and Hb 5 (Table 7 of Bernard-Salas & Tielens (2005)). In real PNe, the H2 line emission that falls within the IRAC bands is also accompanied by MIR continuum, fine structure lines, and/or PAHs. We have integrated the new (July 2004) IRAC relative spectral response curves over the spectra of 63 PNe observed with the ISO Short Wavelength Spectrometer (including three of the H2-emitting PNe cited above), and have formed the observed intensity ratios 8.0-m/5.8-m and 8.0-m/3.6-m. Allowance for extinction in these PNe would change the observed ratios very little. (For a PN with a modest AV of 3m, the intrinsic ratios would differ from those observed by at most 4% percent, whichever reddening law is used. In fact, Band 4/Band 3 is unaltered with the Indebetouw et al. (2005) extinction.) We have averaged the ratios observed for PNe grouped according to their most conspicuous MIR spectral character.
For 16 PNe dominated by PAH emission the mean ratios of 8.0-m/5.8-m and 8.0-m/3.6-m are found to be 2.90.2 and 143, entirely consistent (within 1) with those of G313.3+00.3. Could another emission mechanism mimic these radiance ratios? The most restrictive criterion is the 8.0-m/3.6-m ratio. Only for PNe dominated by very high excitation emission lines does this ratio attain a value (14) comparable to that of G313.3+00.3 but, for such PNe, 8.0-m/5.8-m is much too low (). No single emission process other than PAHs can simultaneously match the intrinsic Band 4/Band 3 and Band 4/Band 1 ratios of G313.3+00.3. Specifically, H2 line emission alone gives mean ratios of 5.51.2 and 4.91.8, respectively, quite inconsistent with G313.3+00.3. Might a combination of emission processes match the ratios in G313.3+00.3? Adding the pure H2 to the very high excitation line spectrum in the proportion of 1:3 would formally produce spatially integrated nebular ratios of 2.80.5 and 11.92.8. However, it is impossible for such values to be relatively uniform across a PN because each process requires radically different physical conditions. H2 emission arises near the surface of PDRs but the chief cooling lines are in the far-IR, from low excitation ions such as [Cii], [Oi], and [Siii] (Bernard-Salas & Tielens 2005), not the species that characterize IRAC’s wavelength range in very high excitation PNe such as NGC 2440 (Bernard-Salas et al. 2002), e.g. [Arvi] and [Nevi]. The band-to-band ratios of G313.3+00.3 are, therefore, consistent only with a PAH-dominated spectrum.
Figure 8 shows the spatially-integrated SED for the nebula, both observed, and after dereddening corresponding to an AV of , using Indebetouw et al. (2005). For each data point, asymmetric horizontal bars represent the extent of the FWHM of the corresponding filter band. The obvious features appear to correspond with PAH emission bands at 3.3 and 7.7 m. Only a weak PAH contribution would be expected in the 14.6-m MSX band from C-C-C modes near 16 m. The dominance of the 3.3-m PAH band in this plot of specific intensity is misleading. Both this feature and the IRAC 3.6-m bandwidth are far narrower than the 7.7 m band and the 8.0-m filter, greatly reducing the integrated in-band flux contributed by PAHs to the IRAC Band-1 data point as compared with Band-4. Between 3 and 30 m the ring emits only about 700 L⊙, even after dereddening by 36m. However, the complete absence of any optical or NIR detection of the ring renders any meaningful estimate of its bolometric luminosity impossible from our observations. The bulk of the expected luminosity should occur in the optical and UV, but we lack any data to deredden at these short wavelengths.
Scaling down the predicted IR thermal emission of the entire nebula to that of the central source by the ratio of their 13-cm flux densities suggests approximately 0.2 and 0.4 mJy in IRAC Bands 1 and 2. These predictions are of the same order as the values measured for the central star, and the predicted flux density ratio is in accord with that observed, at the 1 level. (In the above simplistic calculation we have neglected the probable higher values of Te and ionic charge expected within the stellar wind as opposed to the overall nebula.) It is somewhat unusual for a star to have a radio counterpart. But this a plausible explanation in the context of the central star of a PN. Taylor et al. (1987) modeled thermal radio emission from such a stellar wind with a 1/r2 density profile, and matched the observed radio spectra for a sample of PNe with slopes of 1. Truncation of these stellar winds also steepens radio spectral indices (Marsh 1975). Therefore, the central star, or at least its wind, is detected in both the IR and the radio.
We conclude that G313.3+00.3 is most likely to be a PN within heavy obscuration associated with our almost tangential view along the Scutum-Crux spiral arm. The regular nebular morphology, the presence of a radio and IR source at the geometric center, the spatially rather uniform ratio-images in key IRAC bands, and the quantitative match to what is expected for these band ratios from PAH emission, all support this classification. We anticipate that this PN will be only the first of many highly extinguished planetary nebulae to be discovered by GLIMPSE.
References
- (1) Beckert, T., Duschl, W.J, & Mezger, P.G. 2000, A&A, 356, 1149
- (2) Bernard-Salas, J., Pottasch, S. R., Feibelman, W.A., & Wesselius, P.R. 2002, A&A, 387, 301
- (3) Bernard-Salas, J. & Tielens, A.G.G.M, 2005, A&A, 431, 523
- (4) Bietenholz, N.F., Bartel, M. & Ruben. M.P. 2002, ApJ, 581, 1132
- (5) Boffi, F.R., & Stanghellini, L. 1994, A&A, 284, 248
- (6) Cardelli, J.A., Clayton, G.C., & Mathis, J.S. 1989, ApJ, 345, 245
- (7) Churchwell, E.B. et al. 2004, ApJS, 154, 322
-
(8)
Cohen, M. 2004, Proc. of Spitzer Calibration Workshop, Pasadena, Nov. 8
(http://ssc.spitzer.caltech.edu/ost/workshop/
2004calib/pdf/cohenm.pdf) - (9) Cohen, M., Allamandola, L.J., Tielens, A.G.G.M., Bregman, J.D., Simpson, J.P., Witteborn, F.C., Wooden, D.H., & Rank, D.H. 1986, ApJ, 302, 737
- (10) Cohen, M., Green, A. 2001, MNRAS, 325, 531
- (11) Cohen, M., Megeath, T.G., Hammersley, P.L., Martin-Luis, F., & Stauffer, J. 2003, AJ, 125, 2645
- (12) Cohen, M., Tielens, A.G.G.M., Bregman, J. D., Witteborn, F. C., Rank, D. M., Allamandola, L. J., Wooden, D. H., & de Muizon, M. 1989, ApJ, 341, 246
- (13) Condon, J.J. 1992, ARA&A, 30, 575
- (14) Cox, P. et al. 1998, ApJ, 495, L23
- (15) Egan, M.P., Price, S.D., Kraemer, K.E., Mizuno, D.R., Carey, S.J., Wright, C.O., Engelke, C.W., Cohen, M., & Gugliotti, G.M. 2003, “The Midcourse Space Experiment Point Source Catalog Version 2.3 Explanatory Guide, AFRL-VS-TR-3004-1589
- (16) Fazio, G.G. et al. 2004, ApJS, 154, 10
- (17) Frater, R.H., Brooks, J.W., & Whiteoak, J.B. 1992, E.E.E.Aust. 12, 103
- (18) Gaustad, J.E., McCullough, P.R., Rosing, W., Van Buren, D. 2001, PASP, 113, 1326
- (19) Green, A.J. 2002, The Universe at Low Frequencies, IAU Symposium 199, eds. A.P. Rao, G. Swarup, G. Krishna, pg.259
- (20) Green, A.J., Cram, L.E., Large, M.I., Ye, T. 1999, ApJS, 122, 207
- (21) Hines, D.C. et al. 2004, ApJS, 154, 290
- (22) Hora, J.L. et al. 2004a, SPIE [5487-06]
- (23) Hora, J.L., Latter, W.B., Allen, L.E., Marengo, M., Deutsch, L.K., & Pipher, J.L. 2004b, ApJS, 154, 296
- (24) Indebetouw, R. et al. 2005, ApJ, 619, 931
- (25) Mills, B. Y., 1981, Proc. ASA, 4, 156
- (26) Marsh, K.A. 1975, ApJ, 201, 190
- (27) Mezger, P.G., Henderson, A.P. 1967, ApJ, 147, 471
- (28) Neckel, T., Klare, G., & Sarcander, M. 1980, A&AS, 42, 251
- (29) Osterbrook, D. E. 1989, “Astrophysics of Gaseous Nebulae and Active Galactic Nuclei” (Mill Valley: University Science Books)
- (30) Parker, Q.A., Phillipps, S. 1998, A&G, 39, 10
- (31) Parker, Q.A., Phillipps, S. 2003, IAU 8th Asia-Pacific Regional Mtg., ASP Conf. Ser., 289, eds. S. Ikeuchi, J. Hearnshaw & T. Hanawa, pg.165
- (32) Pierce, M. 2004, Ph.D. dissertation, Univ. or Bristol, UK (in preparation)
- (33) Price, S.D., Egan, M.P., Carey, S.J., Mizuno, D., Kuchar, T. 2001, A&A, 121, 2819
- (34) Roberts, M. S. E., Romani, R. W., Johnston, S., & Green, A. J., 1999, ApJ, 515, 712
- (35) Roberts, M. S. E., Romani, R. W., & Johnston, S. 2001, ApJ, 561, 187
- (36) Robertson, J. G., 1991, Aust. J. Phys., 44, 729
- (37) Sault, R.J., Staveley-Smith, L., & Brouw, W.N. 1998, Miriad Users Guide (ATNF)
- (38) Schlegel, D., Finkbeiner, D., & Davis, M. 1998, ApJ, 500, 525
- (39) Seaton, M.J. 1960, Rep. Prog. Phys., 23, 313
- (40) Stanghellini, L., Blades, J.C., Osmer, S.J., Barlow, M.J., & Liu, X.-W. 1999, ApJ, 510, 687
- (41) Stetson, P.B. 1987, PASP, 99, 191
- (42) Storey, P.J., & Hummer, D.G. 1995, MNRAS, 272, 41
- (43) Taylor, A.R., Pottasch, S.R., & Zhang, C.Y. 1987, A&A, 171, 178
- (44) Taylor, J.H., & Cordes, J.M. 1993, ApJ, 411, 674
- (45) Volk, K. & Cohen, M. 1990, AJ, 100, 485
- (46) Werner, M.W. et al. 2004, ApJS, 154, 1
- (47) Whiteoak, J. B. Z., Cram, L. E., & Large, M. I., 1994, MNRAS, 269, 294


| Waveband | Flux Density |
|---|---|
| The nebula | |
| MOST 843 MHz [mJy] | |
| ATCA 1384 MHz (low-resolution) [mJy] | |
| ATCA 2496 MHz (low-resolution) [mJy] | |
| MSX/CB-02 F(8.3m) [mJy] | |
| MSX/CB-03 F(8.3m) [mJy] | |
| MSX/CB-03 F(14.6m) [mJy] | |
| IRAS F(12m) (Jy) | |
| IRAS F(25m) (Jy) | |
| IRAS F(60m) (Jy) | |
| IRAS F(100m)(Jy) | |
| IRAC F(3.6m [mJy] | |
| IRAC F(4.5m [mJy] | |
| IRAC F(5.8m [mJy] | |
| IRAC F(8.0m [mJy] | |
| The Central Star | |
| ATCA 1384 MHz (high-resolution) [mJy] | |
| ATCA 2496 MHz (high-resolution) [mJy] | |
| IRAC F(3.6m [mJy] | |
| IRAC F(4.5m [mJy] |