HST/ACS Lyman imaging of the nearby starburst ESO 338-IG04††thanks: Based upon observations with the NASA/ESA Hubble Space Telescope obtained at the Space Telescope Science Institute, which is operated by the Association of Universities for Research in Astronomy, Inc., under NASA contract NAS5-26555
ESO 338-IG04 (Tololo 1924-416) is a well known, luminous () Blue Compact Galaxy in the local universe. It has a complex morphology indicating a recent merger and/or close interaction and contains a central young starburst with compact star clusters of ages Myr. The galaxy was imaged using the Advanced Camera for Surveys (ACS) onboard the Hubble Space Telescope (HST) in the Lyman line and continuum. Using the Starburst99 synthetic spectra and other imaging data from the Wide Field and Planetary Camera 2 we developed a technique that allows us to make the first photometrically valid subtraction of continuum from the Ly line. The method allows us to disentangle the degenerate effects of age and reddening by careful sampling of the UV continuum slope and 4000Å discontinuity. Our results are in qualitative agreement with the models of Ly escape being regulated by kinematical properties of the interstellar medium. The line-only image shows Ly in both emission and absorption. Most notably, Ly emission is seen from central bright young clusters and is in spatial agreement with the features present in a longslit spectrum taken with the Space Telescope Imaging Spectrograph. The Ly is also seen in diffuse emission regions surrounding the central starburst where photons escape after one or more resonant scatterings in Hi. Quantitative photometry reveals a total flux in the Ly line of erg s-1 cm-2. The Ly flux in a 10 20″ elliptical aperture centred on the brightest central star cluster measures erg s-1 cm-2 with an equivalent width of 22.6Å. This is in close agreement with previous studies made using spectra from the IUE satellite to which our aperture was created to match. Thus we demonstrate that we have software in place to create line-only Ly maps of nearby galaxies. Analysis of parameter dependencies show our technique to be largely parameter independent, producing Ly maps indistinguishable from one another by eye and with Ly fluxes consistent with one another to better than 50%. We see large amounts of diffuse Ly emission that dominates the total Ly output which are interpreted as centrally produced Ly photons scattered by neutral hydrogen. By comparison of Ly fluxes with H fluxes of a previous study, we estimate that each observed Ly photon has undergone additional scatterings. We see that Ly line kinematics closely correlate with other kinematic tracers but, within this data, find no evidence for Ly emission or absorption from star clusters being a function of age.
Key Words.:
Galaxies: starburst – Galaxies: individual: ESO 338-IG04 – Galaxies: ISM – Ultraviolet: Galaxies – Cosmology1 Introduction
The potential importance of the Ly emission line to probe galaxy formation and evolution in the early universe has long since been recognised. Partridge & Peebles (1967) suggested the Ly line as an important spectral signature in young galaxies at high redshift since the expected Ly luminosity should amount to a few percent of the total galaxy luminosity. If so, Ly fluxes of order erg s-1 cm-2 should be detectable in galaxies forming stars with rates of yr-1 at redshifts () around 3. Early observational attempts were largely disappointing and demonstrated the scarcity of luminous Ly emitters at high redshifts (Pritchet 1994). However, the situation has changed dramatically in the recent years. Candidate Ly emitters are now routinely detected at redshifts using narrow-band imaging techniques, although the actual numbers of detected Ly emitters at high redshift are smaller than was initially predicted (Frye, Broadhurst, & Benítez 2002; Fujita et al. 2003; Ouchi et al. 2003; Malhotra & Rhoads 2002, Fynbo et al. 2001).
In principle, Ly can be used to quantitatively examine reionisation, star-formation rates, and correlation functions and grouping parameters in the distant universe. However, in order to proceed, it is essential for us to understand the physics that regulates Ly escape. The situation is complicated by a number of factors; not least that Ly lies in the far ultraviolet (UV) domain, making it impossible to observe from the ground at redshifts less than . Furthermore, Ly is a resonant line and therefore is sensitive to multiple scatterings and attenuation in Hi clouds and galactic halos. This is evident from the Ly forest and damped Ly absorption seen in QSO absorption spectra. Multiple scatterings can attenuate Ly via two mechanisms. Firstly, resonant scatterings redirect the Ly photons, thereby increasing the path length on which the Ly photons escape the neutral cloud with respect to the nearby continuum. This serves to increase the probability that the photons will be destroyed by interactions with dust grains. Secondly, scattering of Ly photons by Hi can result not in one Ly photon but two photons of lower energy. The probability of this two-photon emission is mildly temperature-sensitive but always .
Early ultraviolet observations of a few nearby starbursts appeared to confirm the high- result: Ly was surprisingly weak; weaker still in more dust-rich galaxies. The reason was first thought to be multiple scatterings in Hi gas increasing the probability of dust absorption (Neufeld 1991). However subsequent Hubble Space Telescope (HST) observations showed that the problem is much more complex. Kunth et al. (1998) discussed a set of eight nearby star-forming galaxies observed with the Goddard High Resolution Spectrograph (GHRS) on HST. Four galaxies showed clear Ly P-Cygni profiles indicating large-scale outflows of the interstellar medium (ISM). In contrast, the four other galaxies show damped Ly absorption, regardless of their dust content. Thuan & Izotov (1997) studied the unique starburst Tol1214-277 whose very strong and symmetric Ly line shows no trace of blueshifted absorption. A subset of the analyzed starburst galaxies were observed with STIS (Mas-Hesse et al. 2003), in order to understand the kinematical structure of the outflowing gas. The main observational result of this work was the identification of rather large expanding shells of neutral gas, spanning up to several kiloparsecs and covering a much larger area than the starburst itself.
The complex nature of the Ly escape probability revealed by the GHRS and STIS spectroscopy (Kunth et al. 1998, Mas-Hesse et al. 2003) raised additional issues. In the case where the UV source is shielded by a slab of static neutral hydrogen, the galaxy appears as a damped Ly absorber. However, if the dust content is small the Ly photons may, after multiple resonant scatterings, diffuse out over a larger area (although attenuated by the two-photon process). This would create a bias in the spectroscopic studies which usually target the regions of peak UV intensity - under this scenario the places where we do not expect to see Ly in emission. Another possibility is that the UV-continuum sources are partly shielded by a clumpy medium, in which case we would see a mixture of absorption and emission. In cases where the ISM has a non-zero radial velocity with respect to the UV continuum source, Ly will appear in emission with a characteristic P-Cygni profile. Since radial velocity of the ISM is so important in determining Ly escape, morphology and kinematics of the galaxy play a vital role as certain kinematic configurations may enhance the escape probability. This in turn implies that the Ly escape probability can vary greatly across the starburst region and, for example, during a merger the escape probability may be enhanced. ESO 338-IG04 is a perfect galaxy to study in this respect because it exhibits Ly that has escaped via all of the mechanisms listed.
In the distant universe, Ly imaging and low resolution spectroscopic techniques are now successfully used to find large numbers of Ly emitting galaxies. However, without a proper understanding of the Ly emission processes this line cannot be used to estimate star formation rates and Ly becomes dubious to use to study clustering if the biases are not properly known. If the star forming activity of a high redshift galaxy is connected with its environment, e.g. induced by merger or interaction, the Ly escape probability will not be independent of this parameter.
These considerations led us to start a pilot program to image local starburst galaxies in the Ly line using the solar blind channel (SBC) of the Advanced Camera for Surveys (ACS) on HST; thereby allowing us to study the Ly emission and absorption morphology in detail. A sample of six galaxies with a range of luminosities ( to ) and metallicities () were selected, including previously known Ly emitters as well as absorbers. A lower velocity limit of km s-1 was required so that the Ly line could easily be differentiated from the bright geocoronal Ly line in any spectroscopic observations. The sample was observed during 30 orbits in Cycle 11. The observations were obtained with the F122M filter for Ly online imaging and F140LP as a continuum filter.
The first results for two of the observed galaxies, ESO 350-IG38 and SBS 0335-052, were presented in Kunth et al. (2003). In that study, we subtracted the continuum by using the relative instrument sensitivities (PHOTFLAM values) of the two instrument configurations, using the continuum slope () obtained from IUE or GHRS data for the bright knots and assuming a flat continuum in all other regions. However, these assumptions are not sufficient to perform an accurate photometric analysis and allowed the authors only to obtain a qualitative picture of the Ly morphology.
In this paper we focus on the most nearby galaxy in the sample, the well known luminous blue compact galaxy ESO 338-IG04. For this galaxy, Wide Field and Planetary Camera 2 (WFPC2) images in numerous optical passbands and Space Telescope Imaging Spectrograph (STIS) spectroscopy are also available. Using these we develop methods for accurate continuum subtraction, allowing a quantitative analysis of the Ly emission and absorption.
1.1 Short facts about the target: ESO 338-IG04
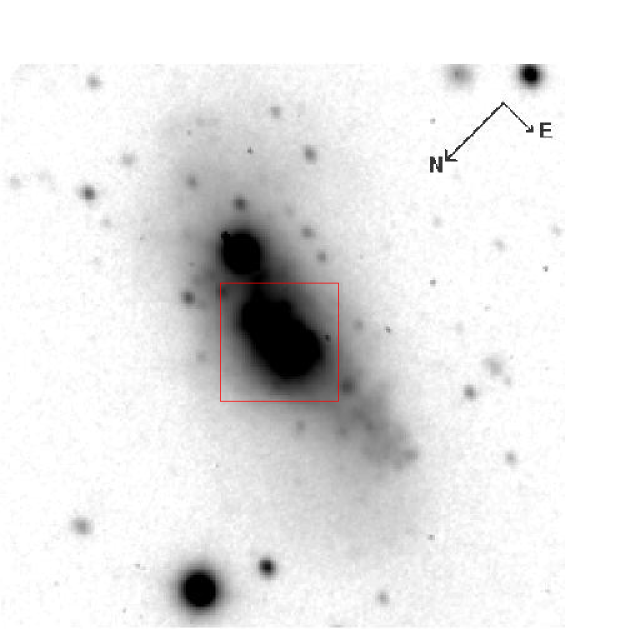
ESO 338-IG04 (Tololo 1924-416) is a well known luminous blue compact galaxy (BCG), in the local universe ( km s-1, Cannon et al, 2004) and can be seen in figure 1. The galaxy was first studied in detail by Bergvall (1985). The nebular oxygen abundance is (see Östlin et al. 2003).
Images obtained with HST’s Faint Object Camera (FOC) show that the centre of ESO 338-IG04 hosts a population of UV-bright star clusters, just like many other starbursts (Meurer et al. 1995). Subsequent WFPC2 observations have increased the number of known clusters to more than 100 and have shown them to span ages from just a few Myr to several Gyr (Östlin et al. 1998, 2003). The age distribution of the young clusters indicates that the present starburst was initiated 40 Myr ago. Spectroscopic observations from the International Ultraviolet Explorer (IUE) showed ESO 338-IG04 to be a bright Ly emitter with a UV continuum that has close to zero internal dust extinction (Giavalisco et al. 1996, Calzetti et al. 1994).
ESO 338-IG04 has a perturbed H velocity field (Östlin et al. 1999, 2001) and morphology (Bergvall and Östlin 2002) suggesting that the galaxy has been involved in a merger/strong interaction with a small galaxy. The presence of a companion galaxy (Östlin et al. 1999) and extended Hi emission between the two (Cannon et al. 2004) further supports this starburst triggering scenario. The galaxy is a true starburst in the sense that the time-scales for gas consumption and build-up of the observed stellar mass with the current SFR are both Gyr, i.e. much shorter than the age of the universe (Östlin et al. 2001).
The bright Ly line, the existence of HST data at other wavelengths and the small internal reddening made ESO 338-IG04 a perfect target for a Ly imaging study with ACS.
2 Data acquisition and basic reductions
2.1 ACS observations
The observations were obtained with the Solar Blind Channel (SBC) of the ACS under general observer (GO) program 9470, using two filters: F122M (Ly on-line) and F140LP (used as continuum filter). The ACS/SBC was the ideal instrument mode for these observations because its field of view is appropriate to encompass the galaxies comfortably and utilises a MAMA detector and is hence not susceptible to cosmic rays. The target galaxy was observed for 5 orbits, with the F122M images being obtained during the SHADOW part of the orbit in order to lower the geocoronal background. The remainder of the orbit was then used for the F140LP images. The geocoronal background is low in both filters but is almost always brighter than the signal in the online image from the target galaxies. The total integration times per galaxy in the F122M and F140LP filters were 9095 and 3000 seconds respectively. Observations in each filter were split into five separate exposures. The drizzled images produced by the standard pipeline have a rectified pixel scale of 0.025″ pix-1. These images were combined after coalignment, and the background in each filter was subtracted using a first degree polynomial surface. These images were then corrected for Galactic interstellar extinction using the Cardelli law (Cardelli et al. 1989). Values used were and =0.375 (Schlegel et al, 1998). The solid angle subtended by ESO 338-IG04 is so small that these values can be assumed over the entirety of the images.
2.2 Supporting HST observations
In addition to the ACS images we make use of images in the F218W, F336W, F439W, F555W and F814W filters obtained with the Planetary Camera (PC) aperture of the WFPC2 under GO program 6708. These observations have been used to study bright compact star clusters and are described in Östlin et al (1998, 2003). We use this images aligned and rebinned to the same orientation and scale as the ACS data. These images were also corrected for Galactic interstellar extinction at the central wavelengths of the filters.
A narrowband image of the [Oiii]λ4959Å emission line has been obtained with HST/STIS in GO program 8668 (Östlin et al. in prep). This observation takes advantage of the fortuitous redshift of ESO 338-IG04 where the 4959Å line is redshifted to 5007Å and can be imaged with the very narrow (FWHM = 5Å) STIS/F28X50Oiii filter centred on 5007Å.
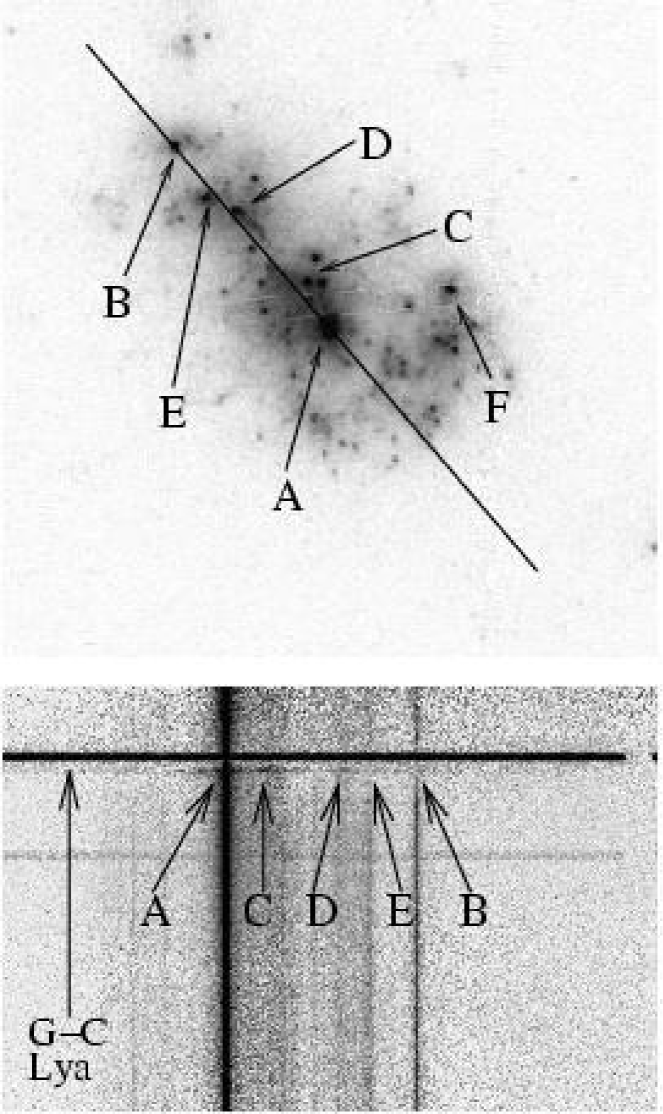
We also make use of a HST long-slit spectrum obtained with the Space Telescope Imaging Spectrograph (STIS) with the G140L grating and a 0.2″ wide slit, under GO program 9036. The slit was placed approximately along the major axis of the target as shown in figure 2.
3 Subtracting the continuum
We use the F140LP filter to subtract the continuum from F122M and produce a line-only Ly image. As with any continuum subtraction, the continuum image is used to estimate the flux due to continuum processes at the wavelength of the line. It is necessary to scale the continuum image to compute the continuum level at the the line. We define the Continuum Throughput Normalisation (CTN) factor as the ratio of flux in the F140LP to that in the F122M filter for a given spectral energy distribution (SED). Hence with no Ly feature in emission or absorption:
where and are the fluxes in the F122M and F140LP filters respectively.
If one knows the instrument sensitivities in these filters and the SED between these wavelengths, the CTN factor can readily be computed. The simplest method to obtain a reasonable first order estimate of CTN factor is to assume the SED to be a power-law governed by the index such that . Kunth et al. (2004) used such an assumption to make Ly continuum subtractions for the first two galaxies in the sample, ESO 350-IG38 and SBS 0335-053. There we used available IUE spectra and WFPC2 V-band images to estimate global values of and used these values to subtract the continuum in the regions dominated by bright clusters. Assuming standard calibration and a flat continuum , the CTN is simply the ratio of the PHOTFLAM keywords of the off- and online instrument configurations: 10.33. This value was then used to subtract the continuum in the remaining (non star-cluster) regions. As a first approximation, this method provides a reasonable map of Ly emission and absorption and enabled the authors to discuss the kinematics of the line. It is, however, highly dependent upon the validity of the assumptions and doesn’t allow any accurate photometric study to be performed. Furthermore this method doesn’t properly allow for spatial variation in the slope of the continuum – a quantity that is highly sensitive to local variations in burst age and internal dust reddening.
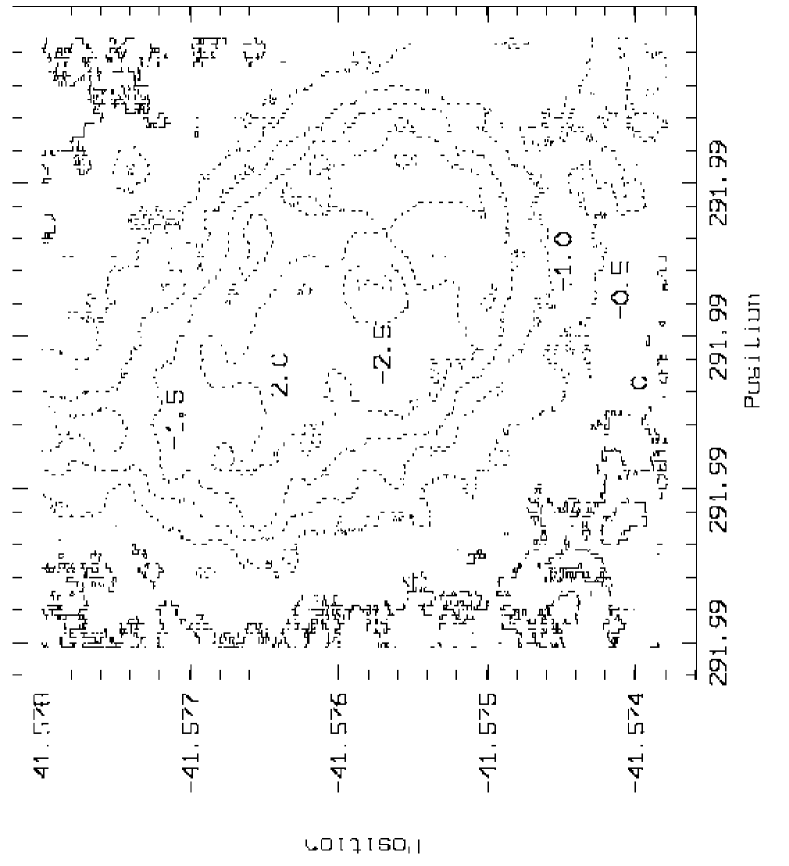
For ESO 338-IG04, the UV continuum slope was mapped by using the ACS/F140LP image and a variety of WFPC2 images at longer wavelength. A resulting -map, constructed using the F218W filter can be seen in figure 3. As the map shows, reaches a minimum of -3 in the central bright star cluster, indicating a steep continuum dominated by O and B stars. increases to values of away from the starburst region, i.e. an approximately flat continuum.
Using such a map of the continuum slope to subtract the continuum assumes that the UV continuum between 1527Å and Ly remains an unbroken power law. Preliminary continuum subtractions using this technique showed strong Ly absorption throughout the regions of bright continuum. This is contradictory to the STIS spectra extracted from these regions which show Ly in emission and is indicative of the fact that this technique causes the subtraction of too much continuum. This discrepancy can be attributed to a number of effects: Firstly, examination of the IUE spectrum suggests that the continuum slope deviates from the power-law, flattening out at wavelengths shortward of Å; secondly, the presence of discrete stellar Ly absorption features may also serve to reduce the total Ly output from a region. Often most importantly, inspection of the STIS spectra shows that Galactic absorption of Ly is significant in the regions where the continuum is strong, causing a significant reduction of the flux in the online filter. While the assumption of a power-law continuum may be sound redwards of Ly, it fails to address any effects that may arise as a result of Galactic Hi and some technique that accounts for this is essential.
3.1 Synthetic spectra
In order to tackle some of the issues raised above, we began to explore the properties of the Starburst99 synthetic spectral models (Leitherer er al, 1999). These models were selected because they use the most appropriate UV stellar atmospheres and cover a large parameter space enabling us to test how different model parameters may affect our final results. The possibility also exists to run one’s own simulations, based upon exact requirements and to interface with the Mappings code (Kewley et al. in prep) for the inclusion of nebular emission lines. The initial model set selected included stellar and nebular emission for an instantaneous burst of metallicity and Salpeter IMF. The metallicity of ESO 338-IG04 is known to be around 10% solar (Bergvall 1984; Masegosa et al, 1994) so the lowest available metallicity was chosen. Östlin et al (2003) showed that a Salpeter IMF extending up to was the best fit to their data on this galaxy. The effects of varying these parameters are addressed in section 5. The models were used to investigate the CTN factor and optical colours with the effects of aging and dust reddening.
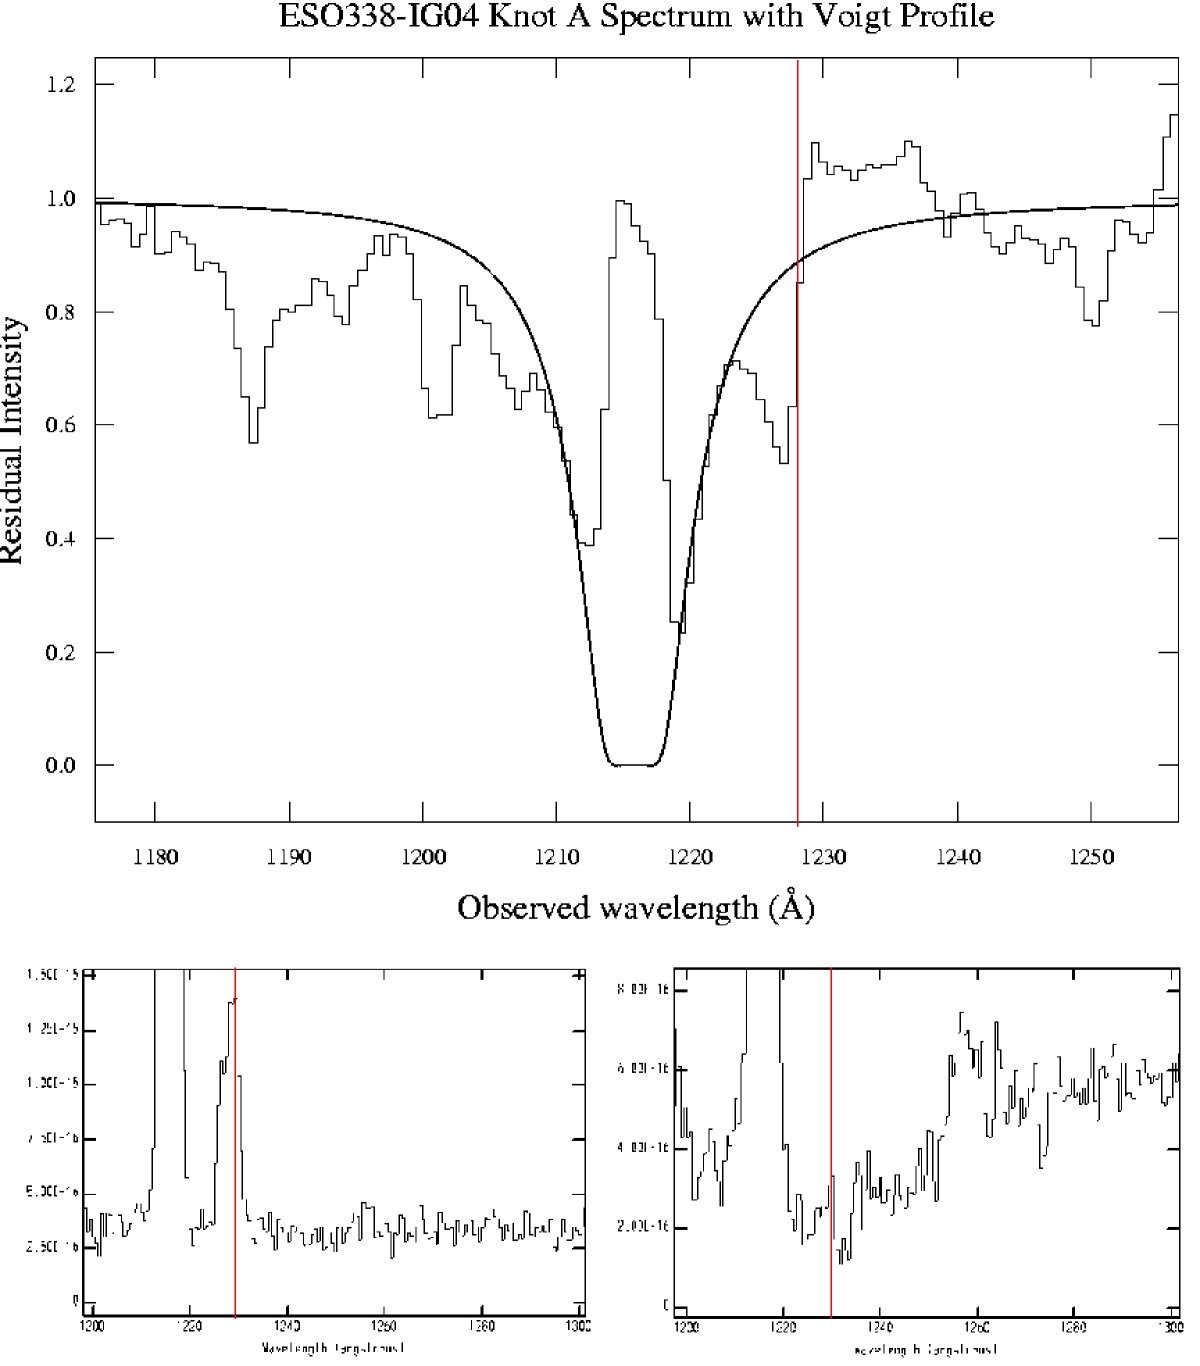
One feature that should be the same in all spectra is the Galactic Ly absorption which removes a fixed fraction of photons near 1216Å. Since ESO 338-IG04 covers little solid angle on the sky (less than half a square arcmin), we assume the column density of Galactic Hi along the sightline is constant over the face of the galaxy. A 1D STIS spectrum of the central star cluster (where signal-to-noise is highest) was extracted. Using the Xvoigt program (Mar & Bailey, 1995) we made a single-component fit of a Voigt profile to the wings of the Galactic absorption profile. This yielded a Galactic Hi column density of log(N(Hi) = 20.7 , in tight agreement with the value of log(N(Hi)) = 20.8 from Galactic Hi maps of Dickey & Lockman (1990). This normalised Voigt profile was then used to apply the Galactic Ly absorption profile to the synthetic spectra by simple convolution. A fit of the Voigt profile to the wings of the absorption profile can be seen in the upper panel of figure 4.
Galactic interstellar reddening also has the same affect on any spectrum since reddening simply removes a fraction of the flux at a given wavelength. The Galactic extinction law of Cardelli et al (1989) was used with the parameters of and (taken from the values quoted in NED, calculated from Schlegel, 1998) to redden all the spectra.
Our investigation was mainly concerned with how age and internal reddening affect the CTN factor and broadband UV/optical colours when computed from synthetic spectra. We obtained the instrument throughput sensitivity profiles for all of our instrument configurations from the synphot package in the iraf/stsdas. This allowed us to compute synthetic fluxes from the spectra in all of our passbands by simple integration of the spectrum convolved with the instrument sensitivity profile. Conversion to the Vega magnitude system was performed using the quoted zeropoint offsets. Since emission lines are not included in the spectra (no Ly), the CTN factor can readily be computed as the ratio of the synthetic flux in the offline filter to that in Ly filter (see the equation).
While the calculation of the CTN factor from a spectrum may be computationally trivial, knowing exactly which spectrum to use (i.e. which age and internal reddening) is far more complex. The region of interest is a bright, young region of intense star formation where the age of young clusters ranges from 1 to Myr (Östlin et al, 2003). Studies of the central starburst region using the Balmer emission line decrement (eg Bergvall 1985, Raimann et al. 2000) and the UV continuum (Calzetti et al. 1994, Meurer et al. 1995, Buat et al 2002) show the internal reddening to be very low: . Furthermore, groundbased longslit spectroscopy measuring H/H (Östlin et al, 2003) determined everywhere along the slit (aligned in the east-west direction).
Due to the well-known degeneracy in the effects of age and reddening, it is not possible to derive a non-degenerate relationship between a single colour (eg. or ) and the CTN factor. Instead we began to look for a possible relationship between CTN factor and pairs of colours. Our goal was to establish a non-degenerate relationship between CTN factor and any pair of colours obtained from the SED, irrespective of the age of the starburst and the internal dust reddening. The procedure we implemented was as follows:
-
1.
Begin with the full age range (1 to 900 Myr) of Starburst99 spectra with Galactic reddening and Hi absorption profiles applied.
-
2.
Redden each spectrum using the SMC law (Prévot et al., 1984). Values of internal colour excess were in the range 0 to 0.4 in steps of 0.003 mag; extending beyond the maximum observed reddening of 0.2 mag.
-
3.
For each spectrum (many ages, many internal reddenings), convolve with all instrument throughput profiles and integrate to obtain synthetic fluxes. From these, compute CTN factors and colours (convert to Vega magnitude system).
-
4.
Linearly interpolate extra points for CTN factor and colour in between the jumps in age.
This procedure resulted in a large table of values: a CTN factor and all UV/optical colours for every step in for every age. To look for relationships between the colours and CTN factors, we produced a series of colour-colour plots. For each possible age and reddening, a point was plotted in colour-colour space where the CTN factor was represented by the colour of the point. One plot was produced for every possible combination of HST colours. Each plot was studied to look for a combination of colours that corresponded to a single, non-degenerate value of the CTN factor. Two such diagrams are shown in figure 5.
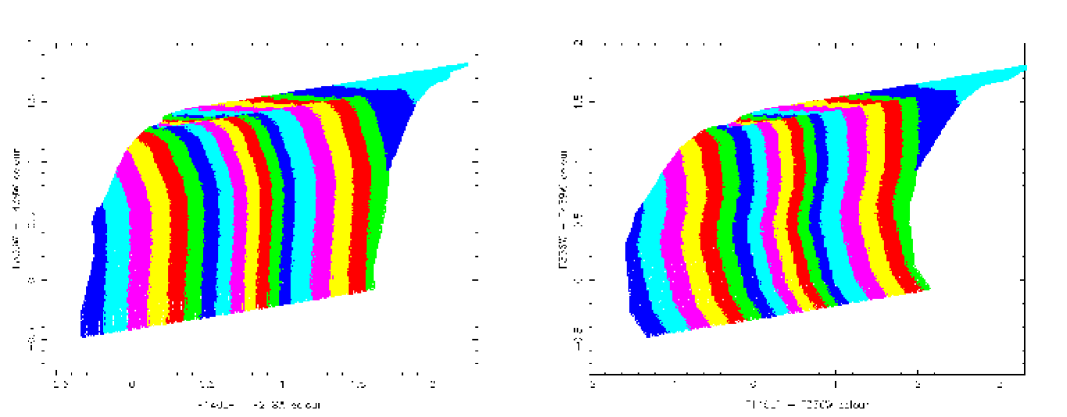
It can be seen in figure 5 that for these combinations of colours, if the ordinate and abscissa are known, they can be used to find a single, non-degenerate value of the CTN factor. The F140LP-F336W vs. F336W-F439W combination was then chosen to produce a CTN factor map. While producing nice-looking plots, any set-ups involving the WFPC2/F218W filter were not chosen due to poor S/N in this image. In areas of low S/N, the chosen images were smoothed using a pixel box average filter. For each pixel in the aligned images, F140LP-F336W and F336W-F439W colours were calculated. These colours were converted to a CTN factor and written back to the corresponding pixel of a new image. This CTN factor map was then used to create the desired Ly line-only image.
4 Results
The first CTN-factor map and the continuum subtracted Ly image can be seen in figure 6. The green regions surrounding the starburst show the CTN factor to fall in the range 10.0 to 10.5. This is consistent with the flat continuum slope which can also be seen in figure 3 where is shown to fall in the range -0.5 to 0.0. In the centre the CTN factor falls to the minimum value permitted by the models: 7.2 (1Myr, unreddened burst).
The first continuum subtracted Ly image, in the right panel of fig 6 shows excellent qualitative agreement with features in the spectrum. Most notably:
- •
-
•
Evidence for both emission and absorption can be seen in the regions immediately surrounding knot A. Bright emission and a small absorption hole appear in the continuum subtracted image. This is consistent with the P-Cygni profile, centred around 1228Å visible in figure 4.
-
•
Emission is seen from the regions around knots C and D (consistent with the STIS spectrum). The lack of emission from these regions was one of the serious inadequacies of the -map technique.
- •
-
•
Although this is not covered by the STIS spectrum, diffuse emission is detected from large regions outside the central starburst.
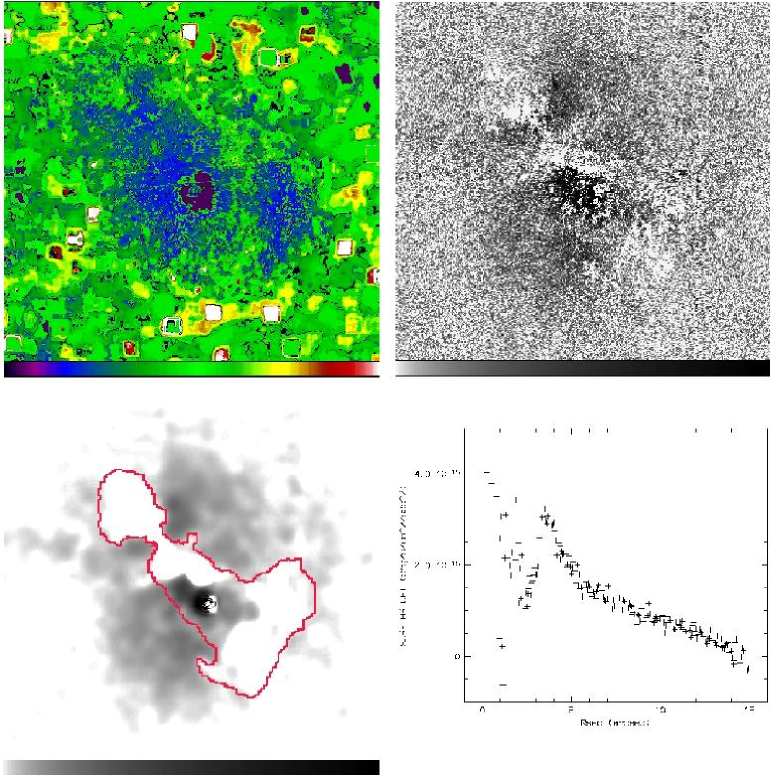
Quantitative photometry was performed on the continuum subtracted Ly image and a total Ly flux erg s-1 cm-2 was obtained. This is the sum of all the flux within a radius of 15″, at which distance the Ly surface brightness falls to zero. Ly images were then masked with a 10 20 ″ elliptical mask, centred on the central star cluster (knot A). This corresponds to the size and shape of the aperture of the IUE satellite, from which the integrated Ly flux and equivalent width of ESO 338-IG04 was presented in Giavalisco et al. (1996). These authors claim a Ly flux of erg s-1 cm-2. Analysis of our continuum subtracted Ly image reveals a Ly flux of erg s-1 cm-2, perfectly consistent, considering the accuracy of the IUE. At a distance of 37Mpc, this corresponds to Ly luminosity L erg s-1.
The surface brightness profile of the Ly emission line can be seen in figure 6. This profile was created by integrating the flux outwards from the central star cluster in concentric circles.
Using the CTN map, the F140LP image was renormalised to the continuum level at Ly, and used together with the online image to create an equivalent width map. This map can be seen in the left panel of figure 7. Using the same IUE aperture mask as before, the equivalent width of Ly in this aperture was calculated as 22.6Å. This again corresponds very closely to the value of 26.2Å presented in Giavalisco et al (1996). The equivalent width exceeds 200Å in the diffuse emission regions where there is little continuum.
The equivalent widths were investigated in detail in some of the absorption regions. Absorption equivalent widths in some regions around the brightest star clusters are as low as -65Å, indicating that the Hi absorption absorption in these regions is damped.
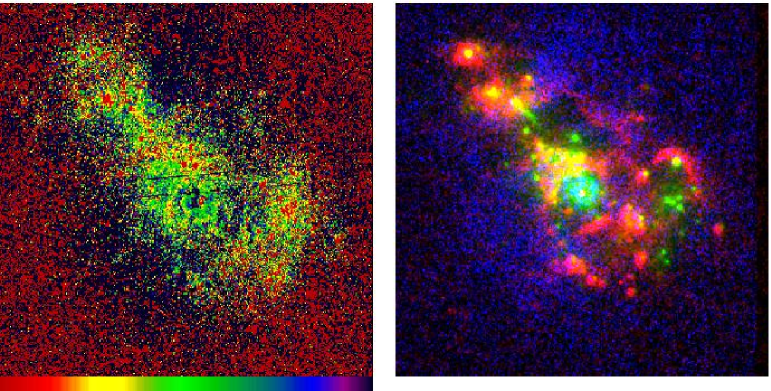
The RGB composite shown in figure 7 is composed of the continuum subtracted Ly image created with the assumed parameters, the F140LP ACS image continuum image and the [Oiii] STIS image. Colour channels are: Red – [Oiii] ; Green – UV ; Blue – Ly. This is discussed in section 6.
5 Model dependencies and other considerations
The results presented above utilised a our assumed set of model spectra, based upon various parameters relating to the properties of the target galaxy. The Starburst99 spectra we used were created for very low metallicity and Salpeter IMF, with the additional assumption of the SMC law being made to redden the spectra in the procedure of mapping the CTN factor. Some parameters were chosen based upon various known facts about the target galaxy (eg the low metallicity and the IMF) and others were assumed based upon studies of similar galaxies (eg the SMC law for internal reddening). If we want to know to what extent our results can be trusted, it is important to know how the selection of individual model parameters may influence our studies.
Some parameters are easily tested by changing the set of model spectra. We used other Starburst99 synthetic spectra to investigate the effects of metallicity and IMF, simply by plugging a different set of models into our code. Similarly, changing the assumed law for internal reddening law was trivial to implement by making minor modifications to the software. We adopted the assumed set of model parameters (, Salpeter IMF, SMC law) as the “standard” set, to which we compared all our subsequent modifications. By changing one parameter at a time, we recomputed CTN maps and used them to create continuum subtractions. We compared the individual pixel values of the modified CTN maps to the pixels of the standard CTN map and performed the same quantitative photometry on the Ly line-only images as described in section 4. Masks isolating the central and diffuse regions were also created so that these components could be examined individually if necessary. The parameter space explored in this manner is listed in table 1.
| Red. law | Metallicity | IMF | IMF |
| SMC | 0.001 | -2.35 | 100 |
| LMC | 0.001 | -2.35 | 100 |
| Cardelli | 0.001 | -2.35 | 100 |
| Calzetti | 0.001 | -2.35 | 100 |
| SMC | 0.004 | -2.35 | 100 |
| SMC | 0.008 | -2.35 | 100 |
| SMC | 0.020 | -2.35 | 100 |
| SMC | 0.040 | -2.35 | 100 |
| SMC | 0.001 | -3.3 | 100 |
| SMC | 0.001 | -1.5 | 100 |
| SMC | 0.001 | -2.35 | 30 |
Notes: : , .
Other effects that were investigated include the effects of nebular emission lines, a different spatial distribution of the nebular emission with respect to the ionising continuum, continuous star formation, and the stellar Ly absorption feature.
It is important to note that, while changing model parameters may have a quantitative effect on the Ly flux and equivalent width, no noticeable differences could be seen by eye in the continuum subtracted Ly images. Morphologically, the images resemble one another.
5.1 Metallicity and IMF parameters
Table 1 shows metallicity and IMFs investigated. Examples of how these parameters affect individual pixels in the CTN map can be seen in the top two panels of figure 8. The value of each pixel in the “standard” map is represented by the abscissa of each point with the value of the pixel in the new CNT map, normalised by its standard value, is represented by the ordinate.
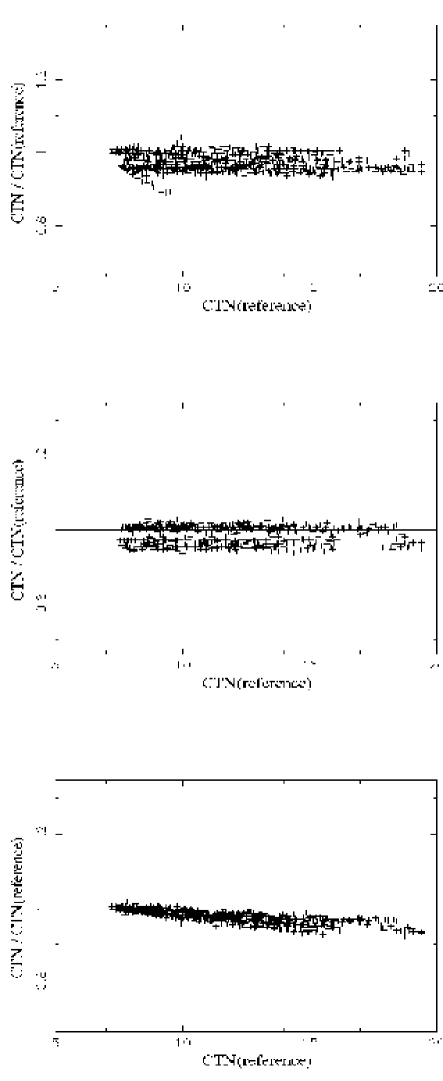
It can be seen from the top plot that increasing the metallicity from to (well above the measured value) introduces a slight downward trend in the CTN values. This effect was present for all metallicities shown in table 1. Increasing the metallicity to extreme values of produced similar plots but with the scatter in the ordinate increased. Selection of a metallicity of resulted in a decrease in the Ly flux to erg s-1 cm-2, a drop of 16%.
The centre plot in figure 8 shows the effect of steepening the index of the power-law governing the IMF to . The effect is very similar to that obtained by increasing the metallicity: a slight, systematic decrease of CTN. The same result was obtained when using the model set with . Both modifications to the IMF have similar effects on the CTN due to the fact that such modifications have similar effects on the massive stellar population: the relative fraction of massive stars is reduced, flattening the continuum in the UV. The use of a flatter IMF with had the opposite effect: the Ly flux increased over that obtained with our standard parameter set to 168 erg s-1 cm-2.
It can be seen that increasing metallicity and decreasing the relative number of hot young stars in the IMF have similar effects on the individual pixels in the CTN maps: a general, systematic decrease. This is an interesting result because one could naively assert that a process that flattens the continuum should lead to a increase in the CTN since the F140LP / F122M ratio will increase. However, as well as the CTN itself, metallicity and IMF also affect the optical/UV colours – particularly the F140LP-F336W colour which represents the slope of the UV continuum. A redder SED leads to an increased CTN but also to a higher value for the F140LP-F336W colour which serves to shift the points in the right panel of figure 5 to the right. Hence the colour obtained from the optical images may actually correspond to a lower CTN when the spectrum becomes flatter. It all depends upon whether the effect under consideration has a stronger impact on the CTN factor or the optical colours.
5.2 Extinction law
In the method described in section 3, we assumed the SMC law of Prévot et al. (1984) prevot for the internal reddening law. The reason being that in BCGs such as this, larger graphite molecules are destroyed by the ionising radiation, producing an extinction law without any bump at 2200Å, similar to that of the SMC (Mas-Hesse & Kunth, 1999). By the same method as for metallicity and IMF, we investigated how the choice of extinction law effects our study. The effect on the pixels in the CTN map of switching to the LMC law (Fitzpatric 1985) can be seen in the bottom panel of figure 8. The Galactic law of (Cardelli et al, 1989) and the Calzetti law (Calzetti, 1997) showed a similar downward trend in CTN but to a greater extent
The plot shows that, if the LMC law were applied instead of that of the SMC, the general trend would be to decrease the CTN factor at each pixel. The effect is more pronounced for larger CTN factors. Unlike in the cases of metallicity and IMF, this is what we would naively expect. The effect seen is attributed to the fact that the LMC law provides less extinction than the SMC at short wavelengths. This causes the spectra to which the LMC law was applied to have steeper UV continua than the same initial spectra reddened with the SMC law; the result is a lower CTN factor. This effect is also present in F140LP-F336W colour where the points are shifted towards the blue. The choice of extinction law has little impact on extinction at large wavelengths but varies by % at Ly. Hence, the choice of reddening law has a larger impact on the CTN than optical colours. In the Ly line-only image, the flux in the IUE aperture was erg s-1 cm-2 when using the LMC law. This decrease in Ly flux was also present when using the Cardelli law ( erg s-1 cm-2) and the Calzetti law ( erg s-1 cm-2).
5.3 The stellar Ly feature
There has been a long controversy over the importance of Ly absorption in stellar atmospheres pertaining to observations of Ly from nebulae; eg. Valls-Gabaud (1993), Charlot & Fall (1993). The synthetic starburst spectra comprise both stellar and nebular components with Ly emission from stars (as from galaxies) being subject to significant radiative transfer effects in the atmospheres. Atmospheres themselves are based upon empirical data that may include ISM absorption from the Milky Way in the spectra. Moreover there is a lack of data describing atmospheres of very low metallicity stars and there is not a single O star for which Ly can be observed due to the large ISM column. Depending on the wind properties, the Ly feature can be in absorption, a filled in P-Cygni profile or in emission. For the hottest stars, we expect net equivalent widths of only around a few Å (Klein & Castor, 1978). While the current status of stellar atmosphere models may be sound, atmospheres are still not developed enough to allow us to determine the contribution of the stellar Ly feature to overall Ly from galaxies.
Using the best currently available model spectra, we attempted to investigate the effects of this feature. We adopted the latest modification of the SED@ synthetic spectra (M. Cerviño, private communication) based upon stellar evolutionary synthesis models. The stellar input spectra for these models were built with the TLUSTY and SYNSPEC codes of Lanz & Hubeny (2003). These models predict Ly assuming a plane-parallel geometry, non-LTE, and full line-blanketing. The assumption of a plane-parallel geometry is often not appropriate for Ly, which can form above the photosphere in the expanding outer envelope. We expect the models to produce too strong Ly absorption, as the wind emission is neglected. Therefore the predicted stellar Ly absorption equivalent width represents an upper limit to the observations. The spectra included stellar and nebular continuum emission for instantaneous burst with Salpeter IMF and solar metallicity. The age range available was 1 to 10Myr. Without applying any internal reddening, Galactic reddening or Galactic absorption to the spectra, we computed the CTN factor for these spectra. The stellar Ly feature was then removed by interpolating linearly in between 1211 and 1221 Å and the CTN factor recomputed. We found that, at ages less than 10Myr, the removal of stellar Ly feature decreases the CTN by no more than 1.8%.
5.4 Stellar, nebular and emission line components
In our analysis (section 6) of the Ly line-only image, diffuse emission is seen from regions surrounding the starbursting knots. The continuum flux in these regions is low and the stellar population is clearly aged in comparison to the bright continuum sources. The H equivalent width map (Bergvall & Östlin 2002) shows equivalent widths in these regions of 300 to 400Å. This stellar population is not capable of providing such a high and the ionising photons most likely come from the massive young star clusters that inhabit the central regions.
The Starburst99 dataset offers a choice of stellar only, or stellar+nebular spectra which we used to subtract out the nebular only component. We then used the independent components to investigate the effects of varying their relative contributions. Such a study is of importance since the spectra are devised for zero-dimensional objects whereas in our images, the regions of strong nebular and ionising continua are clearly resolved. Boosting the nebular component has the effect of lowering the CTN because in the 1200-1500Å region (the region of the SED from which the CTN is computed) the nebular continuum is always flatter than the stellar. We found that to decrease the total Ly flux by 10%, we needed to boost the nebular continuum component by a factor of 20. Such a boost in the nebular contribution would have a dramatic effect on but the effect on the CTN remains small. When measuring the age in the diffuse Ly regions from our models (zero dimensional) for an instantaneous burst, we determine ages between 15 and 40Myr. Such ages correspond to in the range 17.5 to 0.6 Å in the same model set. Boosting the nebular component by a factor of 20 increases the measured = 17.5Å to 350 Å – consistent with the map. For ages found in these regions, the nebular continuum in the region where the CTN is computed is around three orders of magnitude smaller than the stellar component; hence boosting the nebular component by reasonably large factors makes little difference to the CTN. Varying the relative contribution of the components has no effect on the Ly map that is distinguishable by eye and has a negligible impact on the overall Ly flux.
The Starburst99 dataset also offer the option of continuous star-formation as opposed to the instantaneous burst that we had assumed initially. While we believe the instantaneous burst to be a good approximation in the region of the current starburst, this may not necessarily be so for the underlying population. The underlying population may contribute more strongly to the continuum in the regions from which we see diffuse Ly emission. The continuous star-formation model also maintains a high for a much longer period, (Å at ages Myr). Using the continuous star-formation model, we measured a Ly flux decrease in the aperture corresponding to that of the IUE from 134 to 120 erg s-1 cm-2. While it may fit the data rather well, we do not believe the continuous star-formation model on the grounds that clusters in these regions are no older than Myr (Östlin et al. 2002).
Where the starburst is young, nebular emission lines may strongly affect the luminosity of a galaxy in certain wavebands. Hence the optical colours may be determined by the presence of nebular emission lines, not simply the continuum as previously assumed. The WFPC2 images cover a large fraction of the optical domain. From a galaxy such as ESO 338-IG04 we can expect strong emission lines which may fall within our filters (eg. the F555W filter transmits the strong O[iii] line). Since the model spectra we used do not include nebular line emission, we investigated how our results may, or may not be influenced by the addition of lines to the spectra.
The Mappings III photoionisation code of Kewley et al (2004, in prep) was used to model nebular emission lines for a number of different burst ages via the Starburst99 interface. CTN factors and optical colours for all our filter possibilities were computed with and without the inclusion of nebular emission lines. The Ly line was not included since the definition of CTN requires its absence.
For a burst of 5Myr, the nebular emission lines did not affect the CTN by more than 1‰ or either of our selected colours by more than 0.05 mag. Nebular line emission was therefore not considered important for the study of this galaxy with the data that we have available.
5.5 Possible departure from a single stellar population
We also examined how sensitive the results are to the assumption of a single stellar population. Our concern originated from the possibility that the underlying stellar population may contaminate the optical colours of the pure starburst. We assumed that the old population may contribute 10% of the flux in the B-band and used the 900Myr Starburst99 spectrum as a template for this old population. For each age, we computed a new spectrum comprising the standard spectrum for that age, plus that of the old population normalised to 10% of the flux of the standard spectrum at 4000Å. Again this modification produced a Ly line-only image that was visually indistinguishable from that produced with the standard model parameters. In the IUE aperture, this modification produced a Ly flux of 122 erg s-1 cm-2; a decrease of 9%.
Due to the very low UV flux of the old population, it has no discernible effect on the CTN and acts only to redden the computed optical colours. The effect was most noticeable for young ages in the F336W-F439W colour where it amounted to an increase of mag for a 1Myr unreddened burst. The effect of the underlying population was considered not to be an issue in the analysis of ESO 338-IG04.
6 Analysis and Discussion
The two-colour technique described in section 3.1 proves an excellent method of subtracting the continuum from the line in our ACS imaging survey. Disentangling the degenerate effects of age and reddening relies upon the sampling of the continuum slope in critical regions. In our technique we use one colour that is very sensitive to the reddening (F140LP-F336W, sampling the UV continuum slope ) and one colour that is sensitive to age (F336W-F439W, sampling the 4000Å discontinuity). Not only does the qualitative comparison of the continuum subtracted image compare very well with the STIS spectra along the slit, but quantitative photometric results compare well with previous values of the Ly flux and equivalent width.
In addition, an important point is that our results are not highly model dependent. Qualitatively, the line-only Ly images were indistinguishable from one another; each showing the same features of absorption and emission and each showing the diffuse emission regions. Moreover, when comparing fluxes, all were in agreement to better than 50%, even when parameter space well outside of the known constraints was investigated (eg, IMF = -3.3 or twice solar metallicity).
ESO 338-IG04 is a well studied galaxy and this data can be compared with a wide array of other studies, against which our results can be tested.
6.1 The Ly emission
The false-colour map, (figure 7) shows how Ly, UV continuum and [Oiii] compare spatially. [Oiii] emission can be used to gain insight into hardness of the ionising flux since it maps twice ionised oxygen.
There are several noteworthy features in this image. The hot young star clusters, very bright in the UV continuum appear as the bright green blobs. These are the regions where the continuum flux is high and the slope is steep due to the young stellar population. This is the reason why so many of the star clusters appear in green. All of the regions surrounding the green and yellow star clusters show [Oiii] emission to some degree. Here the UV flux from the cluster is still strong enough to twice ionise oxygen at large distances from the UV signature of the cluster. This effect can be seen very strongly around knots B and F.
Knot A is another interesting case. Nearly the whole region around knot A shows up in either cyan or green, indicating, not only a strong UV continuum but also a positive flux of Ly. This is consistent with the STIS spectrum of this knot. Ly escape from this region due to the cluster driving an outflow of the local neutral ISM, giving rise to the P Cygni profile that can be seen around 1228Å in figure 4. In the spectrum, Ly can be seen in absorption and emission, bluewards and redwards of 1228Å respectively. Just to the west of knot A, the cyan (Ly and UV) becomes yellow (UV and O[iii]) as the Ly flux falls off but oxygen is still twice ionised.
Diffuse emission regions are very evident surrounding the starburst regions. In these regions the continuum flux is very low and Ly equivalent widths exceed 200Å. We explain this find as Ly photons that escape the Hi region either by diffusing to a region where the optical depth to infinity is less than unity or by scattering into the wing of the emissivity profile. These diffuse emission regions are of great importance for the overall line luminosity. As can be seen from the surface brightness profile, these regions dominate the luminosity output and the scattering mechanism is responsible for the majority of the Ly escape.
Analysis of the strong absorbing regions shows the Ly equivalent width to be around -65Å, indicating damped absorption due to a static covering of neutral hydrogen. This value for the equivalent width in absorption compares well with estimates of equivalent widths of Ly absorption in other BCGs. Cursory inspection the GHRS spectra of SBS 0335-052 presented in Thuan & Izotov (1997) and of I Zw 18 presented in Kunth et al (1994) show Ly equivalent widths of Å and Å respectively.
6.2 Ly correlations with other properties
Östlin et al. ostlin03 (2003) mapped the age of the star clusters in this galaxy, the youngest having ages Myr. These are the regions from which we expect Ly to be trapped if the local ISM is not configured so as to allow its escape. Towards the west of the galaxy, this age map shows many massive, very young clusters which coincide exactly with the absorption from knots E, B and the surrounding regions. Other young clusters are marked in Östlin et al. to the south and south-east of the central cluster. These also appear as absorption features in our continuum subtraction.
We compared the current results with the results from Östlin et al. on the age distribution of compact star clusters. We selected the young ( Myr) sub-population and looked for systematic relationships between their properties (age, photometric mass, luminosity, colour, radial distance from the centre) and the local Ly emission or absorption fluxes and equivalent widths. We note that we are comparing regions which are coincident on the 2D projected image, and that are not necessarily spatially coincident in 3 dimensions.
Tenorio-Tagle et al (1999) and Mas-Hesse et al (2003) suggested that Ly emission from starburst is expected to be a function of evolutionary and geometrical effects. In this model, pure or P-Cygni Ly emission can be expected only if we are looking into the ionised cone. No Ly should be expected along lateral sightlines that view the surrounding Hi. We find no correlation between the Ly escape/absorption or equivalent width and age of the comparison cluster. Hence we are not currently finding any support for the evolutionary model. We stress, however, that Ly escape is convolution of many parameters, not simply cluster age, and geometry may provide the scatter that masks the trend.
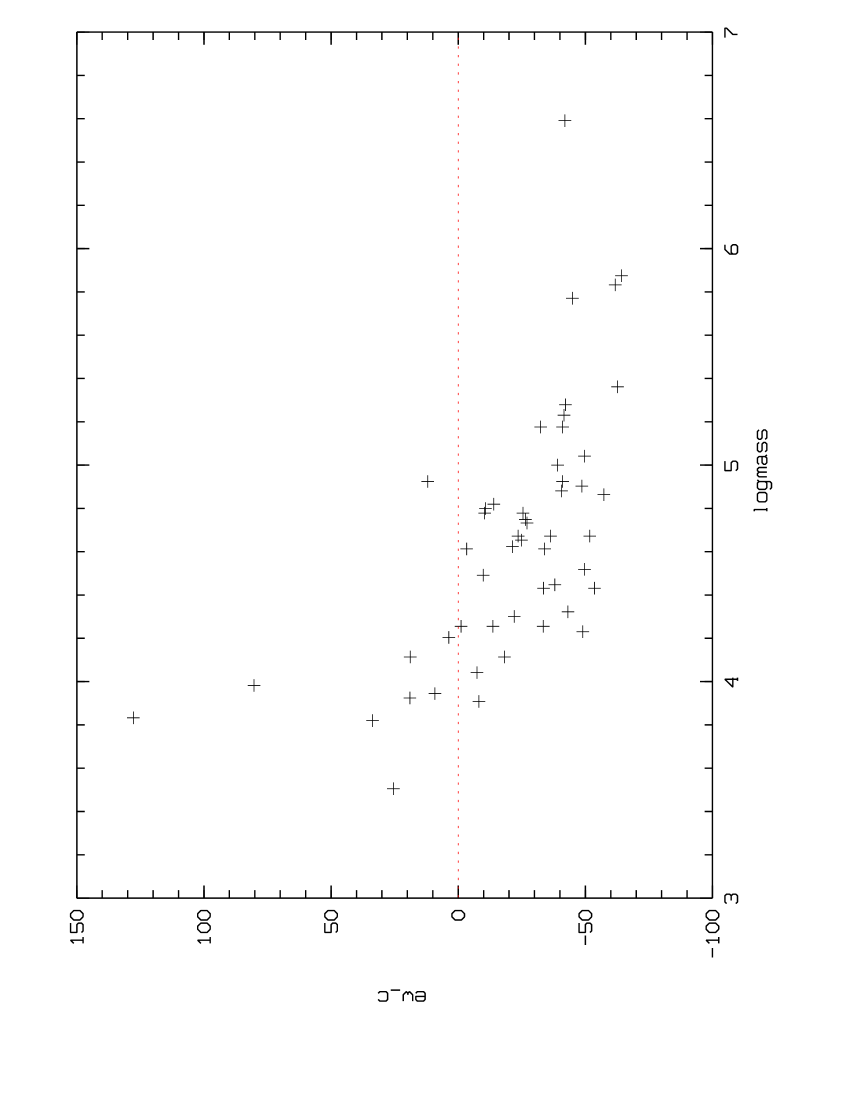
The only clear trend is seen when comparing equivalent width and luminosity or mass: the more luminous (or massive) the cluster, the smaller the EW is on average (and in fact it is predominantly negative), see figure 9. This serves to reinforce the find that Ly escape is not regulated by the output UV luminosity from the cluster. This trend is expected if one assumes that the more massive clusters are associated with more gas, hence a larger neutral hydrogen column density.
6.3 Ly and other kinematical tracers
The ionised gas kinematics of this galaxy have been explored through Fabry-Perot interferometry, described in Östlin et al. (1999, 2001). This study revealed a complex and perturbed, almost chaotic velocity field. Photometric studies have shown the tail to the eastern side to contain a distinctly different stellar population from the rest. The authors explained this as the result of a merger which was the triggering mechanism for the current starburst. The merger may be responsible for triggering the starburst, producing the Ly photons and is also responsible for the irregular ISM kinematics that allow these locally produced photons to leave the galaxy. One striking result of this study was the discovery that in the region of diffuse Ly emission north of knot A, the ionised gas is redshifted with respect to the stellar population. Regions south of knot A are similarly blueshifted. This could either point to a a bipolar outflow of the ISM or the presence of a second kinematical component with a centre very close to knot A and kinematic axis in the north-south direction. This axis has the same orientation as the one we find for diffuse Ly emission.
A UVES spectrum of knot A discussed in Östlin et al. (2005 in prep) shows that the ionised gas around this knot has at least two components: one which is redshifted by 25 km s-1 and one blueshifted by 40 km s-1. In addition, Nai D absorption lines which probably probe the neutral ISM, are blueshifted by 20 km s-1 compared with the stellar component. This suggests that gas is flowing towards us along the line of sight and is consistent with the P-Cygni interpretation of the Ly emission around knot A. South of knot A the UVES spectrum reveals an ionised component blueshifted relative to knot A but also components redshifted by 100 to 200km s-1, showing the complex nature of the medium.
The VLA Hi mapping of ESO 338-IG04 and its companion also suggests a recent strong interaction between the two galaxies (Cannon et al 2004). Although the Hi map has a much lower resolution than the ACS images, it is suggestive that the regions with strong diffuse Ly emission north and south of knot A coincide with a region where the Hi column density is smaller (N(Hi) cm-2) than elsewhere in the galaxy. The other strong diffuse Ly region to the west of knot A has N(Hi) cm-2. In the region near knot A, although we stress again that the resolution makes a comparison with a point source even more uncertain, the column density is N(Hi) cm-2.
All these column densities would be high enough to produce damped absorption of Ly; something we do see in parts of the central starburst, despite its extremely low dust content. That any emission at all comes from the central UV-bright knots must be attributed to a clumpy ISM and to velocity shifts of neutral gas relative to the photon producing regions. Note however that velocity shifts of Hi (as well as H discussed above) over the galaxy are relatively small.
Synthesis of these kinematical tracers leaves an incomplete picture. The Fabry-Perot and UVES spectra hint that in the regions of diffuse Ly emission, the ISM may be subject to a rather slow large-scale outflow of gas (and hence allowing the escape of Ly photons) but also reveal a highly perturbed medium. Conversely, the Hi data shows the neutral ISM to be subject only to very small velocity shifts over the whole galaxy (although the resolution is much poorer than the scales explored here), indicating the diffuse Ly emission may be the result of a clumpy medium, perturbed on a much smaller scale.
6.4 The diffuse emission
It has been shown in section 5 that our results are not highly dependent upon the model parameters chosen. One striking result of the photometric study was that over 70% of the total Ly originates from the diffuse emission regions.
Our unreddened Ly flux in the IUE aperture amounts to erg s-1 cm-2. However, this comprises a combination of positive and negative contributions and the net contribution from the central burst region is negative. We can divide the total Ly flux into 3 spatial components: central regions with positive Ly flux, central regions with negative Ly flux, and the region outside, i.e. where we see diffuse emission:
| Region | Sum of flux | EW |
| ( erg s-1 cm-2) | (Å) | |
| Centre positive | 93 | 47 |
| Centre negative | -163 | -78 |
| Centre total | -70 | -17 |
| Diffuse | 204 | 113 |
| Total | 134 | 22.6 |
Notes:
Values in this table refer only to fluxes in the IUE aperture.
Had it not been for the positive diffuse emission, this galaxy would not have any Ly detected by the IUE satellite.
We compare these numbers with the H flux, obtained from ground based narrowband imaging (Bergvall & Östlin). Of the total H flux ( erg s-1 cm-2, Östlin et al. 2001, Gil de Paz et al. 2003), 87% comes from the region covered by our Ly observations. Of the H flux in this region approximately 35% comes from the diffuse region and the rest from the central regions. The uncertainty on these quantities is about 5% and arises due to the very different spatial resolution of the HST/Ly and the ground based H images. Of course we do not have the resolution to differentiate the H flux of the regions showing positive and negative Ly flux.
Correcting for Galactic extinction, Ly/H for the diffuse region. The Ly photons in this region could either be locally produced by ionising flux from the central burst (as there are no UV-bright sources in the diffuse region, see Östlin et al. 2003), or be due to Ly photons diffusing out from the centre after multiple scatterings. The former alternative appears more realistic since we see H, which is not subject to multiple scattering, in the diffuse region and moreover, the Hi column density in the diffuse region is high and with little velocity difference with respect to the central burst (Cannon et al. 2004). If we assume that the internal reddening in the diffuse region is similar to that in the centre (, see also Östlin et al. 2003) and assume the SMC reddening law, this would lead to a corrected Ly/H ratio of 6.6, or about half the value predicted from case A recombination. To reconcile these numbers, either we have to assume that the internal reddening in the diffuse region is a factor of higher than in the centre, or that each Ly photon has suffered, on average, additional scatterings whereby the total Ly intensity has been reduced by the 2-photon process. The latter appears very reasonable given the large neutral hydrogen column density. Hence, the diffuse emission is best explained by ultraviolet photons escaping the central burst through a porous medium and ionising hydrogen in the diffuse regions, after which Ly photons are scattered a few times before escaping.
In the central region, the absorption dominates over emission. The predicted equivalent width of Ly disregarding any absorption processes, is on the order of 200 Å, whereas damped absorption may lead to negative values Å. Hence, to create a net absorption more than 80% of the photons with wavelength near Å have to be absorbed by static (or nearly static) neutral hydrogen. That we see any pixels with positive Ly must be attributed to the porosity of the ISM and local velocity differences between the ionised gas and neutral medium in front of it along the line of sight. Looking at the central H flux and attenuating it by Galactic reddening and an additional internal reddening of using the SMC law, we would expect to see a flux of approximately erg s-1 cm-2 if Hi absorption was neglected. The central Ly photons that do reach us amount to erg s-1 cm-2, or about 9%. Hence, this is consistent with more than % of the photons being destroyed. The pixel scale of ACS/SBC corresponds to a linear projected scale of 5pc at the distance of 37 Mpc. Possibly the number of positive central Ly photons would be higher with even better spatial resolution.
Taking the H flux from the area corresponding to the ACS images, we corrected this flux for Milky Way reddening and for internal reddening using the SMC law with . Assuming case A recombination, we computed the total Ly flux produced to be erg s-1 cm-2. By comparing this value to the detected Ly flux (corrected for Galactic extinction) of erg s-1 cm-2 we obtain an escape fraction of 5%. This escape fraction is an order of magnitude lower than what one would derive (44%) by assuming internal reddening only.
6.5 Implications for high-z surveys
Our technique of performing a continuum subtraction is dependent upon careful modeling of the SED. We notice that the region of the SED imaged by our offline filter (central wavelength: 1400Å; rectangular width: 250Å) corresponds almost exactly to the region of the SED of a galaxy a redshift of around 4, imaged by a broadband Johnson R filter. Malhotra & Rhoads (2002) used just this broadband filter to subtract continuum from their sample of galaxies in the redshift range 4.37 to 4.57 using a variety of online narrowband filters. Hence, their continuum filter maps a very similar part of the restframe SED to ours. The Ly galaxies in their sample were found to have higher than expected equivalent widths with a median value of 400 Å. It is therefore interesting to point out that, when we assumed a flat continuum we derived a Ly flux for ESO 338-IG04 of 430 erg s-1 cm-2 and equivalent width of 72Å– over 3 times higher than the values obtained through SED modeling. Making naive assumptions about the continuum slope caused us to vastly overestimate the Ly equivalent width. To perform accurate high- surveys, we suggest it may be necessary to at least employ more offline filters so as to accurately model the continuum.
7 Conclusions
We have presented high resolution Ly imaging of the local starburst galaxy ESO 338-IG04 based on observations with the HST and the solar blind channel of ACS, complemented by available WFPC2 data. We show that a careful continuum subtraction is crucial and have demonstrated that we have a technique in place to subtract the continuum provided the necessary supporting data is available. In our analysis of Starburst99 synthetic spectra, we were able to disentangle the effects of age and internal reddening by carefully modeling the evolution of the UV continuum slope and 4000Å discontinuity. We present a total Ly line flux of erg s-1 cm-2 and demonstrate the photometric validity of our technique by comparison with STIS spectroscopy and the IUE data presented in Giavalisco et al.(1996). Our Ly flux of erg s-1 cm-2 matches that obtained with the IUE satellite of erg s-1 cm-2. Within the errors associated with the IUE, these values are in perfect agreement. We also find a total Ly equivalent width of 22.6Å, again in agreement with the value obtained with the IUE. We find extensive evidence for resonant photon scattering of Ly in diffuse Ly emission regions that surround the central starburst. These regions dominate the total output luminosity of the line and equivalent widths in here exceed 200Å. If it would not have been for the diffuse emission, this galaxy would not had been seen as a net emitter of Ly e.g. in IUE spectra. By comparison of the Ly and H fluxes in these regions, we calculate that each detected Ly photon has suffered 2 additional scatterings, reducing the net Ly emission via two-photon emission. We estimate that of all the Ly photons produced, only 5% leave the galaxy. We find that the Ly line traces the kinematics and perturbed morphology of ESO 338-IG04, correlating closely with other tracers of kinematics. In all, this galaxy provides an excellent laboratory for studying the physics of Ly emission, displaying a variety of mechanisms: emission through P-Cygni features from the central knot (A), damped absorption, leakage of central Ly photons through paths with small optical depth, and diffuse emission. While our technique is entirely reliant upon the use of synthetic spectra, it is not highly dependent upon the choice of parameters (metallicity, IMF, etc.) nor on the choice of internal reddening law. We discuss the implications for the understanding of Ly escape from galaxies and the nature of Ly emitters at high redshifts, and find that if careful attention is not paid to the slope of the continuum, then fluxes and equivalent widths may be overestimated by a factors of .
Acknowledgements.
MH and GÖ acknowledge the support of the Swedish National Space Board (SNSB) and the Swedish Research Council (VR). JMMH was supported by Spanish MEC under grants AYA2001-3939-C03-02 and AYA2004-08260-C03-03. We thank M. Cerviño for his help with the high resolution continuum models and J. M. Cannon & E. D. Skillman for their contribution to this study. This work was supported by HST grant GO-9470 from the Space Telescope Science Institute, which is operated by the Association of Universities for Research in Astronomy, Inc., under NASA contract NAS5-26555.References
- (1) Bergvall N., 1985, A&A, 146, 269
- (2) Bergvall N., Östlin G., 2002, A&A, 390, 891
- (3) Buat V., Burgarella D., Deharveng J. M., Kunth D. 2002, A&A, 393, 33B
- (4) Charlot, S., & Fall, S. M., 1993, ApJ, 415, 580
- (5) Cannon D., Skillman E., Kunth D., et al. 2004, ApJ, 608, 768
- (6) Calzetti D., Kinney A.L., Storchi-Bergmann T., 1994, ApJ, 429, 582
- (7) Calzetti D., 1997, AJ, 113, 162
- (8) Cardelli J.A., Clayton G.C., & Mathis J.S., 1989, ApJ, 345, 245
- (9) Dickey & Lockman, 1990, ARAA. 28, p215.
- (10) Frye B., Broadhurst T., & Benítez, N. 2002, ApJ, 568, 558
- (11) Fujita S. S., Ajiki M., Shioya Y., et al. 2003, AJ, 125, 13
- (12) Fynbo J. U., Möller P., & Thomsen B., 2001, A&A, 374, 443
- (13) Giavalisco, M., Koratkar, A., & Calzetti, D., 1996, ApJ, 466, 831
- (14) Gil de Paz A., Madore B. F., & Pevunova O., 2003, ApJS, 147, 29
- (15) Haiman, Z., & Spaans, M., 1999, ApJ, 518, 138
- (16) Hu, E. M., Cowie, L. L., & McMahon, R. G., 1998, ApJ, 502, L99
- (17) Kewley L. J., Dopita M. A., Evans I., et al., 2004, in prep
- (18) Klein R. I., & Castor J. I., 1978, ApJ, 220, 902
- (19) Kunth D., Lequeux L., Sargent W. L. W., & Vaillefond F., 1994, A&A, 282, 709
- (20) Kunth D., Mas-Hesse J. M., Terlevich E., et al., 1998, A&A, 334, 11
- (21) Kunth D., Leitherer C., Mas-Hesse J. M., Östlin G., Petrosian A., 2003, ApJ, 597, 263
- (22) Lanz T., & Hubeny I., 2003, ApJS, 146, 417
- (23) Leitherer C., Schaerer D., Doldader J. D., et al., 1999, ApJS, 123, 3
- (24) Mar D. P., & Bailey G., 1995, PASA, 12, 239
- (25) Malhotra S., & Rhoads J. E. 2002, ApJ, 565, 71
- (26) Masegosa J., Moles M., & Campos-Aguilar A, 1994, ApJ, 420, 576
- (27) Mas-Hesse J.M., & Kunth D., 1999, A&A, 349, 765
- (28) Mas-Hesse J.M., Kunth D., Tenorio-Tagle G., et al., 2003, ApJ, 598, 858
- (29) Meurer G.R., Heckman T.M., Leitherer C., et al., 1995, AJ, 110, 2665
- (30) Neufeld D. A. 1991, ApJ, 370, L85
- (31) Östlin G., Bergvall N., & Rönnback J., 1998, A&A, 335, 85 (ÖBR98)
- (32) Östlin G., Amram P., Masegosa J., Bergvall N., Boulesteix J., 1999, A&AS, 137, 419
- (33) Östlin G., Amram P., Bergvall N., et al., 2001, A&A 374, 800
- (34) Östlin G., Zackrisson E., Bergvall N., Rönnback J., 2003, A&A, 408, 887
- (35) Ouchi M., Shimasaku Z., Furusawa H., et al. 2003, ApJ, 582, 60
- (36) Partridge R. B., & Peebles P. J. E. 1967, ApJ, 147, 868
- (37) Pavlovsky C., Biretta J., Boffi F., et al., 2002, ACS Instrument Handbook, Version 3.0, Baltimore: STScI
- (38) Prévot M. L., Lequeux J., Prévot L., Maurice E., Rocca-Volmerange B., 1984, A&A, 132, 389
- (39) Pritchet C. J. 1994, PASP, 106, 1052
- (40) Raimann D., Storchi-Bergmann T., Bica E., Melnick J., Schmitt H., 2000, MNRAS, 316, 559
- (41) Salpeter E. E., 1955, ApJ 121, 161
- (42) Schlegel D. J., Finkbeiner D. P., & Davis M., 1998, ApJ, 500, 525
- (43) Tenorio-Tagle G., Silich S. A., Kunth D., Terlevich E., & Terlevich R., 1999, MNRAS, 309, 332
- (44) Thuan T. X., & Izotov Y. I. 1997, ApJ, 489, 623
- (45) Valls-Gabaud D., 1993, ApJ, 419, 7