Non-thermal X-rays, a high abundance ridge and fossil bubbles in the core of the Perseus cluster of galaxies
Abstract
Using a deep Chandra observation of the Perseus cluster of galaxies, we find a high-abundance shell 250 arcsec (93 kpc) from the central nucleus. This ridge lies at the edge of the Perseus radio mini-halo. In addition we identify two H filaments pointing towards this shell. We hypothesise that this ridge is the edge of a fossil radio bubble, formed by entrained enriched material lifted from the core of the cluster. There is a temperature jump outside the shell, but the pressure is continuous indicating a cold front. A non-thermal component is mapped over the core of the cluster with a morphology similar to the mini-halo. Its total luminosity is , extending in radius to . Assuming the non-thermal emission is the result of inverse Compton scattering of the CMB and infrared emission from NGC 1275, we map the magnetic field over the core of the cluster.
keywords:
X-rays: galaxies — galaxies: clusters: individual: Perseus — intergalactic medium1 Introduction
The Perseus cluster, Abell 426, has long been known to host depressions in its X-ray surface brightness image. Fabian et al (1981) and Branduardi-Raymont et al (1981) identified a hole in emission around 80 arcsec north-west of the nucleus using the Einstein observatory. Using ROSAT, Böhringer et al (1993) found two further inner depressions to the north-east and south-west of the core, of size arcmin. These holes in the X-ray emission coincided in position with the radio lobes of the bright central radio source 3C 84 (Pedlar et al 1990). It is therefore probable that the radio plasma has displaced the thermal X-ray emitting gas from the bubbles.
Using the sub-arcsecond imaging capabilities of the Chandra observatory, Fabian et al (2000) found that the X-ray bright rims of the inner radio lobes are cooler than the surrounding gas. They also identified a further outer X-ray hole to the south of the nucleus. The two outer X-ray holes correspond in position to two spurs in the low frequency radio emission (Fabian et al 2002). This low frequency emission is probably due to a population of old electrons, indicating that these depressions are two fossil radio lobes which have detached themselves from the nucleus.
Deep Chandra images of the cluster show there appears to be a weak shock driven by the inner north-east radio bubble (Fabian et al 2003a). Furthermore, evidence for ripples in the X-ray surface brightness was found which may be waves driven in the intracluster medium (ICM) by the expansion of the radio lobes. Detailed spectral analysis of the data showed evidence that the gas was enriched around at least two of the holes (Sanders et al 2004). This supports the hypothesis that rising radio lobes lift and entrain high abundance material from the core of the cluster (Churazov et al 2001).
In addition the cluster exhibits a large number of optical filaments emitting in H (Conselice, Gallagher and Wyse 2001). Many of these filaments are radial, and remarkably straight. The morphology of these filaments supports the argument that the gas in these clusters is viscous and not turbulent (Fabian et al 2003b).
The Perseus cluster is at a redshift of 0.0183. We assume that ; therefore 1 kpc corresponds to about 2.7 arcsec.
2 Analysis
2.1 Temperature and abundance structure
For this analysis we examined the 191-ks deep Chandra observation of the Perseus cluster. The data were processed using the same prescription as given in Sanders et al (2004).
We selected regions in the cluster using the contour binning algorithm of Sanders (in preparation). The method takes an adaptively smoothed X-ray image of the cluster, and uses it to define regions which have similar surface brightness. Firstly the routine adaptively smooths an X-ray image using a method called ‘accumulative smoothing’. This form of adaptive smoothing is similar to that used by the ftools routine fadapt. It smooths using a top-hat circular kernel which varies in size in order to have a minimum signal to noise within the smoothing kernel ( if background is not taken into account, where is the number of counts in the kernel).
The contour binning algorithm starts at the highest flux pixel in the smoothed image. This pixel is added to the current bin. If the signal to noise within this bin (again , if background is ignored, where is the total number of counts within the bin on the unsmoothed image) is less than a threshold value, chosen here to be 100, then the neighbouring pixel closest in smoothed flux to the starting pixel is added to the bin. This is repeated until the signal to noise threshold is reached or there are no remaining neighbouring pixels. Additionally, we apply a geometric constraint to pixels to be added to a bin. We do not add pixels if they lie a distance of greater than away from the current centroid of the bin, where is the radius a circle would have if it had the same area as the bin currently does, and is a parameter which we choose to be 1.8. This constraint ensures the bins do not become too elongated. Increasing allows bins which are more elongated. When a bin is completed, binning starts on the highest remaining pixel on the smoothed map.
When there are no remaining pixels, pixels in bins which contain a signal to noise less than the threshold value are transferred to neighbouring bins closest in smoothed flux. These low signal to noise bins are created if they have no neighbouring pixels which could be added. A signal to noise of 100 yields bins which contain counts.
Spectra were extracted from each region. Responses were generated using a custom tool to add responses built using the ciao mkrmf program, weighted relative to the number of counts in each response region between 0.5 and 7 keV. Ancillary responses were generated using the mkwarf tool. We extracted background spectra from a blank sky observation, for each region, as was done in Sanders et al (2004). Spectra were binned to contain a minimum of 20 counts per spectral channel. Each spectrum was then fitted with xspec (Arnaud 1996) using a mekal model (Mewe, Gronenschild & van den Oord 1985; Liedahl, Osterheld & Goldstein 1995) absorbed by a phabs model (Balucinska-Church & McCammon 1992). In the fits, the temperature, abundance (relative to solar), normalisation and absorption were free. The redshift was set to the mean redshift found in our previous analysis, 0.0169 (Sanders et al 2004). We assumed the solar abundance ratios of Anders & Grevesse (1989) when fitting.
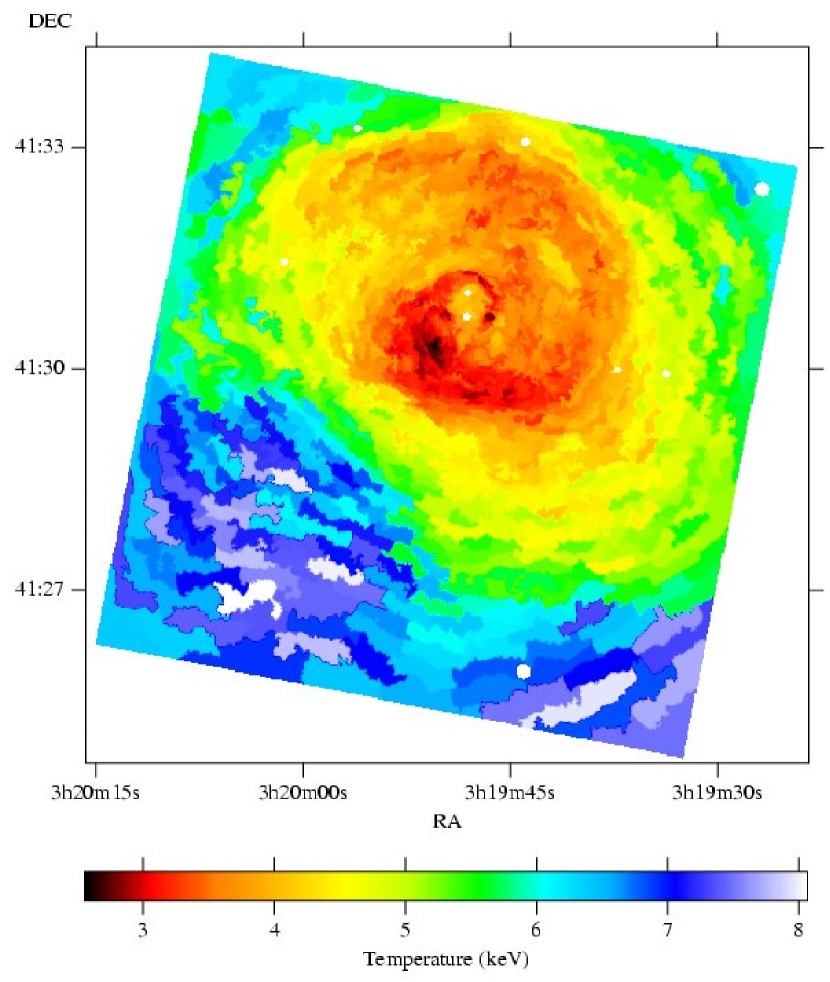
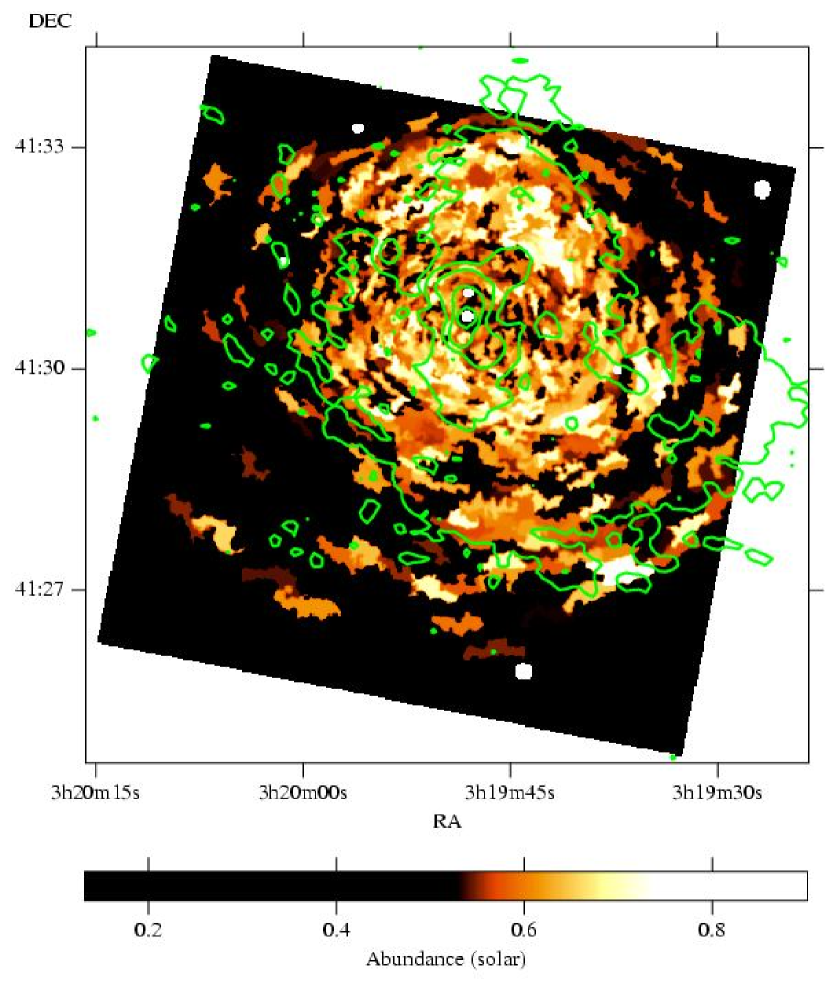
In Fig. 1 we show the derived temperature map for the cluster on the ACIS-S3 CCD. This figure can be compared to Fig. 4 (top) in Sanders et al (2004), created using a tessellation technique. In Fig. 2 (top) is shown the abundance map. Overlaid on the abundance map are 330 MHz radio contours taken using the VLA, showing the nuclear radio source 3C 84, its radio lobes, the spurs pointing out towards the already known fossil radio bubbles, and the extended mini-halo emission.
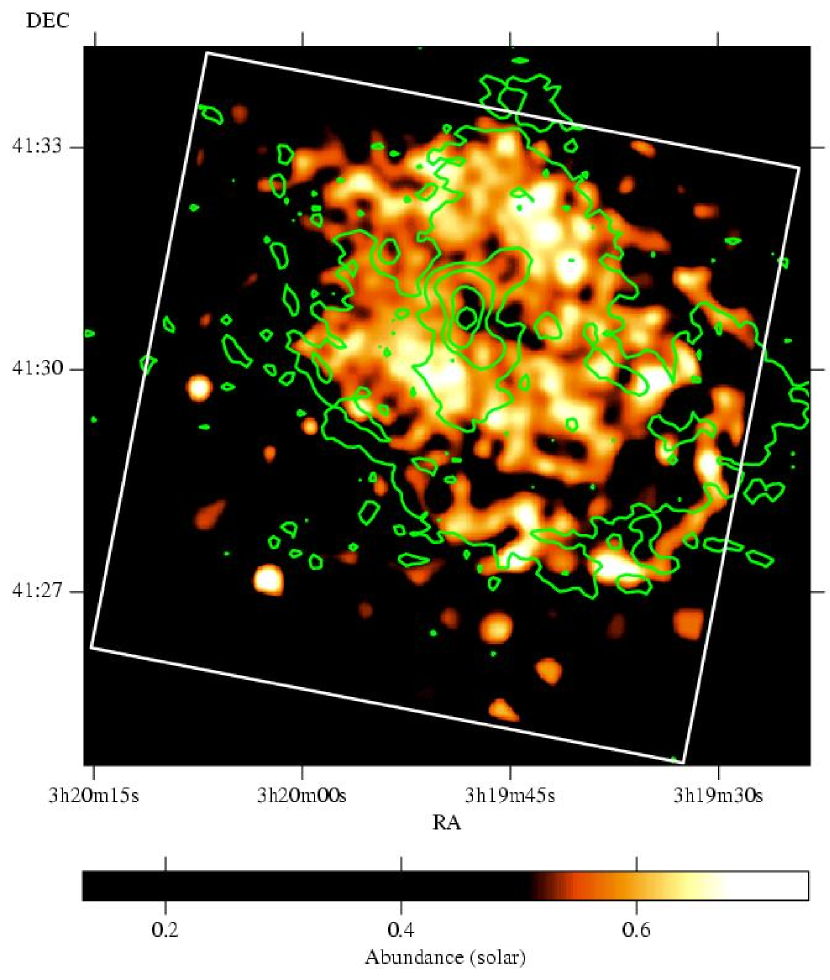
There appears to be a ridge of high abundance along the edge of the mini-halo 250 arcsec (93 kpc) to the south-west of the nucleus. Although the contour binning algorithm selects regions which follow the surface brightness well, the regions created using the procedure we described above are not as compact as those created using the bin accretion algorithm of Cappellari & Copin (2003). Fig. 2 (bottom) shows a map made using bin accretion, with each region containing counts. This map allows us to closely identify where the metal-rich material is. We resolve the edge of rim into a shell at the edge of the mini-halo of maximum width arcsec (7 kpc).
In addition to the high-abundance ridge, most of the metal-rich gas in the core of the cluster (inside a radius of kpc) is bordered by the edge of the mini-halo. It can also be noted that the edge of the mini-halo, where there is a change in metallicity, also corresponds to a change in temperature (Fig. 1). Another way to represent this is the inverse correlation between temperature and abundance previously found in this cluster (Sanders et al 2004, figures 11 and 22). In particular there is a bulge of cool gas to the north of the core (at the edge of the map, 03:19:45, +41:33:17), where the radio is extended (Fig. 2 [bottom]; Fig. 3).
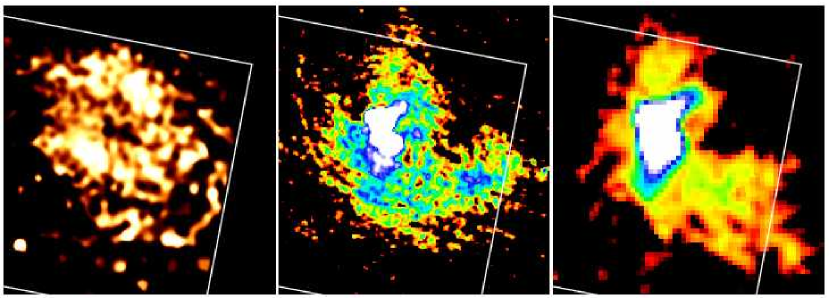
A low frequency 74 MHz image of the cluster (Fig. 3 [right]; Fabian et al 2002) also shows a bright region pointing towards the shell, extending beyond it.
Another noteworthy feature is the high-abundance clump at (03:19:39, +41:29:18). This clump is seated roughly midway between the high abundance shell and the nucleus.
2.2 H image
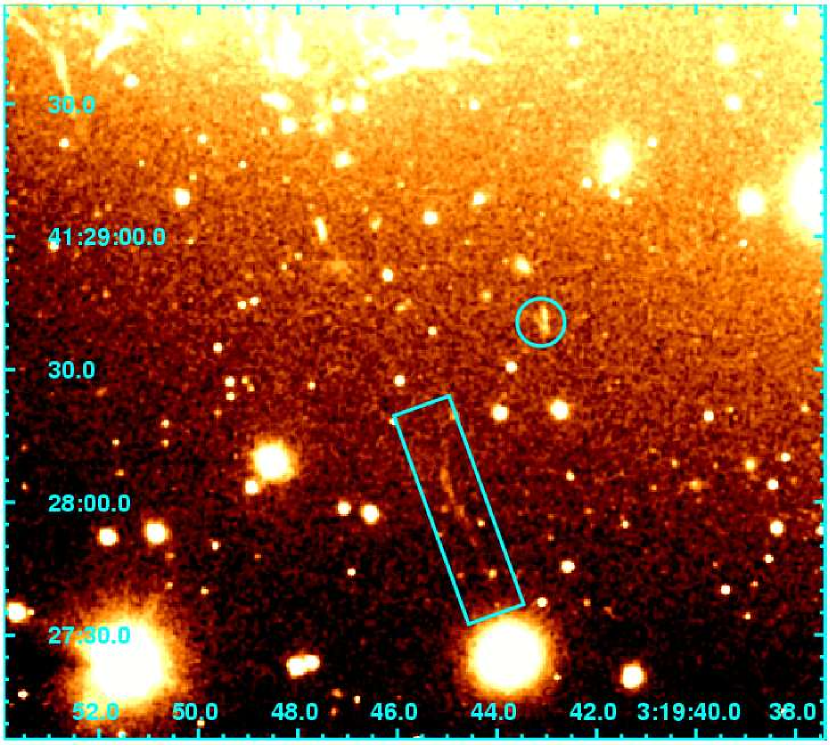
We examined a H map of the south of the Perseus cluster (Conselice et al 2001), finding two previously unreported H structures to the south-south-west of the nucleus, at a similar radius to the high abundance ridge (Fig. 4). One structure is extended ( arcsec, long), the other is around 6 arcsec in length, with a V-shaped morphology. The extended filament points from the central nucleus to the southern edge of the high abundance shell.
2.3 Profile across the shell
We attempted to account for projection to investigate the physical properties of the gas around the high abundance shell, using the projct model in xspec to do this. Unfortunately the results from the spectral fitting appeared to be unstable. Although we could produce results which were plausible by choosing certain sectors, we found that changing the position or number of the sectors slightly resulted in temperatures which oscillated between extreme values. The error bars on the values were incompatible with a smooth variation. Halving the sector width doubled the frequency of the oscillations. Therefore it is likely to be unsafe to trust chosen sectors where the deprojection appears to work. The likely cause for this ‘temperature bouncing’ is that the cluster is not spherically symmetric over the regions examined.
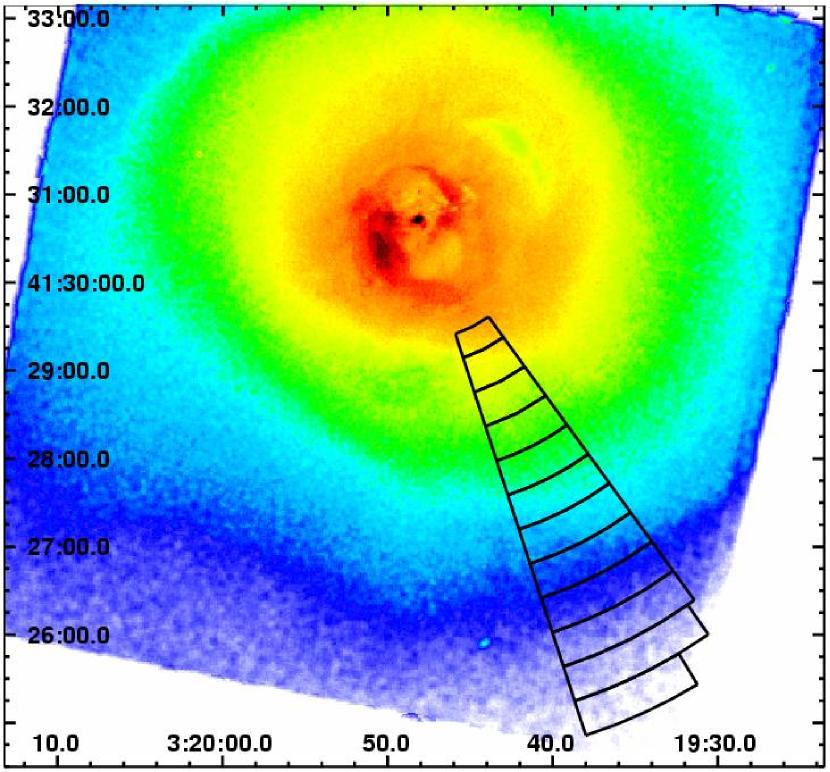
We therefore decided not to pursue a deprojection analysis, and instead calculated projected results for the sectors show in Fig. 5. The spectrum in each sector was fitted with a mekal model with the normalisation, temperature and solar relative abundance free. Also allowed to vary in each spectral fit was a phabs model to account for Galactic absorption. The results of the spectral fits are shown in Fig. 6. In addition we estimated the electron density inside the shell by taking the emission measure of the mekal component in the shell, and computing the electron density assuming the volume of the shell is the area on the sky times the radius from the centre of the cluster. The pressure was estimated by multiplying this value by the projected emission-weighted temperature.
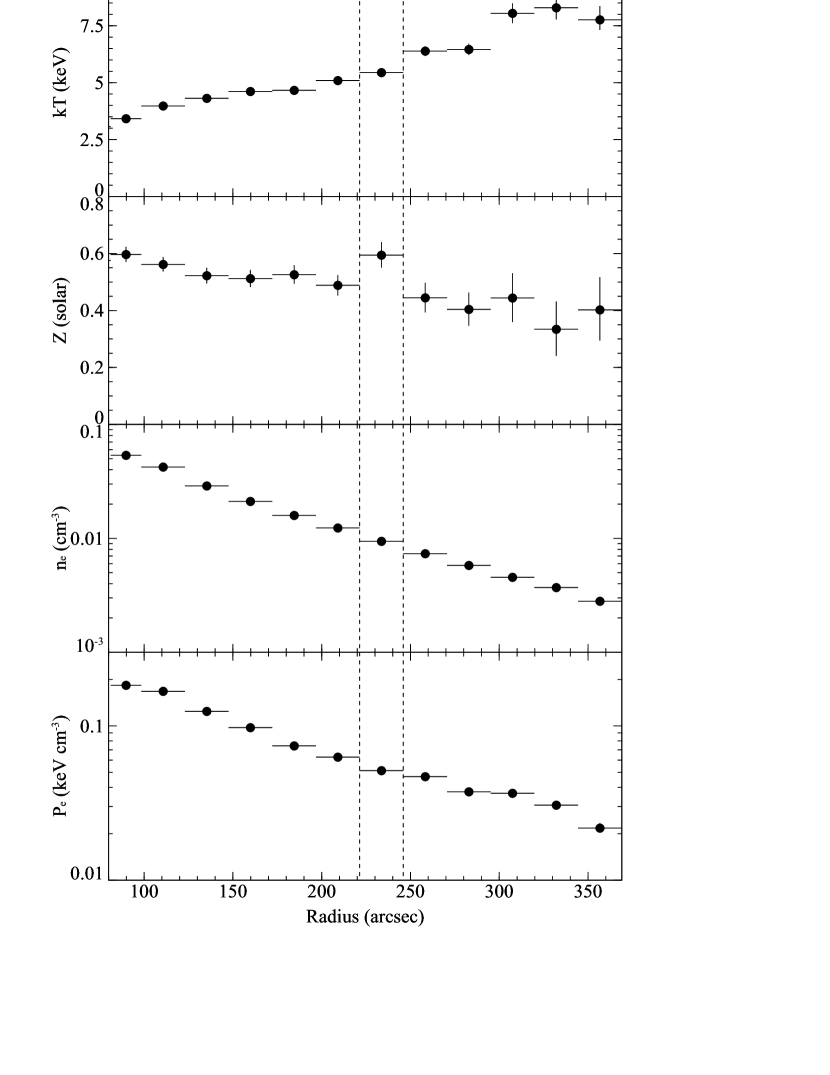
The profiles show beyond the high abundance shell that there is a jump in projected temperature by around 1 keV. However, there is no obvious step change in electron density or pressure over this radius or beyond. The change in temperature beyond the high abundance shell is therefore likely to mark a cold front (Markevitch et al 2000).
2.4 Non-thermal components
We previously found evidence for the existence of a hard, probably non-thermal, component in the X-ray spectrum from the centre of the cluster (Fig. 15 in Sanders et al 2004), found by fitting a high-temperature thermal component. To understand the nature of this component better, and to compare it against the structure of the radio source, we have fitted a more appropriate thermal plus powerlaw model to regions in the cluster.
We fitted spectra extracted from regions with a signal to noise ratio of greater than 300 ( counts) using the same contour binning technique as described in Section 2.1. Each spectrum was fitted with a mekal thermal component, with variable temperature, abundance and normalisation, plus a power-law component, with variable photon index and normalisation, both absorbed by a variable phabs absorber. The photon index of the powerlaw component was constrained to lie between 1.4 and 2.4. We fitted the spectra between 0.6 and 8 keV.
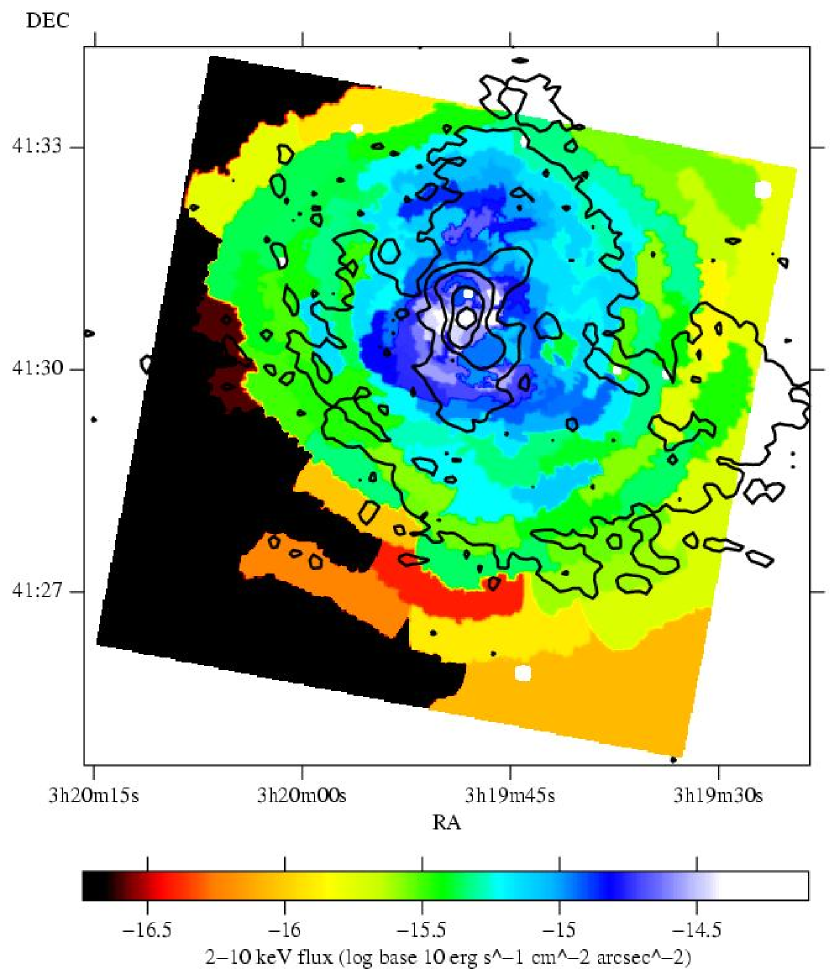
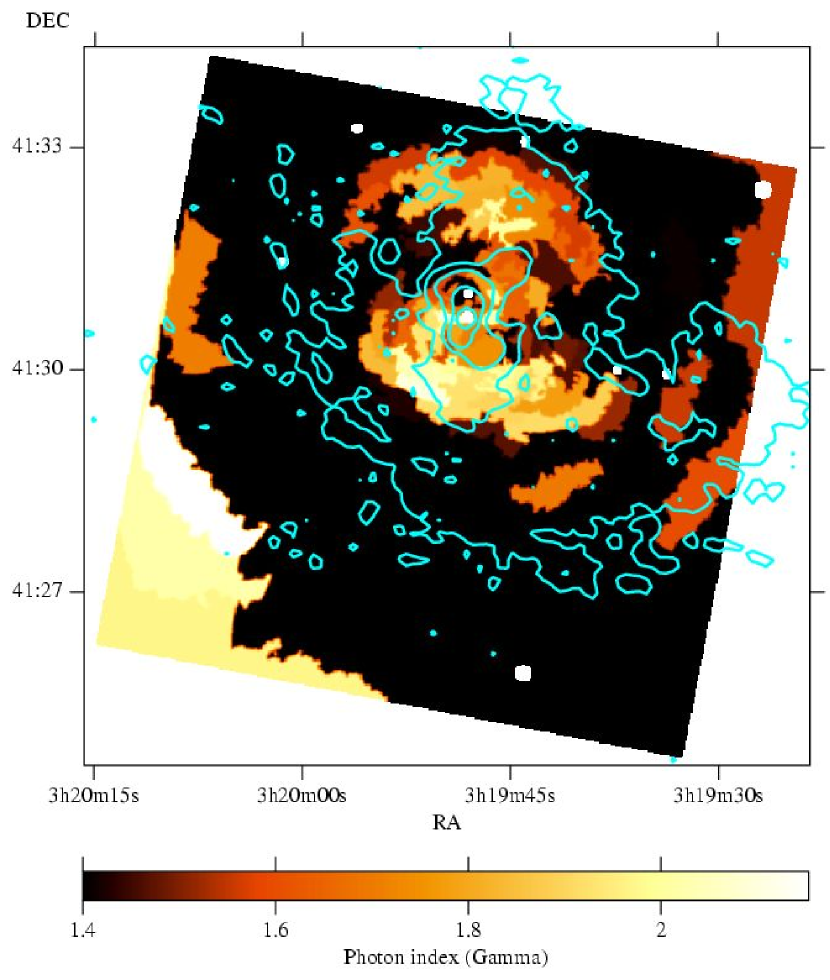
In Fig. 7 is shown the X-ray flux of the powerlaw component, in the 2-10 keV band per square arcsecond, and its photon index, . In xspec the powerlaw model is defined as , where , the normalisation, is in units of at an energy of 1 keV.
The powerlaw flux map has a similar morphology to the hard component map in Sanders et al (2004), but we are better able to match it to the X-ray gas morphology with the contour binning technique. The brightest apparent emission comes from a mushroom-shaped region to the north of the core, to the south-east of the core, and a region pointing to the south-west. We detect a strong component ( arcsec-2) from the inner 200 arcsec (74 kpc) of the core, peaking at values of arcsec-2. There is also an enhancement parallel to the high abundance ridge, just inside of it, along where the mini-halo is extended. This enhancement is significant statistically. The inner radio lobes are embedded in the brightest non-thermal emission. The outer NW hole is embedded in strong emission but shows no excess. There is a detached region of bright emission near the southern bubble, but without exact correspondence.
The photon index of the powerlaw appears to change as a function of position. In the regions where the component is brightest, the photon index is large (). This drops off in radius quickly to the lowermost value allowed in the fit, 1.4.
We note that this two-dimensional mapping of the powerlaw component does not include the effects of projection. It is expected there will be overlying hot gas of around 7 keV in front of the cool region. This will contribute to the non-thermal component detected. In order to check whether projection affects the results, we simulated a 200 ks Chandra observation of the Perseus cluster with no powerlaw component, to repeat the analysis. We took the radial temperature and density profile parameterisations given in Churazov et al (2003). These have the advantage that they go out to larger radii than our Chandra measurements. We also took a simple cubic fit to the deprojected abundance profile of Sanders et al (2004), truncating it at above 120 kpc. Using these profiles, we simulated a volume (; where the direction is along the line of sight) of the cluster. In regions of arcsec we generated a simulated spectrum for the plasma at that radius using mekal, phabs and xspec. We extracted the photons which made up each spectrum, randomising their position on the cuboid projected on the sky. Using these photons, we populated an event file suitable for analysis with the ciao tools. We added X-ray background photons from a faked spectrum generated using a three-powerlaw fit to the Chandra blank-sky background spectrum.
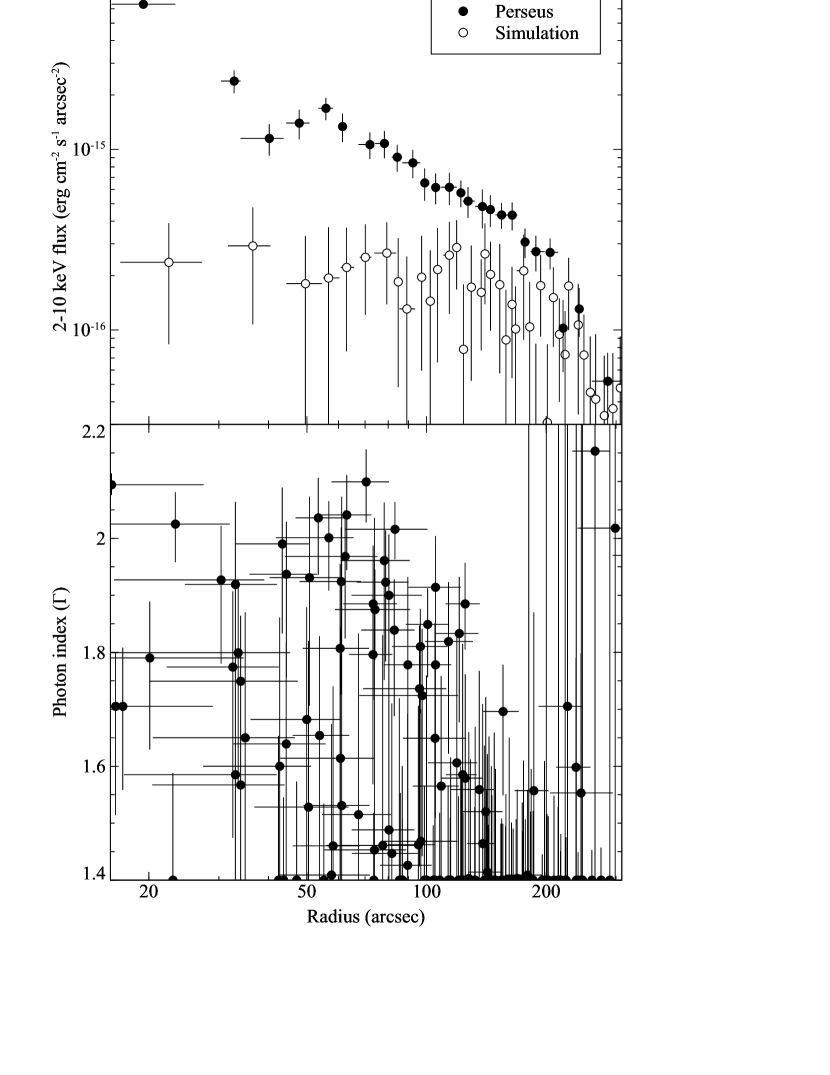
In Fig. 8 (top), a radial profile shows the average measured powerlaw flux per square arcsecond. Also plotted is the measured value from the analysis of the simulated dataset, which does not include any non-thermal emission. Although there is a weak signal from projection effects, the observed signal is over an order of magnitude larger than the background in the centre. There appears to be an excess out to radii of at least 100 arcsec, and probably 200 arcsec.
Another potential source for the excess emission are the Ni and Fe-K lines. We tried to use a model with variable Ni abundance, but it did not appear to significantly change the powerlaw normalisation in the innermost region. X-ray background effects remain a slight possibility, although it is unclear why there would be an order of magnitude difference in the centre of the field from the outer regions.
The photon index is well constrained at around 2 for the brightest region of emission (Fig. 8, bottom). The photon index measurements are largely unconstrained from the simulated dataset.
The total powerlaw flux is between 2 and 10 keV, found by integrating Fig. 8 (top), and subtracting the flux found using the simulated dataset. This corresponds to a luminosity of , which is similar to the luminosity given by Sanders et al (2004).
2.4.1 Estimating the magnetic field
If the non-thermal emission is the result of inverse Compton emission, it is possible to estimate the value of the magnetic field. If there is a photon field with energy density , the ratio of the non-thermal X-ray flux to radio flux is approximately
| (1) |
where is the number density of electrons with Lorentz factor , , and are the frequencies of the X-ray and the radiation which is scattered, , the cyclotron frequency , is the magnetic field and is the frequency of the measured radio flux.
There are two dominant sources of photons for inverse Compton scattering in this object. These are the Cosmic Microwave Background (CMB), and the infrared (IR) flux from NGC 1275 (; Impey & Neugebauer 1988). The non-thermal flux observed will be the sum of these two contributions,
| (2) |
where is the frequency of the CMB radiation ( GHz), is the frequency of the IR radiation (equivalent to m), is the energy density of the CMB field (), and at a radius of . This equation can be solved for by substituting in .
Taking the 330 MHz radio map of the mini halo and dividing it by the area of the beam, we computed the radio flux per square arcsecond. Using this map with the X-ray powerlaw flux (per square arcsecond) and photon index maps, we estimated the magnetic field as a function of position. A value of arcsec-2 was subtracted from the X-ray map to account for the “projection background” shown in Fig. 8. In Fig. 9 is shown the estimated magnetic field over the core of the cluster. The contribution from the IR photon field dominates the CMB contribution within a radius of around .
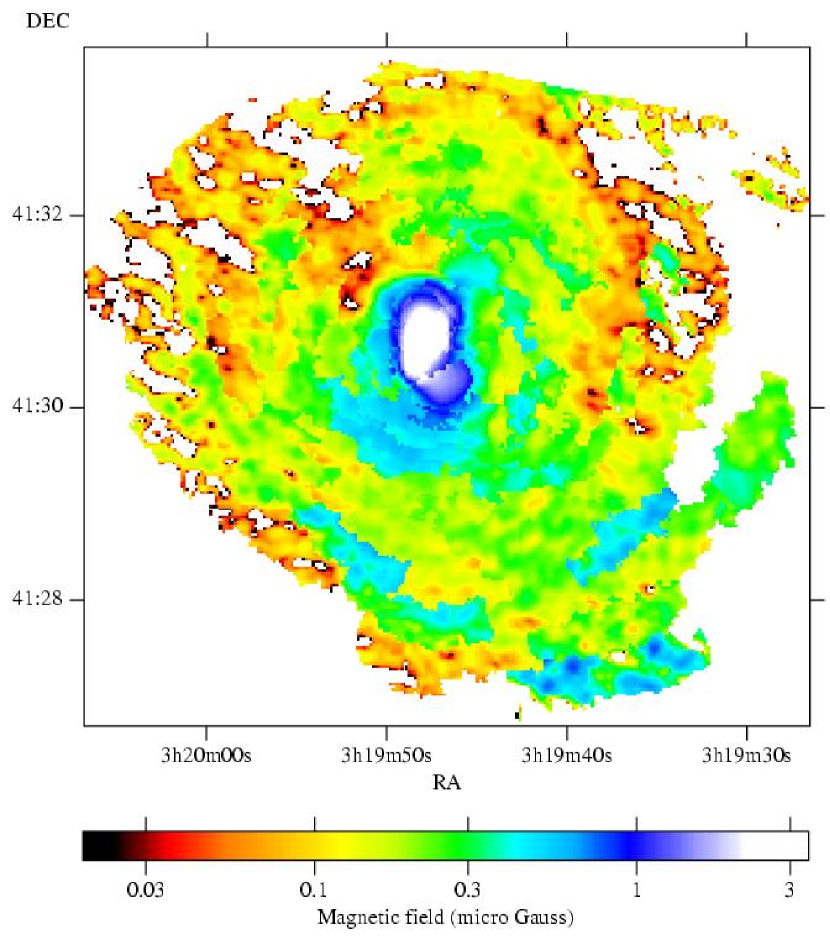
At the edge of the field we are close to the limit of the radio image. Therefore the values of are unlikely to be accurate. Increased values of would also raise our estimates of the magnetic field there too. Furthermore the uncertainties of the subtraction of the background signal from the X-ray flux are much more significant near the edge of the field. We therefore recommend that values of below G are ignored.
The calculated values will also be affected if the magnetic field is filamentary. The synchrotron emission could originate from regions with a different magnetic field from the inverse Compton emission. Highly filamentary polarisation structure has been seen from the radio galaxy Fornax A (Fomalont et al 1989).
We note that the inferred pressure of the relativistic electrons which would produce the observed non-thermal emission approaches 60 per cent of the total pressure in the small regions where is high () to the south and north of the nucleus (see Fig. 7 [bottom]). Elsewhere it ranges from 1 to 30 per cent of the total pressure, declining quickly with radius. If this result is confirmed by deeper observations of Perseus, it would have consequences for heating in clusters.
3 Discussion
3.1 High abundance ridge
The ridge appears not to be dependent on the binning technique used, which suggests the feature is robust. If the ridge is a real feature, it may be high abundance material lifted out of the inner core, material deposited in a merger event, or it may have formed in situ.
It seems unlikely that the metals were deposited by stars in the current location of the ridge. The high abundance region is a large distance from the core of NGC 1275. A merger remains a possibility. If this is the case it may have also disturbed the radio morphology to match the location of the high abundance material. It is however difficult to interpret the radial H filaments in this scenario.
Our favoured explanation is that the material was lifted from the core of the cluster. There are correspondences between the outer north-west and inner south-west radio lobe positions and metallicity enhancements. Simulations of buoyantly rising bubbles in clusters show that material is entrained by the rising bubble (Churazov et al 2001, see figure 9). Gas is entrained at the upper surface of the rising bubble, and in its wake. The ridge of high abundance material could represent the upper (or lower) surface of a rising bubble. The high abundance clump midway between the core of the cluster and the ridge could be material lifted in the wake of the bubble.
This explanation also fits in naturally with the extended H filament which is pointing towards the south of the ridge. Previously two filaments behind the north-west bubble were identified, which appear to be acting as streamlines (Fabian et al 2003b). If this is the case the filaments trace the motion of the intracluster medium, the flow is laminar, and the gas here is not turbulent. Models of rising bubbles indicate that viscosity can suppress the instabilities that lead to the shredding of rising bubbles (Reynolds et al 2004). Furthermore sound waves generated by the expanding bubble may viscously heat the core of the cluster, thereby offsetting cooling (Fabian et al 2003a).
Further evidence is suggested by the correlation between the high abundance ridge and the edge of the mini-halo. A bubble will detach and rise until the density of its contents matches the density of the surrounding gas. If viscosity and magnetic field effects are negligible, instabilities will destroy the bubble before it reaches this radius. If this is not the case, the bubble will then flatten and grow around the isodensity surface (forming a “pancake”), and remain intact as long as surface effects retain its structure. For each of the existing bubbles in Perseus, we find associated radio emission. The mini-halo may be the radio counterpart to the bubble that formed the ridge. The ridge lies at a temperature and density interface, and so is a natural interface where a bubble would pancake. The non-thermal X-ray emission associated with the rim suggests the presence of old electrons which made up the bubble.
It may be the case that the halo is the remaining low frequency emission of all the old radio bubbles in the cluster111Alternatively, Gitti et al (2002) have proposed that the radio mini-halo is due to turbulent reacceleration of intracluster cosmic-ray electrons.. This would be the case if the bubbles were always generated with similar densities. This idea may fit with the inhomogeneous metallicity map of the core of the cluster (Fig. 2). Rising bubbles may be responsible for much of the structure in this image, displacing metal-rich gas from the core to larger radii. Then there is very little mixing taking place in the intracluster medium, with the gas viscous and not turbulent. The width of the high abundance ridge ( arcsec; 7 kpc) places limits on mixing. We can estimate ages for the bubble, following the approach of Dunn & Fabian (2004), of (rising at buoyancy velocity), and yr (refilling velocity). These are the likely timescales for which the ridge must have survived if it were at the edge of a bubble. See Dunn & Fabian (2004) and Dunn & Fabian (in preparation) for an explanation of these timescales and the assumptions made in their calculation.
There are some possible difficulties with this model. We do not know whether it is possible to entrain enough metals with a rising bubble, especially on its rim. We do not know how entrainment is affected by viscosity and magnetic fields. Nevertheless, we observe high abundances patches around at least two of the existing radio bubbles. We do not know whether the ICM is viscous or turbulent. Future observations of Perseus using ASTRO-E2 should resolve this issue. Indeed, forthcoming analysis of deeper observations of Perseus by Chandra will enable us to map the abundance in exquisite detail. In addition we will be able to confirm and further examine the bulk motion found in the core of the cluster (Sanders et al 2004).
We presume that the high metallicity shell with break up and the iron-rich denser material will fall back towards the centre. Otherwise, it is difficult to understand how the central regions have remained at high abundance. This will further heat the inner regions. Flows may therefore take place in both directions.
3.2 Non-thermal emission
The evidence for non-thermal emission may still be an artifact of the spectral fitting procedure. Unfortunately, since the XMM-Newton observation of this cluster is affected by high background (Churazov et al 2003), we were unable to easily confirm the non-thermal X-ray emission with this instrument. It is therefore important to observe this cluster with XMM-Newton again in a period with low background.
If our identification of non-thermal emission is correct, then it opens the possibility of real detections of inverse Compton emission in other clusters of galaxies by current X-ray telescopes. Measuring magnetic fields by this method would complement existing methods (see Carilli & Taylor 2002).
3.3 Further fossil bubbles
There is a further interesting connection between the abundance, temperatures, radio, H and non-thermal maps. All of these maps show features pointing towards the north. These include the bulge at the top of the temperature map (Fig. 1), the extension of the 330 and 74 MHz radio images in that direction (Fig. 3), the long H filaments pointing north (Conselice et al 2001) and the extension of the non-thermal component in that direction (Fig. 7). This may indicate that this is the path of a previous buoyant bubble. Furthermore there are further structures in the metallicity and non-thermal maps which may be the result of other fossil bubbles.
Acknowledgements
ACF and RJHD thank the Royal Society and PPARC for support, respectively.
References
- [1] Arnaud, K.A., 1996, Astronomical Data Analysis Software and Systems V, eds. Jacoby G. and Barnes J., p17, ASP Conf. Series volume 101
- [2] Anders E., Grevesse N., 1989, Geochimica et Cosmochimica Acta, 53, 197
- [3] Balucinska-Church M., McCammon D., 1992, ApJ, 400, 699
- [4] Böhringer H., Voges W., Fabian A.C., Edge A.C., Neumann D.M., 1993, MNRAS, 264, L25
- [5] Branduardi-Raymont G., Fabricant D., Feigelson E., Gorenstein P., Grindlay J., Soltan A., 1981, ApJ, 248, 55
- [6] Carilli C.L. Taylor G.B., 2002, A&AR, 40, 319
- [7] Cappellari M., Copin Y., 2003, MNRAS, 342, 345
- [8] Churazov E., Brüggen M., Kaiser C.R., Böhringer H., Forman W., 2001, ApJ, 554, 261
- [9] Churazov E., Forman W., Jones C., Böhringer H., 2003, ApJ, 590, 225
- [10] Conselice C.J., Gallagher J.S. III, Wyse R.F.G., 2001, AJ, 122, 2281
- [11] Dunn R.J.H, Fabian A.C., 2004, MNRAS, 355, 862
- [12] Fabian A.C., Celotti A., Blundell K.M., Kassim N.E., Perley R.A., 2002, MNRAS, 331, 369
- [13] Fabian A.C., Hu E.M., Cowie L.L., Grindlay J., 1981, ApJ, 248, 47
- [14] Fabian A.C., Sanders J.S., Ettori S., Taylor G.B., Allen S.W., Crawford C.S., Iwasawa K., Johnstone R.M., Ogle P.M., 2000, MNRAS, 318, L65
- [15] Fabian A.C., Sanders J.S., Allen S.W., Crawford C.S., Iwasawa K., Johnstone R.M., Schmidt R.W., Taylor G.B., 2003a, MNRAS, 344, L43
- [16] Fabian A.C., Sanders J.S., Crawford C.S., Conselice C.J., Gallagher III J.S., Wyse R.F.G., 2003b, MNRAS, 344, L48
- [17] Fomalont E.B., Ebneter K.A., van Breugel W.J.M., Ekers R.D., 1989, ApJ, 346, L17
- [18] Govoni F., Feretti L., 2004, Int. J. Mod.Phys. D, 13, 1549, astro-ph/0410182
- [19] Gitti M., Brunetti G., Setti G., 2002, A&A, 386, 456
- [20] Impey C.D., Neugebauer G., 1988, AJ, 95, 307
- [21] Liedahl D.A., Osterheld A.L., Goldstein W.H., 1995, ApJ, 438, L115
- [22] Markevitch M. et al., 2000, ApJ, 541, 542
- [23] Mewe R., Gronenschild E.H.B.M., van den Oord G.H.J., 1985, A&AS, 62, 197
- [24] Pedlar A., Ghataure H.S., Davies R.D., Harrison B.A., Perley R., Crane P.C., Unger S.W., 1990, MNRAS, 246, 477
- [25] Reynolds C.S., McKernan B., Fabian A.C., Stone J.M., Vernaleo J.C., MNRAS, submitted, astro-ph/0402632
- [26] Sanders J.S., Fabian A.C., Allen S.W., Schmidt R.W., 2004, MNRAS, 349, 952
- [27] Sijbring, D. 1993, Ph.D. Thesis, Groningen