Ice Age Epochs and the Sun’s Path Through the Galaxy
Abstract
We present a calculation of the Sun’s motion through the Milky Way Galaxy over the last 500 million years. The integration is based upon estimates of the Sun’s current position and speed from measurements with Hipparcos and upon a realistic model for the Galactic gravitational potential. We estimate the times of the Sun’s past spiral arm crossings for a range in assumed values of the spiral pattern angular speed. We find that for a difference between the mean solar and pattern speed of km s-1 kpc-1 the Sun has traversed four spiral arms at times that appear to correspond well with long duration cold periods on Earth. This supports the idea that extended exposure to the higher cosmic ray flux associated with spiral arms can lead to increased cloud cover and long ice age epochs on Earth.
1 Introduction
Since its birth the Sun has made about 20 cycles around the Galaxy, and during this time the Sun has made many passages through the spiral arms of the disk. There is a growing interest in determining how these passages may have affected Earth’s environment. Shaviv (2002, 2003) makes a persuasive argument that there is a correlation between extended cold periods on Earth and Earth’s exposure to a varying cosmic ray flux (CRF). Shaviv proposes that the CRF varies as the Sun moves through Galactic spiral arms, regions with enhanced star formation and supernova rates that create more intense exposure to cosmic rays. The CRF experienced by Earth may affect the atmospheric ionization rate and, in turn, the formation of charged aerosols that promote cloud condensation nuclei (Harrison & Aplin, 2001; Eichkorn et al., 2002). Marsh & Svensmark (2000) show that there is a close correlation between the CRF and low altitude cloud cover over a 15 year time span. Thus, we might expect that extended periods of high CRF lead to increased cloud cover and surface cooling that result in long term (Myr) ice ages. Spiral arm transits may affect Earth in other ways as well. Yeghikyan & Fahr (2004) suggest that during some spiral passages the Earth may encounter interstellar clouds of sufficient density to alter the chemistry of the upper atmosphere and trigger an ice age of relatively long duration. The higher stellar density in the arms may more effectively perturb the Oort cloud of comets and lead to a greater chance of large impacts on Earth, and this combined with the possible lethal effects of nearby supernova explosions could cause mass extinctions during during passages through the spiral arms (Leitch & Vasisht, 1998). On the other hand, the record of terrestrial impact craters suggests a variation on a time scale shorter than the interarm crossing time, but possibly related to the Sun’s oscillations above and below the disk plane (Stothers, 1998).
A comparison of the geological record of temperature variations with estimates of the Sun’s position relative to the spiral arms of the Galaxy is difficult for a number of reasons. First, our location within the disk makes it hard to discern the spiral structure of the Galaxy, particularly in more distant regions. Nevertheless, there is now good evidence that a four-arm spiral pattern is successful in explaining the emissions from the star-forming complexes of the Galaxy (Russeil, 2003). Second, the angular rotation speed of the Galactic spiral pattern is still poorly known, with estimates ranging from 11.5 (Gordon, 1978) to 30 km s-1 kpc-1 (Fernández, Figueras, & Torra, 2001) (see reviews in Shaviv 2003, Bissantz, Englmaier, & Gerhard, 2003, and Martos et al. 2004). Finally, the Sun’s orbit in the Galaxy is not circular, and we need to account for the Sun’s variation in distance from Galactic center and in orbital speed to make an accurate estimate of the Sun’s position in the past.
Here we present such a calculation of the Sun’s path through the Galaxy over the last 500 Myr. It is based upon the Sun’s current motion relative to the local standard of rest as determined from parallaxes and proper motions from the Hipparcos Satellite (Dehnen & Binney, 1998a) and on a realistic model of the Galactic gravitational potential (Dehnen & Binney, 1998b). We discuss how the spiral pattern speed is critical to the estimates of the times of passage through the spiral arms, and we show a plausible example that is consistent with the occurrence of ice ages during spiral arm crossings.
2 Integration of the Sun’s Motion
An integration of the Sun’s motion was made using a cylindrical coordinate system for the Galaxy of . We first determined the position and resolved velocity components of the Sun in this system using the velocity of the Sun with respect to the local standard of rest (Dehnen & Binney, 1998a) and the Sun’s position relative to the plane (Holmberg, Flynn, & Lindegren, 1997). We then performed integrations backward in time using a fourth-order Runge-Kutta method and a model for the Galactic potential from Dehnen & Binney (1998b). We adopted the model (#2) from Dehnen & Binney (1998b) that uses a Galactocentric distance of kpc and a disk stellar density exponential scale length of kpc. This model has a circular velocity at kpc of 217.4 km s-1. We used time steps of 0.01 Myr over a time span of 500 Myr. Note that the model potential is axisymmetric and does not account for the minor variations in the field near spiral arms. We also ignore accelerations due to encounters with giant molecular clouds, since their effect is small over periods less than 1 Gyr (at least in a statistical sense; Jenkins 1992). The full set of coordinates as a function of time is not included here, but interested readers can obtain the digital data from our web site111http://www.chara.gsu.edu/∼gies/solarmotion.dat.
The Sun’s journey in cylindrical coordinates is illustrated in Figure 1. The top panel shows the temporal variation in distance from Galactic center, and we see the radial oscillation that is expected from the “epicycle approximation” for nearly circular orbits (Binney & Tremaine, 1987). The period is 170 Myr and the corresponding frequency is 36.9 km s-1 kpc-1, which is close to the expected value of km s-1 kpc-1 based upon the local Oort constants (Feast & Whitelock, 1997). The middle panel shows the advance in azimuthal position with the orbit (small departures from linearity reflect speed variations that conserve angular momentum). The Sun has completed just over two circuits of the Galaxy over this time span. The lower panel shows the oscillations above and below the Galactic plane. The period is approximately 63.6 Myr, but there are cycle to cycle variations caused by the varying radial density in the model. This period is approximately related to the mid-plane density at the average radius, pc-3 (Binney & Tremaine, 1987). The period for our model of the solar motion corresponds to a mid-plane density of 0.17 pc-3, which is close to current estimates of the Oort limit of pc-3 (Stothers, 1998). Thus, while the estimates of motion of the Sun in the direction are secure for the recent past, probable errors in the period of approximately may accumulate to as much as half a cycle error in the timing of the oscillations 500 Myr ago. The errors in the estimates of the Sun’s current Galactic motions (Dehnen & Binney, 1998a) have only a minor impact on these trajectories. For example, the error in the component of motion amounts to a difference of only in over this 500 Myr time span.
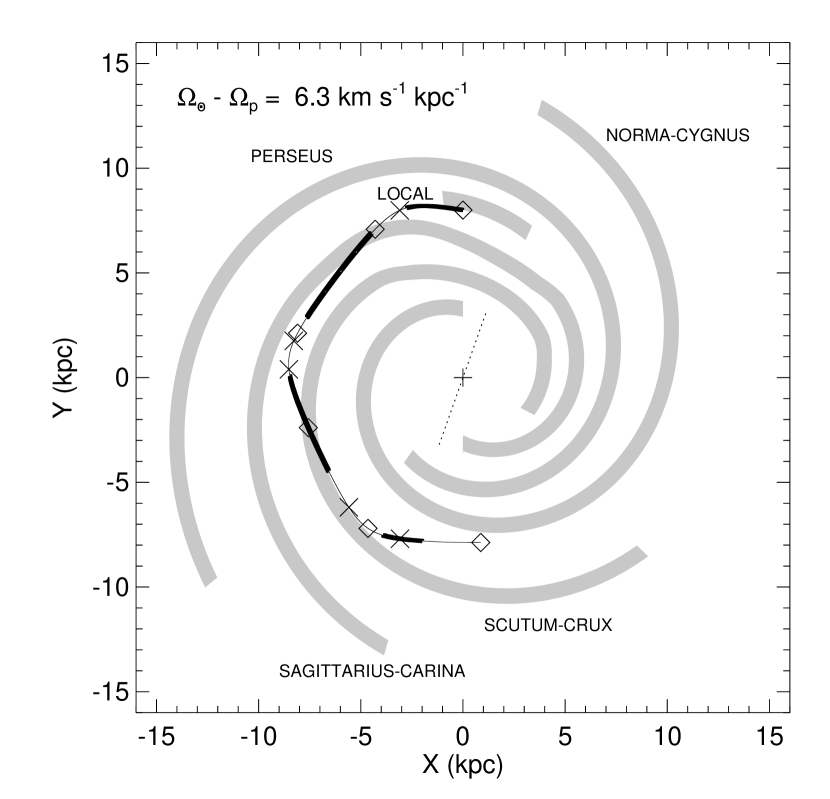
We next consider the motion of the Sun in the plane of the Galaxy relative to the spiral arm pattern. The disk of the Galaxy from the solar circle out-wards appears to display a four-arm spiral structure as seen in the emission of atomic hydrogen (Blitz, Fich, & Kulkarni, 1983) and molecular CO (Dame, Hartmann, & Thaddeus, 2001) and in the distribution of star forming regions (Russeil, 2003). We show in Figure 2 the appearance of the Galactic spiral arm patterns based on the model of Wainscoat et al. (1992) but with some revisions introduced by Cordes & Lazio (2003)222http://astrosun2.astro.cornell.edu/∼cordes/NE2001/. This representation is very similar to the pattern adopted by Russeil (2003). We have rescaled the pattern from a solar Galactocentric radius of 8.5 kpc to a value of 8.0 kpc for consistency with our model of Galactic potential from Dehnen & Binney (1998b). Each arm is plotted with an assumed width of 0.75 kpc (Wainscoat et al., 1992) and each is named in accordance with the scheme of Russeil (2003). The dotted line through the center of the Galaxy indicates the current location of the central bar according to Bissantz et al. (2003). The pattern speed of the bar may be similar to that of the arms (Ibata & Gilmore, 1995) or it may be faster than that of the arms (Bissantz et al., 2003), in which case the bar – arm relative orientation will be different in the past.
The placement of the Sun’s trajectory in this diagram depends critically on the relative angular pattern speeds of the Sun and the spiral arms. The mean advance in azimuth in our model of the Sun’s motion corresponds to a solar angular motion of km s-1 kpc-1. If the difference in the solar and spiral arm pattern speeds, , is greater than zero, then the Sun overtakes the spiral pattern and progresses in a clockwise direction in our depiction of the Galactic plane. Unfortunately, the spiral pattern speed is not well established and may in fact be different in the inner and outer parts of the Galaxy (Shaviv, 2003). Several recent studies (Amaral & Lepine, 1997; Bissantz et al., 2003; Martos et al., 2004) advocate a spiral pattern speed of km s-1 kpc-1, and we show in Figure 2 the Sun’s trajectory projected onto the plane for this value ( km s-1 kpc-1). Diamonds along the Sun’s track indicate its placement at intervals of 100 Myr. We see that for this assumed pattern speed the Sun has passed through only two arms over the last 500 Myr. However, if we assume a lower but still acceptable pattern speed of km s-1 kpc-1 (shown in Fig. 3 for km s-1 kpc-1), then the Sun has crossed four spiral arms in the past 500 Myr and has nearly completed a full rotation ahead of the spiral pattern. Thus, the choice of the spiral pattern speed dramatically influences any conclusions about the number and timing of Sun’s passages through the spiral arms over this time interval.
The duration of a coherent spiral pattern is an open question, but there is some evidence that long-lived spiral patterns may be more prevalent in galaxies with a central bar. For example, numerical simulations of the evolution of barred spirals by Rautiainen & Salo (1999) suggest that spiral patterns may last several gigayears. Their work suggests that the shortest time scale for the appearance or disappearance of a spiral arm is about 1 Gyr. Therefore, it is reasonable to assume that the present day spiral structure has probably been more or less intact over the last 500 Myr (at least in the region of the solar circle).
3 Discussion
Shaviv (2003) argues that the Earth has experienced four large scale cycles in the CRF over the last 500 Myr (with similar cycle times back to 1 Gyr before the present). Shaviv shows that the CRF exposure ages of iron meteorites indicate a periodicity of Myr in the CRF rate. Since the cosmic ray production is related to supernovae and since Type II supernovae will be more prevalent in the young star forming regions of the spiral arms, Shaviv suggests that the periodicity corresponds to the mean time between arm crossings (so that Earth has made four arm crossings over the last 500 Myr). Shaviv (2003) and Shaviv & Veizer (2003) show how the epochs of enhanced CRF are associated with cold periods on Earth. The geological record of climate-sensitive sedimentary layers (glacial deposits) and the paleolatitudinal distribution of ice rafted debris (Frakes, Francis, & Syktus, 1992; Crowell, 1999) indicate that the Earth has experienced periods of extended cold (“icehouses”) and hot temperatures (“greenhouses”) lasting tens of million years (Frakes et al., 1992). The long periods of cold may be punctuated by much more rapid episodes of ice age advances and declines (Imbrie et al., 1992). The climate variations indicated by the geological evidence of glaciation are confirmed by measurements of ancient tropical sea temperatures through oxygen isotope levels in biochemical sediments (Veizer et al., 2000). All of these studies lead to a generally coherent picture in which four periods of extended cold have occurred over the last 500 Myr, and the midpoints of these ice age epochs (IAE) are summarized in Table 1 (see Shaviv, 2003). The icehouse times according to Frakes et al. (1992) are indicated by the thick line segments in each of Figures 1, 2, and 3.
If these IAE do correspond to the Sun’s passages through spiral arms, then it is worthwhile considering what spiral pattern speeds lead to crossing times during ice ages. We calculated the crossing times for a grid of assumed values of and found the value that minimized the residuals of the differences between the crossing times and IAE. There are two major error sources in the estimation of the timing differences. First, the calculated arm crossing times depend sensitively on the placement of the spiral arms, and we made a comparison between the crossing times for our adopted model and that of Russeil (2003) to estimate the timing error related to uncertainties in the position of the spiral arms (approximately Myr except in the case of the crossing of the Scutum–Crux arm on the far side of the Galaxy where the difference is Myr). Secondly, there are errors associated with the estimated mid-times of the IAE, and we used the scatter between the various estimates in columns 2 – 5 of Table 1 to set this error (approximately Myr). We adopted the quadratic sum of these two errors in evaluating the statistic of each fit. The results of the fitting procedure for various model and sample assumptions are listed in Table 2.
The first trial fit was made by finding the minimum that best matched the crossing times with the IAE midpoints from Shaviv (2003) (given in column 5 of Table 1 and noted as “Midpoint” in column 2 of Table 2). All four arm crossings were included in the calculation (indicated as 1 – 4 in column 3 of Table 2) that used the adopted model for the Galactic potential with a Galactocentric distance kpc and and a stellar disk exponential scale length of kpc (model #2 from Dehnen & Binney 1998b; see columns 4 and 5 of Table 2). The best fit difference (column 6 of Table 2) is obtained with km s-1 kpc-1, where the error was estimated by finding the limits for which increased by 1. This fit gave reasonable agreement between the IAE and crossing times for all but the most recent crossing of the Sagittarius – Carina arm. Thus, we made a second fit (#2 in Table 2) using only the crossings associated with IAE 2 – 4, and this solution (with km s-1 kpc-1) is the one illustrated in Figure 3. The crossing times (given in the final column of Table 1) agree well with the adopted IAE midpoints. Our results are similar to the estimate of km s-1 kpc-1 from Shaviv (2003) who assumed a circular orbit for the Sun in the Galaxy.
We also computed orbits using two other models for the Galactic potential from Dehnen & Binney (1998b) and determined the best fit spiral speeds for these as well. Fit #3 in Table 2 was made assuming a larger Galactocentric distance kpc but with the same ratio of (model #2b in Dehnen & Binney 1998b), and the resulting best fit spiral speed is the same within errors as that for our adopted model. We also computed an orbit for a potential with a larger value of disk exponential scale length (model #3 in Dehnen & Binney 1998b), but again the best fit spiral speed (fit #4 in Table 2) is the same within errors as that for our adopted model. Thus, the details of the adopted Galactic potential model have little influence on the derived spiral pattern speed needed to match the IAE times.
We might expect that the IAE midpoint occurs somewhat after the central crossing of the arm. For example, Shaviv (2003) suggests that the IAE midpoint may occur some 21 – 35 Myr after the central arm crossing due to the difference in the stellar and pattern speeds (so that the cosmic rays move ahead of arms as the stellar population does) and to the time delay between stellar birth and supernova explosion of the SN II cosmic ray sources. Furthermore, if ice ages are triggered by encounters with dense clouds as suggested by Yeghikyan & Fahr (2004), then the ice age may not begin until the Sun reaches the gas density maximum at the center of the arm. Thus, we calculated a second set of best fit spiral speeds to match the mean crossing and icehouse starting times (Frakes et al., 1992), and these are listed as fits #5 and #6 in Table 2. This assumption leads to somewhat smaller values of , but ones that agree within errors with all the other estimates.
We offer a few cautionary notes about possible systematic errors in this analysis. First, the fit of the IAE and arm crossing times depends on the difference , and if our assumed value of eventually needs revision, then so too will the spiral pattern speed need adjustment. For example, Reid & Brunthaler (2004) derive an angular rotation speed of km s-1 kpc-1 for the local standard of rest based upon Very Long Baseline Array observations of the proper motion of Sgr A⋆ with respect to two extragalactic radio sources. If we suppose the local Galactic rotation curve is flat, then km s-1 kpc-1, where kpc is the Sun’s mean Galactocentric distance. Adopting this value results in a spiral pattern speed of . Second, our calculation ignores any orbital perturbations caused by close encounters with giant molecular clouds that cause an increase in the Sun’s motion with respect to a circularly rotating frame of reference. Nordström et al. (2004) present of a study of the ages and velocities of Galactic disk stars that indicates a net increase in the random component of motion proportional to time raised to the exponent 0.34. Thus, we would expect that the Sun’s random speed has increased through encounters by only over the last 500 Myr, too small to change the orbit or the arm crossing times estimates significantly. Third, we have ignored the deviations in the gravitational potential caused by the arms themselves. The Sun presumably slows somewhat during the arm crossings so that the duration of the passage is longer than indicated in our model, but since our model of the gravitational potential represents an azimuthal average, the derived orbital period and interarm crossing times should be reliable.
Leitch & Vasisht (1998) argue that mass extinctions may also preferentially occur during spiral arm crossings. However, they proposed that a spiral pattern speed of km s-1 kpc-1 is required to find consistency between times of mass extinctions and spiral arm crossings, and if correct, then the relationship between ice ages and arm crossings would apparently be ruled out because km s-1 kpc-1 is too large for the inter-arm crossing time to match the intervals between IAE (see Fig. 2 and Fig. 3). We show the times of the five major mass extinctions as X signs in Figures 1 – 3 (Raup & Sepkoski, 1986; Benton, 1995; Matsumoto & Kubotani, 1996). We see that in fact the lower value of km s-1 kpc-1 ( km s-1 kpc-1, as shown in Fig. 3) also leads to a distribution of mass extinction times that fall close to or within a spiral arm passage, so the association of mass extinctions with arm crossings may also be viable in models with pattern speeds that are consistent with the ice age predictions.
Our calculation of the Sun’s motion in the Galaxy appears to be consistent with the suggestion that ice age epochs occur around the times of spiral arm passages as long as the spiral pattern speed is close to km s-1 kpc-1. However, this value is somewhat slower than the km s-1 kpc-1 preferred in recent dynamical models of the Galaxy (Amaral & Lepine, 1997; Bissantz et al., 2003; Martos et al., 2004). The resolution of this dilemma may require more advanced dynamical models that can accommodate differences between pattern speeds in the inner and outer parts of the Galaxy (for example, a possible resonance between the four-armed spiral pattern moving with km s-1 kpc-1 and a “two-armed” inner bar moving with km s-1 kpc-1; Bissantz et al. 2003).
References
- Amaral & Lepine (1997) Amaral, L. H., & Lepine, J. R. D. 1997, MNRAS, 286, 885
- Benton (1995) Benton, M. J. 1995, Science, 268, 52
- Binney & Tremaine (1987) Binney, J., & Tremaine, S. 1987, Galactic Dynamics (Princeton: Princeton Univ. Press)
- Bissantz et al. (2003) Bissantz, N., Englmaier, P., & Gerhard, O. 2003, MNRAS, 340, 949
- Blitz et al. (1983) Blitz, L., Fich, M., & Kulkarni, S. 1983, Science, 220, 1233
- Cordes & Lazio (2003) Cordes, J. M., & Lazio, T. J. W. 2003, preprint (astro-ph/0301598)
- Crowell (1999) Crowell, J. C. 1999, Pre-Mesozoic Ice Ages: Their Bearing on Understanding the Climate System, Mem. Geological Soc. Am., 192
- Dame et al. (2001) Dame, T. M., Hartmann, D., & Thaddeus, P. 2001, ApJ, 547, 792
- Dehnen & Binney (1998a) Dehnen, W., & Binney, J. J. 1998a, MNRAS, 298, 387
- Dehnen & Binney (1998b) Dehnen, W., & Binney, J. 1998b, MNRAS, 294, 429
- Eichkorn et al. (2002) Eichkorn, S., Wilhelm, S., Aufmhoff, H., Wohlfrom, K. H., & Arnold, F. 2002, Geophysical Research Lett., 29, 10.1029/2002GL015044
- Feast & Whitelock (1997) Feast, M., & Whitelock, P. 1997, MNRAS, 291, 683
- Fernández et al. (2001) Fernández, D., Figueras, F., & Torra, J. 2001, A&A, 372, 833
- Frakes et al. (1992) Frakes, L. A., Francis, J. E., & Syktus, J. I. 1992, Climate modes of the phanerozoic: the history of the earth’s climate over the past 600 million years (Cambridge: Cambridge Univ. Press)
- Gordon (1978) Gordon, M. A. 1978, ApJ, 222, 100
- Harrison & Aplin (2001) Harrison, R. G., & Aplin, K. L. 2001, J. Atmospheric Terrestrial Physics, 63, 1811
- Holmberg et al. (1997) Holmberg, J., Flynn, C., & Lindegren, L. 1997, in Proceedings of the ESA Symposium Hipparcos Venice ’97 (ESA SP-402), ed. B. Battrick (Noordwijk: ESA/ESTEC), 721
- Ibata & Gilmore (1995) Ibata, R. A., & Gilmore, G. F. 1995, MNRAS, 275, 605
- Imbrie et al. (1992) Imbrie, J., et al. 1992, Paleoceanography, 7 (#6), 701
- Jenkins (1992) Jenkins, A. 1992, MNRAS, 257, 620
- Leitch & Vasisht (1998) Leitch, E. M., & Vasisht, G. 1998, New A, 3, 51
- Marsh & Svensmark (2000) Marsh, N. D., & Svensmark, H. 2000, Phys. Rev. Lett., 85, 5004
- Martos et al. (2004) Martos, M., Hernandez, X., Yáñez, M., Moreno, E., & Pichardo, B. 2004, MNRAS, 350, L47
- Matsumoto & Kubotani (1996) Matsumoto, M., & Kubotani, H. 1996, MNRAS, 282, 1407
- Nordström et al. (2004) Nordström, B., et al. 2004, A&A, 418, 989
- Raup & Sepkoski (1986) Raup, D. M., & Sepkoski, J. J. 1986, Science, 231, 833
- Rautiainen & Salo (1999) Rautiainen, P., & Salo, H. 1999, A&A, 348, 737
- Reid & Brunthaler (2004) Reid, M. J., & Brunthaler, A. 2004, ApJ, 616, 872
- Russeil (2003) Russeil, D. 2003, A&A, 397, 133
- Shaviv (2002) Shaviv, N. J. 2002, Phys. Rev. Lett., 89, 051102
- Shaviv (2003) Shaviv, N. J. 2003, New A, 8, 39
- Shaviv & Veizer (2003) Shaviv, N. J., & Veizer, J. 2003, GSA Today, 13, #7, 4
- Stothers (1998) Stothers, R. B. 1998, MNRAS, 300, 1098
- Veizer et al. (2000) Veizer, J., Godderis, Y., & François, L. M. 2000, Nature, 408, 698
- Wainscoat et al. (1992) Wainscoat, R. J., Cohen, M., Volk, K., Walker, H. J., & Schwartz, D. E. 1992, ApJS, 83, 111
- Yeghikyan & Fahr (2004) Yeghikyan, A., & Fahr, H. 2004, A&A, 425, 1113


| Ice Age | Crowell (1999) | Frakes et al. (1992) | Veizer et al. (2000) | Shaviv (2003) | Arm Crossing (Fit #2) |
|---|---|---|---|---|---|
| Epoch | (Myr BP) | (Myr BP) | (Myr BP) | (Myr BP) | (Myr BP) |
| 1 | 30 | 20 | 80 | ||
| 2 | 155 | 144 | 180 | 160 | 156 |
| 3 | 319 | 293 | 310 | 310 | 310 |
| 4 | 437 | 440 | 450 | 446 | 446 |
| Fit | IAE | IAE | |||
|---|---|---|---|---|---|
| Number | Times | Sample | (kpc) | (kpc) | (km s-1 kpc-1) |
| 1 | Midpoint | 1 – 4 | 8.0 | 2.40 | |
| 2 | Midpoint | 2 – 4 | 8.0 | 2.40 | |
| 3 | Midpoint | 2 – 4 | 8.5 | 2.55 | |
| 4 | Midpoint | 2 – 4 | 8.0 | 2.80 | |
| 5 | Starting | 1 – 4 | 8.0 | 2.40 | |
| 6 | Starting | 2 – 4 | 8.0 | 2.40 |