Vegetation’s Red Edge: A Possible Spectroscopic Biosignature of Extraterrestrial Plants
Abstract
Earth’s deciduous plants have a sharp order-of-magnitude increase in leaf reflectance between approximately 700 and 750 nm wavelength. This strong reflectance of Earth’s vegetation suggests that surface biosignatures with sharp spectral features might be detectable in the spectrum of scattered light from a spatially unresolved extrasolar terrestrial planet. We assess the potential of Earth’s step-function-like spectroscopic feature, referred to as the “red edge”, as a tool for astrobiology. We review the basic characteristics and physical origin of the red edge and summarize its use in astronomy: early spectroscopic efforts to search for vegetation on Mars and recent reports of detection of the red edge in the spectrum of Earthshine (i.e., the spatially integrated scattered light spectrum of Earth). We present Earthshine observations from Apache Point Observatory to emphasize that time variability is key to detecting weak surface biosignatures such as the vegetation red edge. We briefly discuss the evolutionary advantages of vegetation’s red edge reflectance, and speculate that while extraterrestrial “light harvesting organisms” have no compelling reason to display the exact same red edge feature as terrestrial vegetation, they might have similar spectroscopic features at different wavelengths than terrestrial vegetation. This implies that future terrestrial-planet-characterizing space missions should obtain data that allow time-varying, sharp spectral features at unknown wavelengths to be identified. We caution that some mineral reflectance edges are similar in slope and strength to vegetation’s red edge (albeit at different wavelengths); if an extrasolar planet reflectance edge is detected care must be taken with its interpretation.
1 Introduction
The search for extrasolar terrestrial planets is in large part motivated by the hope of finding signs of life or habitability via spectroscopic biosignatures. Spectroscopic biosignatures are spectral features that are either indicative of a planetary environment that is hospitable to life (such as the presence of liquid water) or of strong indicators of life itself (such as abundant O2 in the presence of CH4). Most attention so far has been given to atmospheric biosignatures, gases such as O2, O3, H2O, and CH4 (Des Marais et al. 2002). Instead we focus on a potential surface biosignature. An ideal surface biosignature would be produced by a large and abrupt change in the reflectance at wavelengths that penetrate to the planetary surface. Earth has one such surface biosignature: the vegetation red edge spectroscopic feature (Figure 1).
Over one hundred extrasolar giant planets are currently known to orbit nearby sun-like stars222http://exoplanets.org/,333http://obswww.unige.ch/udry/planet/coralie.html,444http://cfa-www.harvard.edu/planets/(e.g., Butler et al. 2003; Mayor et al. 2003). These planets have been detected by the radial velocity method, which measures the star’s line-of-sight motion due to its orbit about the planet-star common center of mass. Therefore, with the exception a half-dozen known transiting planets, only the minimum mass and orbital parameters are known. Many efforts are underway to learn more about extrasolar planets’ physical properties from ground-based and space-based observations and via proposed or planned space missions. Direct detection of scattered or thermally emitted light from the planet itself is the only way to learn about many of the planet’s physical characteristics. Direct detection of Earth-size planets, however, is extremely difficult because of the extreme proximity in the sky of the parent star that is typically to times brighter than the planet.
Terrestrial Planet Finder555http://planetquest.jpl.nasa.gov/TPF/tpf_index.html (TPF) is being planned by NASA to find and characterize terrestrial planets in the habitable zones666The habitable zone is defined as the annulus around the star where the planet equilibrium temperature range is consistent with surface liquid water (Kasting, Whitmire, & Reynolds 1993). of nearby stars. NASA is currently planning both a visible-wavelength mission (launch date 2014) and a mid-infrared-wavelength mission (launch date 2019) for TPF. The ESA Darwin777http://sci.esa.int/home/darwin/index.cfm mission at mid-infrared wavelengths has similar science goals. The primary focus for both of these space missions is the direct detection of extrasolar terrestrial planets and the spectroscopic characterization of their atmospheres. In addition to the previously mentioned atmospheric biosignatures, O2, O3, H2O, and CH4, other atmospheric features such as CO2 and Rayleigh scattering as well as physical characteristics such as temperature and planetary radius could be constrained from low-resolution spectra (see e.g., Seager 2003). Beyond TPF, NASA is contemplating a series of increasingly ambitious astrobiology missions with evocative names such as Life Finder and Planet Imager.
New ideas are being developed to maximize science return from TPF. We have shown (Ford, Seager & Turner 2001) that several important planetary characteristics could also be derived from photometric measurements of the planet’s time domain variability at visible and near infrared wavelengths. A time series of photometric data of a spatially unresolved Earth-like planet could reveal a wealth of information such as the existence of weather, the planet’s rotation rate, presence of large oceans or surface ice, and existence of seasons. This would be possible for other planets if the observed light is scattered by at least two different scatterers which have significant differences in their albedo, color, or directionality of scattering. The amplitude variation of the time series depends on cloud-cover fraction; more cloud cover raises the average albedo of the planet and makes it more photometrically uniform, thus reducing the fractional variability. The signal-to-noise necessary for photometric study would be obtained by any mission capable of measuring the sought-after atmospheric biosignature spectral features. Furthermore, the photometric variability could be monitored concurrently with a spectroscopic investigation, as was done for the transiting extrasolar giant planet HD209458b (Charbonneau et al. 2002).
Serious attention to the possibility of spectroscopic detection of surface biosignatures on extrasolar plants is relatively recent, even though interest in spectroscopic signatures of vegetation on planets in the Solar System has a long history (see Section 3). The pioneering detection of the Earth’s vegetation red edge feature in the spectrum of Earthshine by Woolf et al. (2002) and Arnold et al. (2002) has given the topic of surface biosignatures an empirical basis (see Section 3 for more details). In addition to the Woolf et al. (2002) and Arnold et al. (2002) observational studies, there have been theoretical discussion papers about surface biosignatures. Wolstencroft & Raven (2002) give a detailed discussion of the likelihood that O2-producing photosynthesis will develop on Earth-like extrasolar planets. They consider chemical, astrophysical, climatological, and evolutionary processes to explore extrasolar photosynthetic mechanisms and detectability. They conclude that, despite many uncertanties and alternate possibilities, photosynthesis is likely to develop on many Earth-like planets and that its mechanism might well be identical to terrestrial photosynthesis. The exception is planets orbiting stars much cooler than the Sun; in this case they postulate mechanisms able to employ lower energy photons via multiple photon photochemical processes would still allow photosynthesis, with the 3- or 4-photon process photosynthesis implying a red-edge at longer wavelengths. Due primarily to skepticism about the practicality of a TPF-type mission in the optical and near-IR spectral bands, they conclude that detection of a red edge spectroscopic feature is impractical and that atmospheric oxygen is a much more promising photosynthesis biosignature. Knacke (2003) focuses on the spectroscopic detection of microbial life. Single-celled microbial life is the dominant portion of Earth’s biomass today888Microbial cell numbers on Earth are estimated to be on the order of , with the total amount of carbon in these cells equal to that in all plants on Earth, and the total nitrogen and phosphorus content 10 times that of all plant biomass (Madigan et al. 2002). (Madigan, Martinko, & Parker 2002) and for the majority of time of life on Earth microbial life was the only life on Earth. On Earth microbe colonies form large aggregates in oceans (and sometimes on land); algae and plankton colonies have spectroscopic features due to chlorophylls and related photosynthetic pigments. Knacke (2003) points out, however, that visible wavelength microbial signatures are confused by the much stronger atmospheric reflectance, and any red edge feature redward of 600 to 700 nm would be extremely weak due to the high opacity of sea water at those wavelengths. Techniques to detect microbial life will be essential if microbial life is common but multi-cellular life is rare in extraterrestrial environments. The best chance for detection and study of microbes will be with post-TPF/Darwin type missions.
For the purposes of this paper we assume that it will be possible to carry out a TPF-like space mission at visible to near IR wavelengths either in the next decade or at some later time. We believe that searching for spectroscopic signatures of light harvesting organisms, (i.e., spectroscopically resembling terrestrial plants) is an exciting science goal that will be carried out for at least some TPF targets.
The vegetation red edge feature’s relevance and usefulness as a surface biosignature for astrobiological studies remain open to question and are the topics of this paper (see also the conference proceedings by Seager & Ford (2004) for a preliminary discussion.) In Section 2 of this paper we summarize relevant current knowledge of the red edge as it occurs in terrestrial vegetation, including its physical origin. Section 3 briefly reviews early attempts to search for vegetation on Mars via spectroscopic signatures and recent reports of detection of the red edge in Earthshine. The role of temporal variability in the detection of surface biosignatures is described in Section 4. Observations of the Earthshine feature are also reported in Section 4, including temporal behavior that supports the identification of the observed spectroscopic feature with plants on the Earth’s surface. In Section 5 we speculatively, but critically, consider the likelihood that the same red edge feature seen on Earth would occur for vegetation on another world. In Section 6 we point out the possibility of confusion of the vegetation red edge reflectance feature with mineral edge reflectance features. Finally, we draw some tentative conclusions in Section 7.
2 Earth’s Vegetation Red Edge Spectral Feature
2.1 Empirical Characteristics
Land-based chlorophyll-producing vegetation has a very strong rise in reflectivity at around 700 nm by a factor of five or more. This “red-edge” spectral signature is much larger than the familiar chlorophyll reflectivity bump at 500 nm, that gives vegetation its green color. Figure 1 shows a deciduous plant leaf reflection spectrum (Clark et al. 1993). The high absorptance at UV wavelengths (not shown) and at visible wavelengths is by chlorophyll and is used by the leaf for photosynthesis. Photosynthesis is the process by which plants and some other organisms use energy from the sun to convert H2O and CO2 into sugars and O2. The primary molecules that absorb the light energy and convert it into a form that can drive this reaction are chlorophyll A (absorption maxima in diethyl ether at nm and nm) and chlorophyll B (absorption maxima in diethyl ether at nm and nm).
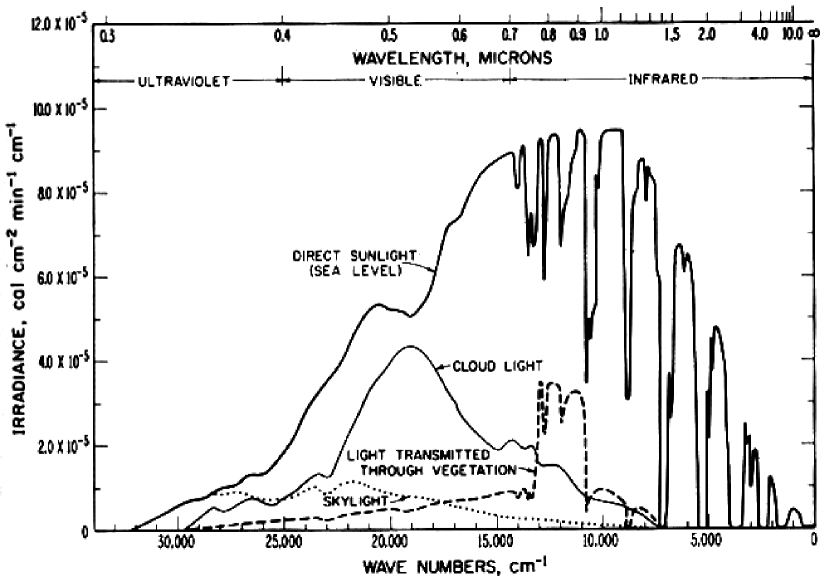
A deciduous plant leaf is strongly reflective between 700 nm and 1000 nm.999If human vision were sensitive a little further toward the red, the natural world would be a very different in appearance: plants would be very red and exceedingly bright (see Figure 2). Figure 2 shows that the leaf also has a very high transmittance at these same wavelengths, such that reflectivity plus transparency is near 100% at near-IR wavelengths. Remarkably, the bulk of the energy in solar radiation (Figure 3) at sea level is at approximately 600 to 1100 nm—the same wavelength region where the deciduous leaf reflects or transmits almost all of the solar radiation (Gates et al. 1965). The exact wavelength and strength of the red edge depends on the plant species and environment. Although negligible from the biosignature detection view point, it is interesting to note that the specific wavelength dependence and strength of the red edge feature is used for remote sensing of specific locations on Earth to identify plant species and also to monitor a field of vegetation’s (such as crops) health and growth as the red edge changes during the growing season. It is also useful to note that even conifers and desert plants have similar red edge features (see Clark et al. 1993).
In the near-infrared (Figure 1), plants also have water absorption bands. The band strength depends on plant water content, weather conditions, plant type, and geographical region. These absorption features can be strong, on the order of 20% for the water bands at 1.4 and 1.9 m, but are not very useful for identifying life, since they would only be indicative of water and would likely not be distinguishable from atmospheric water vapor.
Ocean plankton blooms near coastal shores are colorful and large-scale (e.g., Behrenfeld et al. 2001; Knacke 2003). The color change in plankton blooms are due to the increased presence of chlorophyll—causing the presence of the 500 nm reflectance peak. Unfortunately, the change in intensity is small for a spatially unresolved extrasolar planet, especially when considering the low reflectivity of Earth’s oceans and the small area of plankton blooms compared to a large part of a hemisphere.
2.2 Physical Nature
A typical plant leaf spectrum exhibits the two different behaviors of leaves: a strong absorption in the visible, and high scattering (transmission + reflection) in the very near IR (750-1300 nm), sometimes called the “red edge” or “infrared plateau” by vegetation remote sensing experts (Figure 2). The large-scale physical structure of leaves (the layers of cells and gaps between them) promotes scattering and therefore within a plant leaf absorption only occurs at wavelengths where specific chemical pigments or molecules absorb light. The visible-wavelength absorbers are determined to be chlorophylls or other pigments experimentally: in “variegated” plant leaves (leaves that are both green and white) the white part of the leaf has a reflectance as high in the visible as at near-IR wavelengths; and chlorophyll pigments are very absorptive at visible wavelengths but are not at all absorptive at near-IR wavelengths (Knipling 1970 and references therein). Water absorbs portions of the near-IR reflectance spectrum. The wavelengths of water absorption bands are well known and confirmation of water as the near-IR absorber has been shown with dehydrated leaves which have a much higher near-IR reflectance spectra than hydrated leaves (Knipling 1970).
Plant leaves are highly reflective at near-IR wavelengths; few substances in nature reach this level of reflectivity. The reason a plant leaf is so highly reflective (and transmittive) is due to the leaf construction—structures at all scales make light scattering highly efficient (see e.g., Gates et al. 1965; Knipling 1970). The inside of a leaf is made up of water-filled cells with air gaps surrounding the cells. Light reflects off of the cell walls but also refracts through cell walls from the surrounding air gaps between cells. Inside the cell, light keeps scattering (except at pigment-absorbing wavelengths) until it exits the cell. Two causes keep light scattering inside the cell. Primarily, the high change in the index of refraction (from 1.33 for water to 1.00 for air) makes efficient internal reflection inside the water-filled cells at the interface between cell walls and the surrounding air gaps. Secondarily, light will Mie or Rayleigh scatter off of the cell’s organelles which have sizes on the order of the wavelength of light. Conclusive evidence of the importance of the internal reflection to the plant leaf’s high reflectance was shown by Knipling (1970). A water infiltrated leaf with water filling the cavities between cells to form a continuous liquid water medium in the plant leaf, has a high transmittance at the expense of lower reflectance. In other words, without internal reflection inside cells, most of the light entering the top of the leaf would travel down and exit out of the bottom leaf surface, but when cells are surrounded by an air gap a significant fraction of the incoming light is redirected upwards by repeated internal reflections. The leaf surface contributes only a small amount to reflectance (Knipling 1970) by either specular reflection or scattered light. The amount of reflection depends on the presence of leaf surface wax (increasing reflection at visible (e.g., Grant 1987) and near-IR wavelengths (e.g., Slaton et al. 2001)) and distribution, size, shape and angles of any hairs present (either increasing or decreasing reflectance; Grant 1987). Only at large angles of incidence is radiation predominantly reflected by leaf surface specular reflection compared to leaf interior reflection (Grant 1987).
Eventually, the radiation will scatter out of the leaf; designated “reflected” at the top or “transmitted” at the bottom. To support the explanation that radiation is scattered or transmitted everywhere except at wavelengths with absorption, Figure 2 shows that a leaf’s reflectance and transmittance spectrum are very similar. The magnitude, wavelength dependence, and ratio of the reflectance and transmittance is a complex function of the cell size and shape and the size and shape of the air gaps between the cells and hence depends on plant type. 3D Monte Carlo simulations are able to reproduce reflection and transmission spectral properties of plant leaves (e.g., Govaerts et al. 1996).
The overall reflectance of a plant is lowered by the plant canopy. The canopy effects include leaf orientation, shadows, and non foliage background surfaces such as soil (Knipling 1970). Leaf orientation, or specifically the angle of incidence and reflectance of radiation, is important since leaves scatter light anisotropically. Reflection at visible wavelengths is reduced by the canopy by approximately twice as much (40% of a single leaf) as reflection at near-IR wavelengths (70% of a single leaf) (Knipling 1970). This effect actually enhances the red-edge amplitude and is due to the near-IR incident radiation reflecting off of lower leaves and retransmitting upward through upper leaves.
The high ratio of absorbed to scattered (reflected + transmitted) radiation on either side of the red edge is not fully understood. One explanation uses environmental adaptation. If plants absorbed solar radiation with the same efficiency at longer wavelengths than the red edge compared to visible wavelengths, then the plants would become too warm and the proteins irreversibly damaged (Gates et al. 1965). Gates & Benedict (1963) have shown that approximately 75% of the total energy absorbed by plants is reradiated, while approximately 25% is dissipated by convection and transpiration. Therefore, although thermal regulation is partially controlled by leaf stomata and water vapor content, radiation balance must also play a role in thermal regulation. It is likely that a plant balances the competing requirements of absorption of sunlight at wavelengths appropriate for photosynthesis reactions with efficient reflectance at other wavelengths to avoid overheating (Gates et al. 1965). Alternate to the environment adapation argument is an argument that the cell spacings that cause the high near-IR reflectance evolved for reasons other than thermal balance. The large intercelluar spaces aid gas exchange (Konrad et al. 2000) and increase the absorption of photosynthetically active radiation (DeLucia 1996). The thermal regulation argument is further weakened by the belief that higher plants evolved from aquatic ancestors; aquatic vegetation is less subject to overheating due to close thermal coupling with the ambient water.
3 Red Edge Observations within the Solar System
3.1 Spectroscopic Searches for Vegetation on Mars
During the early part of the last century, speculation about vegetation on Mars was fueled by reports of a wave of darkening that appeared during many martian springs (Lowell 1904; Sinton 1958 and references therein). This wave of darkening changed large dull colored regions to darkish green hues and proceeded from pole to equator within a few weeks of the disappearance of the polar caps. The proposed explanation was that the vegetation was nourished by the melting polar snow. Although other explanations were put forth, for proponents of life on Mars the vegetation theory was second in popularity only to the martian canals. Because the spectrum of vegetation (Figure 1) is different from other green materials, remote sensing was used to test the Earth-like vegetation hypothesis. By taking spectra of different areas of Mars with a large telescope (72”), Millman (1939) was able to rule out Earth-like vegetation based on measurements of the absence of a 500 nm chlorophyll bump. Others used the red edge reflectance to rule out the vegetation hypothesis (Slipher 1924; Tickhov 1947; Kuiper 1952). Later it was shown that the darkening on Mars was caused by changes due to windblown dust (Sagan and Pollack 1969 and references therein).
In the 1950s new excitement and controversy arose from Sinton’s (1957) claim of evidence for vegetation on Mars. Sinton observed near-IR absorption features of organic molecules that were also observed to be present in lichen and some dried plants. Specifically, the C-H vibration bands occur in the 3 to 4 m region. Sinton argued that Mars may have vegetation similar to the hardiest vegetation on Earth: lichens (a symbiosis of fungi and algae). Lichens show the C-H near-IR absorption bands but lack the red-edge vegetation spectrum even though they carry out photosynthesis. This theory of vegetation on Mars was ruled out in the early 1960s when two of the observed C-H absorption bands were identified as deuterated water in Earth’s atmosphere (Rea et al. 1965).
3.2 Observing Earth as a Reference Case Extrasolar Planet
Because Earth is the only planet known to harbor life it is the obvious and only test case of techniques for the search for life on extrasolar planets.
Sagan et al. (1993) used the Galileo spacecraft for a “control experiment” to search for life on Earth using only conclusions derived from data and first principle assumptions. En route to Jupiter, the Galileo spacecraft used two gravitational assists at Earth (and one at Venus). During the December 1990 fly-by of Earth, the Galileo spacecraft took low-resolution spectra of different areas of Earth. In addition to finding “abundant gaseous oxygen and atmospheric methane in extreme thermodynamic disequilibrium”, Sagan et al. (1993) found “a widely distributed surface pigment with a sharp absorption edge in the red part of the visible spectrum” that “is inconsistent with all likely rock and soil types”. Observing 100 km2 areas of Earth’s surface the vegetation red edge feature showed up as a reflectance increase of a factor of 2.5 between a band centered at 670 nm and one at 760 nm. In contrast there was no red-edge signature from non-vegetated areas.
A new technique for observing the Earth as an extrasolar planet test case is now emerging: using Earthshine to study the spatially unresolved Earth. These studies are similar to Sagan et al.’s (1993), but they utilize Earth’s spatially integrated light as if Earth were a point source, instead of areas of 100 km2. Earthshine is sunlight that has been scattered by the Earth toward the Moon and then back to Earth. It is often visible as a faint glow on the otherwise dark region of the lunar disk during crescent phases. Earthshine can be studied with a CCD camera and specialized coronagraph even as the Moon waxes (Goode et al. 2001). The very rough lunar surface makes the Moon a diffuse reflector with each point on the Moon reflecting the spatially integrated illumination from the Earth. The viewing geometry of Earth is the sunlit illuminated portion of the Earth as seen from the Moon. A prescient paper by Arcichovsky (1912) proposed looking for vegetation signatures in Earthshine as a reference case for vegetation or chlorophyll searches on other planets. So, while activity and progress in Earthshine research is recent; the idea itself is an old one.
Earthshine observations can provide a valuable complement to existing satellite data sets that have been obtained for a wide variety of purposes and with diverse instruments. Since most satellite data are collected by looking nearly straight down at limited regions of the Earth’s surface and most often with relatively direct solar illumination angles, derivation of the integrated spectrum of the unresolved Earth with its varying atmospheric path lengths and solar illumination angles is not generally possible. Moreover, many satellite observations are obtained without attention to absolute flux calibration (because it is not necessary to the purposes for which the data were obtained) and thus cannot be combined with other data to derive an integrated spectrum. Thus, for the purpose of time domain comparisons of the unresolved Earth’s spatially integrated spectrum, Earthshine provides the best currently available information.
Recent spectral observations of Earthshine have tentatively detected the red edge feature at the 4 to 10% level. Woolf et al. (2002) observed the setting crescent moon from Arizona which corresponds to Earth as viewed over the Pacific Ocean. Nevertheless their spectrum (Figure 2 in Woolf et al. 2002) shows a tantalizing rise just redward of 700 nm which they tentatively identify with the red edge feature. The same figure also shows other interesting features of Earth’s visible-wavelength spectrum, notably O2 and H2O absorption bands (note that spectral lines of both O2 and H2O cut into the red-edge signature.) Arnold et al. (2002) made observations of Earthshine on several different dates. With observations from France the Earthshine on the evening crescent moon is from America and the Atlantic Ocean whereas the Earthshine on the morning crescent moon is from Europe and Asia. After subtracting Earth’s atmospheric spectrum to remove the contaminating atmospheric absorption bands, they find a vegetation red edge signal of 4 to 10%. However, note that it will be extremely difficult to subtract an unknown extrasolar planet’s atmospheric spectrum in the kind of low-signal-to-noise data expected with future space missions TPF and Darwin.
An alien civilization observing the spatially unresolved Earth with a TPF-like telescope would have difficulty in identifying the vegetation red-edge signature in medium spectral resolution data. While the red-edge spectroscopic feature is very strong for an individual plant leaf, at a factor of five or more, it is much reduced—down to several percent—when averaged over a (spatially unresolved) hemisphere of Earth. This is due to several effects, including extremely large vegetation-free regions of the Earth’s surface, the presence of clouds that block sight lines to the surface, anisotropic scattering by vegetation canopies, and soil characteristics. In addition, the reflectance of vegetation is anisotropic, so the illumination conditions and planet viewing angle are important. Nevertheless, at a signal level of a few to several percent Earth’s vegetation red edge is still a viable surface biosignature for a TPF-like mission. In favorable hypothetical cases, however, the feature could be much stronger than the ones so far observed in Earthshine. For example, if the planet cloud cover fraction is lower, a larger fraction of the surface is covered by vegetation, or a smaller fraction of the illuminated portion of the planet is visible (i.e., a crescent phase), the fractional amplitude of the red edge would be increased in the integrated spectrum.
In contrast to the red edge signature, the chlorophyll bump at 500 nm is extremely small in a hemispherically averaged spectrum of the Earth. The spectral signature of oceanic vegetation or plankton is also unlikely to be detectable with TPF/Darwin generation telescopes, due to strong absorption by particles in the water and the strong absorptive nature of liquid water at red wavelengths (see Knacke 2003).
In the next section we argue that temporal variability may be key for detection of weak but changing surface features such as the vegetation red edge feature.
4 Using Temporal Variability to Detect Surface Biosignatures
A time series of data in different bands should help make it possible to detect a small but unusual spectral feature, even with variable atmospheric features. As the continents rotate in and out of view, a planet’s brightness, colors and spectrum will change. Most of Earth’s surface features, such as sand or ice, have a continuous or minimal change in albedo with wavelength, in contrast to the abrupt vegetation red edge spectral feature.
We have shown (Ford, Seager, & Turner 2001) via simulations that the existence of different surface features on a planet may be discernible at visible wavelengths as different surface features rotate in and out of view. Considering a cloud-free Earth, the diurnal flux variation caused by different surface features could be as high as 200%. This high flux variation is not only due to the high contrast in different surface components’ albedos, but also to the fact that a relatively small part of the visible hemisphere dominates the total flux from a spatially unresolved planet. Clouds increase the Earth’s albedo, interfere with surface visibility, and reduce the fractional amplitude of the diurnal light curve to roughly 10–20%. Because cloud cover is stable for days over some regions, the rotational period of Earth could still be measured (Ford et al. 2001).
We here restrict our attention to diurnal time scales. However, any vegetation indicator might also display seasonal (on an orbital timescale) variations. In this section we describe Earthshine observations from two different Earth–Moon geometries made to detect temporal variation of the vegetation red edge signature.
4.1 APO Earthshine Observations
Spectra of Earthshine were obtained with the Double Imaging Spectrograph (DIS) on the Apache Point Observatory 3.5-meter telescope101010Based on observations obtained with the Apache Point Observatory 3.5-meter telescope, which is owned and operated by the Astrophysical Research Consortium. between 11:30 and 13:00 on 8 Feb 2002 (UT) with the Moon rising in the eastern sky and again between 01:00 and 01:30 on 16 Feb 2002 (UT) with the Moon setting in the western sky. As shown in Figure 4, the dark side of the Moon was illuminated by light scattered from quite different portions of the Earth’s surface on the two dates. About 20% of the visible portion of the Moon’s surface was illuminated by sunlight on the 8 Feb 2002 and about 10% on 16 Feb 2002. Airmass was necessarily high for both sets of observations, ranging from approximately 3 to 7, the latter being the approximate elevation limit of the telescope. The same spectroscopic setup was used on both dates; in particular a 150 lines/mm red blazed grating was used to obtain spectra of approximately 10 resolution with a 1.2 arcsec by 5 arcmin “bar slit”. Although the whole range from about 400 to 1000 nm was observed, we here concern ourselves only with the 600-900 nm range, roughly centered on the red edge feature and in which a relatively clean and high signal-to-noise spectrum could be extracted. The detector was an unthinned, and thus relatively unaffected by CCD fringing, 800x800 TI device.
During the 8 Feb 2002 observations, 8 exposures were obtained of the dark limb of the Moon (i.e., the Earthshine illuminated limb), followed by 3 exposures of a sunlit mountain peak just on the dark side of the lunar terminator and then followed by 7 more exposures on the dark limb. On 16 Feb 2002, due to a much shorter total available observing time, only 4 dark limb and 1 sunlit mountain top exposures were obtained. Dark limb exposures were made with the slit approximately centered on and perpendicular to the limb, so as to obtain both an Earthshine signal and a sky spectrum. Typical exposure times were 60 sec on the dark limb and 10 sec on the sunlit mountain peaks. Exposures with the “slit viewer” target acquisition camera indicated that it would be impossible to obtain DIS exposures of the fully sunlight illuminated bright limb without saturating the detector, even with the shortest available shutter times; the availability of small (spatially unresolved) areas of sunlit lunar surface on mountain tops just beyond the terminator nevertheless enabled us to obtain high signal-to-noise bright side spectra well within the CCD detector’s linear response regime.
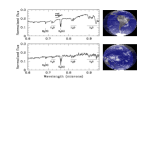
The data reduction and extraction of the Earthshine spectra followed the general technique and procedures of Woolf et al. (2002) and Arnold et al. (2002) who first reported the possible detection of the red edge feature in an Earthshine spectrum. Standard IRAF image processing and spectral reduction routines were used with the exception of sky subtraction for the dark limb exposures, as described below. First, standard bias frame subtraction and flat fielding corrections were carried out for each exposure. A sky contribution to the dark limb spectra was determined by a linear extrapolation of the observed sky counts at each wavelength to each position along the part of the slit positioned on the lunar surface. Visual examination of the sky counts versus position along the slit beyond the lunar limb established that the linear extrapolation was an adequate representation of the spatial variation of sky brightness due to scattering from the nearby (in the sky) bright lunar crescent. Sky subtraction for the bright side spectra was made in the conventional way by subtracting an interpolation between the dark areas on either side of the sunlit mountain peaks but was in any case so small as to be insignificant. The resulting dark limb spectra were then averaged over about 30 arcsec of the slit’s length across the lunar surface, both to improve signal-to-noise and average out any fluctuations in the wavelength dependence of the lunar albedo (i.e., changes in the color of the lunar surface). Unfortunately, no such averaging was possible of the spectra of the lunar mountain tops, and as a result, any difference between their wavelength dependent albedo and that of the averaged areas observed on the dark limb will appear as systematic noise, and perhaps a spurious feature, in our final Earthshine spectra. Finally, the spectra of the dark limb were divided by those of the sunlit mountain peaks and averaged together to give a spectrum of the Earthshine that illuminated the dark side of the Moon on each of the two dates. These are shown in Figure 4 along with a representation of the Earth as it appeared from the Moon111111http://www.fourmilab.ch/earthview/vplanet.html at the times of the observations. The nominal signal-to-noise ratio of these spectra is in the range of 30 to 100 per resolution element with a significant contribution from high spatial frequency CCD flat field features, but the true uncertainty in the spectra is almost certainly dominated by potential systematic errors discussed in the next section.
4.2 Interpretation of APO Earthshine Spectra
The most important conclusion to be drawn from the spectra shown in Figure 4 is that they appear to confirm the tentative identification of the 700–750 nm feature, seen in the Earthshine spectra of Woolf et al (2002) and Arnold et al.(2002), as actually being due to the red edge in the spectral reflectance curves of the leaves of deciduous terrestrial plants. This conclusion is based on the fact that a similar feature to the Woolf et al. (2002) and Arnold et al. (2002) feature occurs in our “vegetation-covered” Earth spectrum but not in our non-vegetation-covered Earth spectrum. In our vegetation covered spectrum from 8 Feb 2002 the Moon was illuminated by light scattered from large land areas that are covered by heavy vegetation—most notably the extensive forests of South America. In our non-vegetation covered spectrum of 16 Feb 2002, the Moon was primarily illuminated by light scattered off of parts of the Earth’s surface that contain no deciduous vegetation—primarily the South Pacific Ocean. Thus, at a crude and qualitative level at least, the presence and absence of the red edge feature correlates with the presence and absence of large quantities of plant life in the sunlight illuminated portion of the Earth as seen from the Moon.
Spectral slope is routinely used to quantify detections of the red edge via satellite observations of the Earth. In the vegetation-covered APO spectrum the continuum level of the Earthshine rises by 17 +/- 2% between 700 and 750 nm. In contrast, the non-vegetation-covered APO Earthshine spectrum has an increase of only 11 +/- 2% over the same wavelength range121212Turbull et al. (in preparation) suggests that the gradual increase in slope of the spectra throughout the entire wavelength range is due to the difference in lunar albedo as a function of phase angle; the dark part of the moon is illuminated by Earthshine at a phase angle roughly near 10 degrees whereas the bright crescent moon is illuminated by the sun closer to 170 degrees. These values appear plausibly consistent with the 6% increase reported by Woolf et al. (2002) and of 4 to 10% reported by Arnold et al. (2002) in spectra of Earthshine produced by light scattered from various other parts of the Earth’s surface.
The change in the slope of the continuum in the vegetation-covered case is even more striking; the slope is 14 +/- 3 times larger between 700 and 750 nm than between 650 and 700 nm! This abrupt break corresponds to the ramp-like appearance of the continuum at the red edge location in the 8 Feb spectrum shown in Figure 4. The non-vegetation-covered spectrum also shows a mild reddening of the continuum slope, by a factor of about 2.5 +/- 0.5, in a comparison of the same two wavelength intervals. This much smaller feature could be due to a minor red edge contribution to Earthshine from plants near the illuminated limb of the Earth (as seen from the Moon), but it is not significantly bigger than changes in the continuum slope at other wavelengths due to gentle bumps and dips in the spectrum’s overall shape. Thus we cannot claim secure detection of any feature at the red edge location in the 16 Feb data.
Although a more quantitative comparison of the expected and observed strength of the feature would be possible via calculations such as those reported by Ford et al. (2001), we do not believe that the quality and limited quantity of the currently available data justify such a comparison. However, it is clear that a more well-developed data set of Earthshine spectra, taken at different moon phases and times (seasons), as well as from different locations on the Earth’s surface, could unambiguously establish the association of the 750 nm feature with the red edge of vegetation, as well as document its variability. Such data would also be very useful for purposes of testing and validating models of the Earth’s photometric properties such as that developed by Ford et al. (2001).
The spectra shown in Figure 4 display two additional characteristics that merit comment: 1) a variation in the strength of the water vapor lines between the 8 Feb and 16 Feb 2002 spectra and 2) another strong increase in brightness around a wavelength of 850 nm.
Taking them in turn, the water vapor line variability is likely due to differences in the average water vapor column density in the Earth’s atmosphere over the illuminated regions on the two different dates of observation (see Figure 4). We note that the water vapor features do not show any systematic variation with airmass in subsets of the spectra obtained on either date. We caution, however, that there is a small chance that the water variation may nevertheless reflect imperfect cancellation or removal of the atmospheric water vapor in front of the telescope during the observations due, perhaps, to the high and rapidly changing airmass through which the observations were necessarily obtained.
We have found no plausible explanation for the 850 nm feature; it could be real and deserving of further investigation. It might also be artificial in the sense of arising not on Earth but from the Moon; in other words it might be due to a variation in the color of the lunar surface between the regions where the dark limb and the sunlit surface spectra were obtained, as described above in §4.1. Any such difference would not be removed by the division of the dark by the bright side spectra. We note, however, that both Earth-based (McCord et al. 1972) and spacecraft131313http://vims.artov.rm.cnr.it/data/res-moo.html measurements of the wavelength dependence of the albedo of lunar highland regions do not show any strong features at either the position of the red edge or near 850 nm. Whether the 850 nm feature is created at the Earth or on the Moon, it warns of the difficulties that may arise when searching for red edge-like spectral features on other planets. We note that the Earthshine spectrum by Woolf et al. (2002) shows a 7% decrease (approximately three times smaller change than we see at 850 nm) at wavelengths 780 nm and longer. Turnbull et al. (in preparation) also see a depression in their reflectance spectra at similar wavelengths.
These systematic uncertainties are not only relevant to the particular data presented here but also illustrate some of the intrinsic challenges of Earthshine observations using general purpose telescopes and instruments. The sunlit and Earthshine illuminated portions of the lunar disk differ in surface brightness by at least on the order of and are thus very difficult to observe with comparable signal-to-noise using the same equipment and instrumental configuration. Moreover, rapidly changing airmass and a very limited period of time available for the whole sequence of exposures are unavoidable consequences of observing a crescent moon from observatories at mid-latitudes. These time constraints make it impractical to reconfigure the instrumentation repeatedly to facilitate observations of the bright and dim portions of the lunar surface, e.g., by insertion and removal of a pupil plane diaphragm or a neutral density filter in a spectrograph that was not designed with such operations in mind. And, of course, the high airmasses associated with crescent moon configurations are directly problematic; they change significantly over a few minutes and thus even during and between fairly short exposures. Earthshine spectroscopy using special purpose instruments or instrument configurations either from polar regions of the Earth (Kilston, private communication, 2002) or orbiting telescopes (Davis et al. 2002; Woolf, private communication, 2001) could circumvent these difficulties.
5 Extrasolar Plants
The red edge will only be a useful tool for astrobiology if extrasolar vegetation also exhibit a similar extraordinary spectral signature. We have no firm basis for believing in the existence of extrasolar vegetation. It is nevertheless essential to keep in mind that the situation is qualitatively the same for every technique that can be used for the search for life in the Universe. Absent a fundamental, first principles understanding of biology that could predict what is possible and likely, we are forced to assume that extraterrestrial life resembles life on Earth to some degree. Assuming that extraterrestrial life has nothing at all in common with terrestrial organisms makes searching for it almost impossible. The opposite extreme of assuming that terrestrial and extraterrestrial life are exactly identical is simplistic and would lead to such narrowly focused search techniques that would risk missing most actual indications of extraterrestrial biology.
In this section we offer some of the relevant facts and arguments to inform the required educated guess. This is in contrast to Wolstencroft and Raven (2002) who use details of the photosynthesis mechanism to argue that the evolution of O2-producing photosynthesis is likely on extrasolar Earth-like planets. A few interesting points concerning terrestrial vegetation are useful for speculating on the possible existence of extrasolar plants or “light harvesting organisms” and potential magnitude of spectral features:
Plants absorb very strongly throughout the UV (at wavelengths longer than 380 nm) and the visible wavelength regions of the spectrum where photon energies are sufficient to drive photosynthesis (involving molecular electronic transitions);
At sea level (i.e., after atmospheric extinction) the solar energy distribution peaks at 1000 nm and approximately 50% of the energy is redward of 700 nm (Figure 3). Plants reflect and transmit almost 100% of light in the wavelength region where the direct sunlight incident on plants has the bulk of its energy (Gates et al. 1965);
Considering the above two points, Earth’s primary surface “light harvesting organism”, vegetation, may have evolved to balance the competing requirements of absorption of sunlight at wavelengths appropriate for photosynthesis reactions with efficient reflectance at other wavelengths to avoid overheating (Gates et al. 1965). The prime selective factor in evolution, however, is not known, and vegetation’s high reflectance and transmittance may instead have been selected for other traits, namely the large intercellular gas spaces aiding gas exchange (Konrad et al. 2000) and increasing the absorption of photosynthetically active radiation (DeLucia et al. 1996). Regardless of the evolutionary origin, the high reflection may be key to vegetation’s surival on land.
In addition to chlorophyll (Chl), many other light-absorbing pigments exist. Accessory pigments at different wavelengths (Figure 5) absorb photons and transfer energy to Chl a. These accessory pigments allow photosynthetic organisms to use a wide range of wavelengths of light. Specifically: Chl a is found in all photosynthetic organisms except some photosynthetic bacteria; Chl b is found in higher plants and green algae; accessory pigment carotene is found in all photosynthetic organisms except photosynthetic bacteria; phycoerythrin and phycocynanin (phycobilins) are found in red algae and cyanobacteria respectively. In addition to the variety of accessory pigments, the chlorophyll pigment itself comes in different forms with absorption maxima at different wavelengths. For example, photosynthetic bacteria (both aerobic and anaerobic) have bacteriochlorophyll (Bchl) pigments (Figure 5). The wavelength variation in the pigments makes some organisms better adapted to their ecological niches. For example, cyanobacteria (Chl a and phycocyanin) in lakes and ponds often form a dense surface layer, absorbing a large amount of blue and red light. Purple photosynthetic bacteria (Bchl a or b) and green photosynthetic bacteria (major pigment is Bchl c, d, or e) grow best in anaerobic conditions in deep water. At depth, the previously cyanobacteria-absorbed blue and red light is not available. The bacteriochlorophyll pigments allow the purple and green bacteria to take advantage of their ecological niche in deep water by absorption of longer wavelength light. In addition, Bchl a and b have absorption maxima at shorter wavelengths than Chl a, taking advantage of the deep water where shorter wavelength light can penetrate water farther.
While vegetation and other organisms use chlorophyll pigments to convert light to energy, there exists at least one alternate photosynthetic system using an independent pigment, rhodopsin. Bacteriorhodopsin (a type of rhodopsin) occurs in halobacteria (Oesterhelt & Stoeckenius 1971) found in highly salty environments, for example in the Dead Sea. Proteorhodopsin is found in marine bacterioplankton that are widespread in the surface ocean (Beja et al. 2001). The rhodopsin photosynthetic system is chemically fundamentally different from the chlorophyll photosynthetic system.
If we accept that extraterrestrial light-harvesting organisms should be ubiquitous, would they likely have a strong spectroscopic signature? Light harvesting organisms may have similar properties to vegetation in order to absorb the correct frequency energy for molecular transitions but not absorb all available energy. Light-harvesting pigments in vegetation cover the full range of the visible-light spectrum and many of these pigments have sharp spectral features at the red edge of the pigment’s absorbing range (Figure 5). Thus, extrasolar light harvesting organisms may have sharp spectral features similar to terrestrial vegetation’s red-edge spectral feature but at different wavelengths.
In some cases light harvesting organisms might have no strong spectroscopic signature. For example, a hypothetical light-harvesting organism that is absorptive at short visible wavelengths but purely transmissive at red and near-IR wavelengths would have no sharp spectroscopic features detectable by reflectance spectroscopy. A second example comes from terrestrial photosynthetic organisms. In addition to vegetation there is a large diversity of photosynthetic organisms (e.g., multi-cellular and unicellular algae and prokaryotic organisms such as cyanobacteria and green and purple bacteria). Over half the photosynthesis on Earth is carried out by microorganisms (Field et al. 1998). Many of these organisms live in water and some carry out anoxygenic photosynthesis—any spectral biosignature would be weakened in the spatially integrated global spectrum due to the high opacity of ocean water.
We favor the opinion that light harvesting organisms with pigments and spectral features at various wavelengths should be common over the idea that the red edge signature from terrestrial plants is widespread and universal (although the pigment “edge” may or may not be a sharp feature; see Figure 5). Given the abundance and ready availability of low-entropy energy in the form of radiation from the primary star, assuming a sufficiently transparent atmosphere, “light-harvesting” is likely to be a common feature of life, simply because it is such an effective biological strategy. In other words, if such a beneficial mechanism develops in any organism, it seems likely to be subject to strong positive evolutionary selection. Wolstencroft & Raven (2002) also conclude that light harvesting organisms with pigments and spectral features at different wavelengths should be common, by the different assumption that Earth-based photosynthesis should be common.
Evolution has an element of chance, and whatever light-harvesting mechanism develops first on a planet might be evolutionarily favored over other mechanisms that are theoretically more efficient. Thus, Earth-based photosynthesis is not necessarily the best or most efficient light-harvesting mechanism even for the conditions on Earth. Further, there is no compelling a priori reason to believe that organisms on other planets would independently develop a light-harvesting mechanism identical to the one found in terrestrial vegetation. Furthermore, many mechanisms evolved initially for other functions. For example, it has been suggested that chlorophyll arose from UV-screening, cell-surface proteins (Mulkidjanian & Junge 1997). The proteins that originally developed as a protective measure later evolved into using the absorbed radiation for energy. So, for example, organisms living on planets around stars cooler than the sun may have pigments at slightly different wavelengths (see Wolstencroft & Raven 2002 for a discussion of O2-producing photosynthesis around cool stars).
Our chain of reasoning does not lead to any definite conclusion; however it does give us some basis for an opinion: a red-edge-like spectroscopic signature, as a biosignature for astrobiology, is sufficiently promising to warrant the search for similar features in the spectra of extrasolar terrestrial planets using TPF-type and successor missions. If such a feature were detected with time variability and other systematic behaviors, we believe that it would be an extremely interesting clue that suggests the possible existence of light-harvesting organisms on the planet. On the other hand, we do not believe that a failure to detect a red-edge-like signature in the spectrum of an extrasolar terrestrial planet would provide any meaningful null result with respect to life on the planet.
6 False Positive Mineral Reflectance Edges
Semiconductor crystals also have spectral reflectance “edges” at or near visible wavelengths (Figure 6). The spectral reflectance edges are due to the valence electrons lacking available states for a certain range of energies. The semiconductor’s band gap is the energy difference between the valence shell band and the conduction band. Photons with enough energy are absorbed, since they can excite electrons from the valence band into the conduction band. Photons with energies less than the band gap, however, are absorbed and remitted with the same energy—i.e. reflected—by electrons within the valence band. At zero temperature, there is a sharp step function reflectance edge at the wavelength of the energy gap. At higher temperatures the reflectance edge is smooth and sloped, since there is a chance that an incident photon will excite an electron already above the ground state and the combined energy will be sufficient for the electron to jump the band gap. For many semiconductors, the band gap energy corresponds to the energy of photons in the visible to near-infrared portions of the spectrum. Therefore, mineral semiconductors will also have spectral reflectance edges at visible to near-infrared wavelengths. For example, cinnabar (HgS) is a mineral with a steep reflectance edge (Figure 6) at red wavelengths (600 nm). It is important to remember that the band gap phenomena is dependent on the crystalline structure of the semiconductor which creates a periodic potential for the impinging photon. Thus, if the physical size of the crystal does not significantly exceed the wavelength of the incident photons, then the spectra can be significantly altered by the shape and size of the crystals. In the solar system, most planetary surfaces are covered with a regolith that complicates the interpretation of mineral reflectance spectra.
A planet with a lot of exposed rocks (aggregates of mineral) could produce a strong mineral-edge signature, even if the planet had an atmosphere that was optically thin at visible wavelengths. Like the vegetation edge, a mineral reflectance edge could vary as continents rotate in and out of view. A mineral edge detection would be interesting in and of itself. For example, a substantial fraction of Jupiter’s moon Io is likely covered by solidified elemental sulfur allotropes (Moses & Nash 1991) that originated from volcanic eruptions. Crystalline sulfur is an an intermediate energy band gap semiconductor and has a sharp reflectance edge at 0.45 microns (Figure 6). Disk-averaged reflectance spectra of Io are remarkable in that blueward of the mineral edge Io’s albedo is near zero and redward of the mineral edge the albedo is 0.8 (e.g., Spencer & Schneider 1996).
If a reflectance edge were detected in the spectrum of an extrasolar terrestrial planet, then it would be important to consider all possible sources, including both mineral and biological. In particular, a careful study of mineral signatures and atmospheric composition will be necessary before attributing a spectral edge to a light-harvesting pigment. Although only a dozen or so rock-forming minerals are common on Earth, over four thousand minerals are known. While their spectra can be measured in the lab, and compared with the extrasolar planet reflectance spectrum, it can be tricky to identify a particular mineral from a reflectance spectrum (e.g., Moses & Nash 1991.) Additionally, the spectra surfaces covered with a regolith of small particulate minerals can deviate significantly from laboratory spectra based on large crystals. Nevertheless, it may be possible to eliminate the possibility of some minerals based on additional measurements. For example, most minerals have near-IR and mid-IR absorption features. Therefore, a mid-IR spectrum (e.g., from the mid-infrared TPF/Darwin) at wavelengths where radiation penetrates to the planet’s surface could help identify a mineral that covered a large fraction of a planet’s surface. Measurements of atmospheric composition could also be valuable for ruling out certain minerals. For example, if a detected spectrum showed a significant amount of atmospheric oxygen, then non-oxidized minerals are unlikely to be abundant on the planetary surface. The wavelength of the Earth’s vegetation red edge does not correspond to that of any known mineral (Sagan et al. 1993).
7 Summary and Conclusions
When extrasolar Earth-like planets are discovered, observations at wavelengths that penetrate to the planet’s surface will be useful for detecting surface features, including biosignatures, especially for planets with much lower cloud cover than Earth’s 50%. The vegetation red edge spectroscopic feature is a factor of 5 or more change in reflection at 700 nm in deciduous plant leaves. This red edge feature is often used in remote sensing studies of Earth’s vegetation. Earthshine observations have detected a feature identified with the red edge in the spatially unresolved spectrum of Earth where it appears at the few percent level. The Earthshine observations reported here display the expected dependence of the feature on the portion of the Earth both illuminated by sunlight and visible from the Moon and thus support this interpretation.
Earth’s hemispherically integrated vegetation red-edge signature, however, is weak (a few to ten percent vs. the 50% in leaf reflectance) due to dilution by other atmospheric (e.g., clouds) and surface (e.g., oceans and non-continuous forest coverage) features. The recent Earthshine measurements have confirmed the expected amplitude of the red-edge signature, and show that its detection is non-trivial in Earth’s spatially unresolved spectrum with current and near-future planned technology. Earth-like planets with different rotation rates, obliquities, higher land-ocean fraction, different continental arrangement and lower cloud-cover might well display a more easily detectable red-edge-type signal.
A time series of spectra or broad-band photometry will help to identify weak surface biosignatures such as the red-edge-type feature in a spatially unresolved spectrum of an extrasolar planet. The new Earthshine observations reported here indicate just such temporal variability of Earth’s red edge surface biosignature. The increased temporal variability at a carefully chosen color could make detection of such features easier. In particular, any changes associated with a rotational period would be highly relevant, but c.f. §6 for a discussion of surface mineral false positives.
Because the existence of extraterrestrial light harvesting organisms is plausible, any prediction of the characteristics of light harvesting organisms on extrasolar planets is highly speculative and uncertain. In particular, the wavelength of any surface biosignatures would not be known a priori. Therefore, flexible data acquisition will maximize scientific return from future missions. For example, spectra can be integrated into photometry in many possible different bands after the data is acquired. Similarly, a relatively high cadence of observations can later be searched for rotational periods associated with surface features.
The physical and evolutionary characteristics of the red edge and the biological significance of photosynthesis make it plausible that extraterrestrial organisms might use pigments to harvest light, and that these organisms might develop a red-edge-like spectral feature to protect their pigments. If a red-edge-like feature were detected in combination with the spectral signatures of biosignature gases, then it could be strongly suggestive of the presence of life on the planet. Moreover, the detection of any unusual spectral feature that is inconsistent with known atomic, molecular, or mineralogical signatures would be extremely interesting, and the fact that the Earth’s spectrum displays at least one such detectable feature of biological origin is encouraging. Combinations of unusual spectral features together with strong disequilibrium chemistry would be even more intriguing and would certainly motivate additional studies to better understand the prospects for such a planet to harbor life.
References
- (1)
- (2) Arcichovsky, V. M. 1912, Auf der Suche nach Chlorophyll auf den Planeten in Annales de l’Institute Polytechnique Don Cesarevitch Alexis a Novotcherkassk, 1(17), 195-214.
- (3)
- (4) Arnold, L., Gillet,S., Lardiere, O., Riaud, P. & Schneider, J. 2002, A test for the search for life on extrasolar planets. Looking for the terrestrial vegetation signature in the Earthshine spectrum A&A 392, 231-237.
- (5)
- (6) Behrenfeld, M. J., Randerson, J. T., McClain, C. R., Feldman, G. C., Los, S. O., Tucker, C. J., Falkowski, P. G., Field, C. B., Frouin, R., Esaias, W. E., Kolber, D. D., Pollack, N. H. 2001, Biospheric primary production during an ENSO transition Science 291, 2594-2597.
- (7)
- (8) Beja, O., Spudich, E. N., Spudich, J. L., Leclerc, M., & DeLong, E. F. 2001, Proteorhodopsin phototrophy in the ocean Nature 411, 786-789
- (9)
- (10) Benedict, C. M., & Gates, D. M. 1963, Convection phenomena from plants in still air, Am. J. Botan. 50, 563-573.
- (11)
- (12) Butler, R. P., Marcy, G. W., Vogt, S. S., Fischer, D. A., Henry, G. W., Laughlin, G., Wright, J. T. 2003, Seven new Keck planets orbiting G and K dwarfs ApJ 582, 455-466.
- (13)
- (14) Charbonneau, D. Brown, T. M., Noyes, R. W. & Gilliland, R. L. 2002, Detection of an extrasolar planet atmosphere ApJ 568, 377-384.
- (15)
- (16) Clark, R. N., Swayze, G. A., Gallagher, A. J., King, T. V. V., & Calvin, W. M. 1993, The U.S. Geological Survey, Digital Spectral Library: Version 1: 0.2 to 3 microns, U.S. Geological Survey Open File Report 93-592, 1340 pages, http://speclab.cr.usgs.gov.
- (17)
- (18) Davis, G. R., Calcutt, S. B., Drummond, J. R., Naylor, D. A., Penny, A. J., Seager, S. 2002, Measurements of the Unresolved Spectrum of the Earth (MUSE), Concept study for the Canadian Space Agency (Saskatoon: University of Saskatchewan)..
- (19)
- (20) DeLucia, E. H., Nelson, K., Vogelmann, T. C., & Smith, W. K. 1996, Contribution of intercellular reflectance to photosynthesis in shade leaves Plant Cell and Environment, 19, 159-170.
- (21)
- (22) Des Marais, D. J., Harwit, M. O., Jucks, K. W., Kasting, J. F., Lin, D. N. C., Lunine, J. I., Schneider, J., Seager, S., Traub, W. A., & Woolf, N. J. 2002, Remote sensing of planetary properties and biosignatures on extrasolar terrestrial planets Astrobiology 2, 153-181.
- (23)
- (24) Du, H., Fuh, R. A., Li, J., Corkan, A., & Lindsey, J. S. 1998, PhotochemCAD: A computer-aided design and research tool in photochemistry Photochemistry and Photobiology 68, 141-142
- (25)
- (26) Field B., Behrenfeld, M. J., Randerson, J. T., & Falkowski, P. 1998, Primary production of the biosphere: integrating terrestrial and oceanic components Science 281, 237-240.
- (27)
- (28) Ford, E. B., Seager, S. & Turner E. L. 2001, Characterization of extrasolar terrestrial planets from diurnal photometric variability Nature 412, 885-887.
- (29)
- (30) Frigaard, N.-U., Larsen, K. L., & Cox R. P. 1996, Spectrochromatography of photosynthetic pigments as a fingerprinting technique for microbial phototrophsFEMS Microbiology Ecology 20, 69-77.
- (31)
- (32) Gates, D. M., Keegan, H. J., Schleter, J. C. & Weidner, V. R. 1965, Spectral properties of plants Applied Optics 4, 11-20.
- (33)
- (34) Goode, P. R., Qiu, J., Yurchyshyn, V., Hickey, J., Chu, M.-C., Kolbe, E., Brown, C. T. & Koonin, S. E. 2001, Earthshine observations of the Earth’s reflectance GeoRL 28, 1671-1674.
- (35)
- (36) Govaerts, Y. M., Jacquemoud, S, Verstraete, M. M. & Ustin, S. L. 1996, Three-dimensional radiation transfer modeling in a dicotyledon leaf Applied Optics 35, 6585-6598.
- (37)
- (38) Grant, L. 1987, Diffuse and Specular Characteristics of Leaf Reflectance, Remote Sensing of Environment 22 309-322
- (39)
- (40) Kasting, J. F., Whitemire, D. P. & Reynolds, R. T. 1993, Habitable Zones around Main Sequence Stars Icarus 101, 108-129.
- (41)
- (42) Knacke, R. F. 2003, Possibilities for the Detection of Microbial Life on Extrasolar Planets Astrobiology 3, 531-541
- (43)
- (44) Knipling, E. B. 1970, Physical and physiological basis for the reflectance of visible and near-infrared radiation from vegetation Remote Sensing of Environment 1, 155-159.
- (45)
- (46) Konrad, W., Roth-Nebelsick, A., Kerp, H., & Hass, H. 2000, Transpiration and assimilation of early Devonian land plants with axially symmetric telomes—simulations on the tissue level, Journal of Theoretical Biology 206, 91-107.
- (47)
- (48) Kuiper, G. P. 1949, The Atmospheres of the Earth and Planets (Chicago: University of Chicago Press), p.339.
- (49)
- (50) Lowell, P. 1911, The cartouches of the canals of Mars Lowell Obs. Bull 1, No. 12, 59-86.
- (51)
- (52) Madigan, M. T., Martinko, J. M., & Parker, J. 2002, Brick Biology of Microorganisms, Prentice-Hall, Upper Saddle River, NJ, p.6.
- (53)
- (54) Mayor, M., Udry, S., Naef, D., Pepe, F., Queloz, D., Santos, N. C., Burnet, M. 2003, The CORALIE survey for southern extra-solar planets. XII. Orbital solutions for 16 extra-solar planets discovered with CORALIE A&A in press
- (55)
- (56) McCord, Th. B., Charette, M. P., Johnson, T. V., Lebofsky, L. A., & Pieters, C. 1972, Spectrophotometry (0.3 to 1.1 micron) of visited and proposed Apollo lunar landing sites Earth, Moon, and Planets, 5, 52-89.
- (57)
- (58) Middleton, E., J. Sullivan 2000, BOREAS TE-10 Leaf Optical Properties for SSA Species. Data set. Available on-line [http://www.daac.ornl.gov] from Oak Ridge National Laboratory Distributed Active Archive Center, Oak Ridge, Tennessee, U.S.A.
- (59)
- (60) Millman, P. M. 1939, Is there vegetation on Mars? The Sky 3, no. 10, 11.
- (61)
- (62) Moses, J. I., & Nash, D. B. 1991, Phase transformations and the spectral reflectance of solid sulfur—can metastable sulfur allotropes exist on Io? Icarus 89, 277-304. Icarus 89, p. 277-304
- (63)
- (64) Mulkidjanian, A. Y., & Junge, W. 1997, On the origin of photosynthesis as inferred from sequence analysis. A primordial UV-protection as common ancestor of reaction centeres and antenna proteins Photosynthesis Res. 51, 27-42.
- (65)
- (66) Oesterhelt, D. & Stoeckenius, W. 1971, Rhopsin-like protein from the purple membrance of Halobacterium halobium Nature 233, 149-152
- (67)
- (68) Purves, W. K., Orians, g. H., Heller, H. C. 1995 Life: the science of biology, Sinauer Associates and W. H. Freeman and Co.
- (69)
- (70) Rea, D.G., O’Leary, B. T., & Sinton, W. M. 1965, Mars: The Origin of the 3.58- and 3.69-Micron Minima in the Infrared Spectrum Science 147, 1286-1288.
- (71)
- (72) Sagan, C. & Pollack, J. B. 1969, Windblown dust on Mars Nature 223, 791-794.
- (73)
- (74) Sagan, C., Thompson, W. R., Carlson, R., Gurnett, D., Hord, C. 1993, A search for life on Earth from the Galileo spacecraft Nature, 365, 715.
- (75)
- (76) Seager, S. 2003, The search for extrasolar Earth-like planets Earth and Planetary Science Letters 208, 113-124.
- (77)
- (78) Seager, S & Ford, E. B. 2004, The vegetation red edge spectroscopic feature as a surface biosignature in Astrophysics of Life, Space Telescope Science Institute Symposium Series, Vol. 16, M. Livio, I. N. Reid, & W. B. Sparks eds. (Cambridge: Cambridge University Press), p. 67-75.
- (79)
- (80) Sinton, W. M. 1957, Spectroscopic Evidence for Vegetation on Mars ApJ 126, 231-239.
- (81)
- (82) Sinton, W. M. 1958, Spectroscopic evidence of vegetation on Mars PASP 70, 50-56.
- (83)
- (84) Slaton, M. R., Hunt, E. R., & Smith, W. K. 2001, Estimating near-infrared leaf reflectance from leaf structural characteristics American Journal of Botany 88, 278-284
- (85)
- (86) Slipher J. M. 1924, Observations of Mars in 1924 made at the Lowell Observatory: II. spectrum observations of Mars PASP 36, 261-262.
- (87)
- (88) Spencer, J. R., & Schneider, N. M. 1996, Io on the eve of the Galileo mission Ann. Rev. Earth Planet Sci. 24, 125-190.
- (89)
- (90) Tikhov, G. A. 1947, Etude de la lumiere cendree de la Lune au moyen des filters selectuers Bull. Astr. and Geodet. Soc. U.S.S.R. 8, 15-25.
- (91)
- (92) Woolf, N. J., Smith, P. S., Traub, W. A. & Jucks, K. W. 2002, The spectrum of Earthshine: a pale blue dot observed from the ground ApJ 574, 430-433.
- (93)
- (94) Wolstencroft, R. D., & Raven, J. A. 2002, Photosynthesis: likelihood of occurrence and possibility of detection on Earth-like planets Icarus 157, 535-548.
- (95)