X-ray Lighthouses of the High-Redshift Universe. II.
Further Snapshot Observations of the Most Luminous
Quasars with Chandra
Abstract
We report on Chandra observations of a sample of 11 optically luminous () quasars at =3.96–4.55 selected from the Palomar Digital Sky Survey and the Automatic Plate Measuring Facility Survey. These are among the most luminous quasars known and hence represent ideal witnesses of the end of the “dark age ”. Nine quasars are detected by Chandra, with 2–57 counts in the observed 0.5–8 keV band. These detections increase the number of X-ray detected AGN at to 90; overall, Chandra has detected 85% of the high-redshift quasars observed with snapshot (few kilosecond) observations. PSS 15065220, one of the two X-ray undetected quasars, displays a number of notable features in its rest-frame ultraviolet spectrum, the most prominent being broad, deep Si IV and C IV absorption lines. The average optical-to-X-ray spectral index for the present sample (=1.88) is steeper than that typically found for quasars but consistent with the expected value from the known dependence of this spectral index on quasar luminosity.
We present joint X-ray spectral fitting for a sample of 48 radio-quiet quasars in the redshift range 3.99–6.28 for which Chandra observations are available. The X-ray spectrum ( 870 counts) is well parameterized by a power law with =1.93 in the rest-frame 2–40 keV band, and a tight upper limit of 5 cm-2 is obtained on any average intrinsic X-ray absorption. There is no indication of any significant evolution in the X-ray properties of quasars between redshifts zero and six, suggesting that the physical processes of accretion onto massive black holes have not changed over the bulk of cosmic time.
Subject headings:
galaxies: active — galaxies: nuclei — quasars: general — X-rays: galaxies1. Introduction
Over the last few years, X-ray observations have provided important information about the population of luminous quasars populating the Universe at 4–6, i.e., at the end of the “dark age” (e.g., Rees 1999). Since the work by Kaspi, Brandt, & Schneider (2000) with archival ROSAT observations, X-ray studies of high-redshift quasars have taken advantage of the capabilities of the new generation of X-ray observatories: Chandra and XMM-Newton. In particular, Chandra snapshot observations of Active Galactic Nuclei (AGN) have proven to be effective in providing basic X-ray information, such as X-ray fluxes, luminosities, and broad-band properties, on some of the most luminous objects in the Universe (Vignali et al. 2001a, 2002, 2003a,b, hereafter V01a, V02, V03a, and V03b, respectively; Brandt et al. 2002; Bechtold et al. 2003; Bassett et al. 2004). Using these observations, it has also been possible to collect enough source counts to allow joint X-ray spectral fitting (V03a; V03b; Vignali, Brandt, & Schneider 2004). This kind of X-ray study is enabled by the sharp on-axis PSF and the low instrumental background of Chandra. On the other hand XMM-Newton, with its larger effective area, has allowed individual X-ray spectral fitting for a handful of the most X-ray luminous quasars with medium-to-long exposures (Ferrero & Brinkmann 2003; Grupe et al. 2004; Farrah et al. 2004; see also the Chandra spectral results of the 5.99 SDSS 130608.26035626.3 quasar reported recently by Schwartz & Virani 2004).
It has therefore become possible to provide an overall picture of the radio-quiet and radio-loud quasar populations at the highest redshifts. However, X-ray studies of the most optically luminous quasars at have been conducted for a limited number of objects, the majority of which have been selected from the Digital Palomar Sky Survey (PSS; e.g., Djorgovski et al. 1998) and presented by V03a. The goal of the present study is to extend previous X-ray investigations of the properties of luminous quasars at using Chandra snapshot observations; the target sample comprises 11 quasars in the redshift range =3.96–4.55 ( 28.5 to 29.5) selected from the PSS and the Automatic Plate Measuring Facility Survey (BRI; e.g., Irwin, McMahon, & Hazard 1991; Storrie-Lombardi et al. 1996, 2001).
Throughout the paper we adopt =70 km s-1 Mpc-1, =0.3, and =0.7 (e.g., Spergel et al. 2003).
2. Chandra Observations and Data Reduction
All of the quasars presented here were targeted by Chandra during Cycle 4 with snapshot ( 4.0–5.1 ks) observations. The observation log is shown in Table 1. All of the sources were observed with the Advanced CCD Imaging Spectrometer (ACIS; Garmire et al. 2003) with the S3 CCD at the aimpoint. Faint mode was used for the event telemetry format, and ASCA grade 0, 2, 3, 4 and 6 events were used in the analysis, which has been carried out using the Chandra Interactive Analysis of Observations (ciao) Version 2.3 software. No background flares are present in these observations. Source detection was carried out with wavdetect (Freeman et al. 2002) similarly to V01a, V03a, and V03b, using wavelet transforms (with wavelet scale sizes of 1, 1.4, 2, 2.8, and 4 pixels) and a false-positive probability threshold of 10-4. Given the small number of pixels being searched due to the known source positions and the sub-arcsec on-axis angular resolution of Chandra, the probability of spurious detections is extremely low; most of the sources were in fact detected at a false-positive probability threshold of 10-6.
The X-ray counts detected in the ultra-soft band (0.3–0.5 keV), the soft band (0.5–2 keV), the hard band (2–8 keV), and the full band (0.5–8 keV) are reported in Table 2. The counts have been derived using wavdetect and checked with manual aperture photometry. Nine quasars have been detected, with full-band counts ranging between 2 and 57. The X-ray positions of the detected sources are within 0.1–0.7′′ of the optical positions; this is consistent with the expected Chandra ACIS positional error.
In Table 2 the band ratios and the effective photon indices for the X-ray detected sources are also reported. Both of these quantities have been corrected for the quantum efficiency decay of ACIS at low energies, caused by molecular contamination of the ACIS filters, using a time-dependent correction. To apply the correction, we adopted the acisabs model (see, e.g., Chartas et al. 2002).111See http://www.astro.psu.edu/users/chartas/xcontdir/xcont.html. We note that, given the dates of our observations, the differences between the adoption of either this model or that proposed by the Chandra X-ray Center (CXC),222For further details, see http://asc.harvard.edu/ciao/why/acisqedeg.html. available with the latest CIAO release, are small; therefore, for consistency with our previous work (e.g., V03a; V03b), we will adopt the acisabs model throughout this paper.
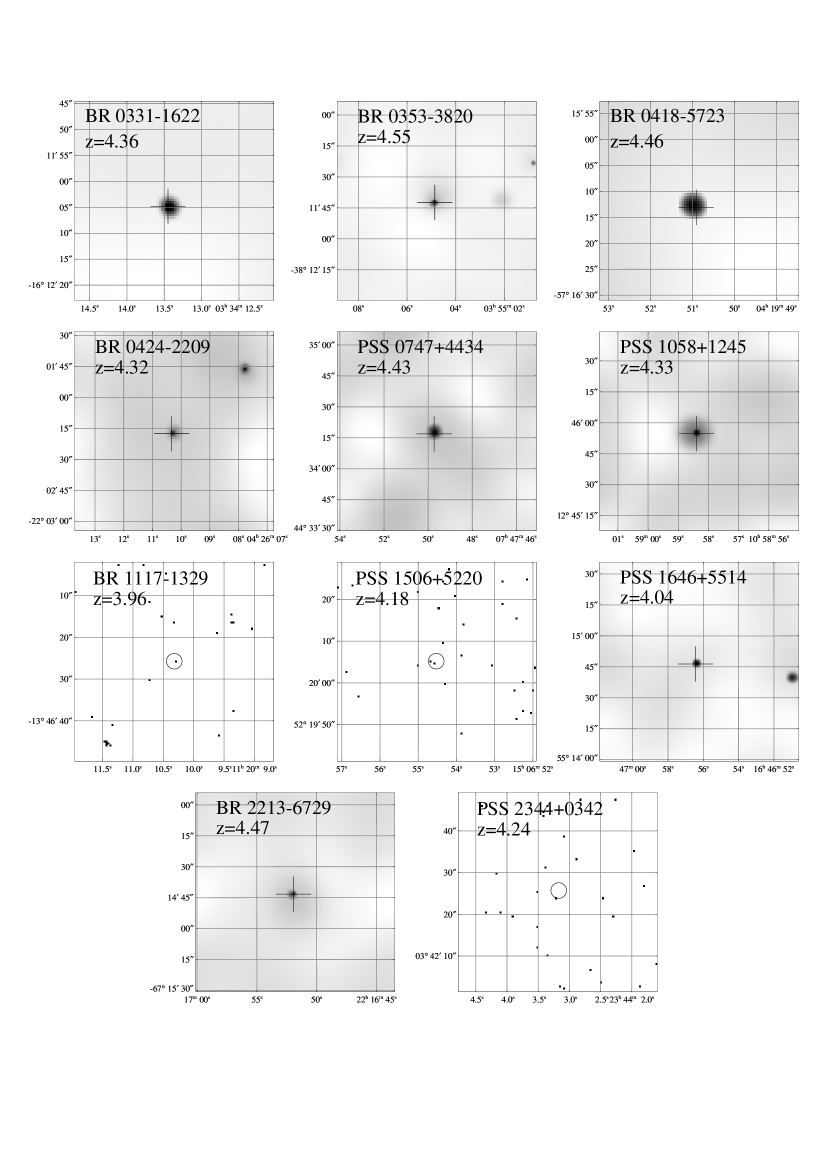
The full-band images of eight detected quasars, adaptively smoothed using the algorithm of Ebeling, White, & Rangarajan (2005), are shown in Figure 1. For BR 11171329, a known broad absorption-line quasar (BALQSO; Storrie-Lombardi et al. 1996) from which two counts have been detected (see 2.1 for discussion), and the two non-detections, the raw images are shown. Overall, in the regions of projected distance kpc2 centered on the quasar positions, we did not find any significant excess of companions with respect to the cumulative number counts from X-ray surveys (e.g., Bauer et al. 2004); this is in agreement with previous X-ray searches around high-redshift quasars (e.g., V03a; V03b). Similarly, the absence of X-ray extension for all of our target quasars suggests that significant gravitational lensing (e.g., Comerford, Haiman, & Schaye 2002) is not present.
Although the observations are short, we have searched for X-ray variability by analyzing the photon arrival times in the full band using the Kolmogorov-Smirnov test. No significant variability was detected from any of our quasars. This is not surprising given the small numbers of detected counts and the 15-minute rest-frame exposure times.
2.1. Two-Count Sources: BR 11171329 and PSS 15065220
As was the case for the =5.27 quasar SDSS 12080010 (V01a) and the =4.80 quasar SDSS 07564502 (V03b), BR 11171329 can also be considered a secure detection with only two counts (in the same pixel) in the 0.5–2 keV band. In fact, the source is detected by wavdetect using a false-positive threshold of 10-4. Monte-Carlo simulations (see 2.1.1 of V03b for details) indicate that the significance of this detection is 4 in the soft band.
In contrast, PSS 15065220 cannot be considered detected (according to a Monte-Carlo analysis), although two full-band counts are present within the 2′′–radius circle centered on its optical position (see Fig. 1).
3. Hobby-Eberly Telescope Observations
We conducted imaging and spectroscopic observations of several of the quasars using the 9-m Hobby-Eberly Telescope (HET; Ramsey et al. 1998). These data were taken within 1–10 months of the X-ray observations ( weeks in the quasar rest frames) to minimize the effects of variability in the X-ray/optical comparisons. Variability can introduce significant uncertainties into estimates of key parameters (e.g., the optical-to-X-ray spectral index; see §4). The observations were all obtained with the Marcario Low-Resolution Spectrograph (LRS; Hill et al 1998a,b; Cobos Duenas et al. 1998).
3.1. Photometric Observations
Two-minute -band LRS images were acquired for four of the 11 sources (PSS 07474434, PSS 15065220, PSS 16465514, and PSS 23440342) during the fall–winter 2003–4. Using the LRS images and finding charts of the fields, it was possible to obtain approximate photometric calibrations using the stellar objects in the fields. Although the level of uncertainty in these comparisons is substantial, we did not detect any significant long-term variations (i.e., more than 50%) in the quasar brightnesses from their published values. To have a uniform analysis, we have adopted the APM magnitudes333See http://www.ast.cam.ac.uk/mike/apmcat/interface.html. to derive the optical and broad-band parameters of the quasars.
3.2. Optical Spectrum of PSS 15065220
Two of the quasars, PSS 10581245 and PSS 15065220, do not have published spectra. Immediately after acquiring the -band image of PSS 15065220 on January 19, 2004 (described in 3.1), we obtained a 15-minute spectrum of the object using the LRS. The spectrum, which is displayed in Fig. 2, was acquired using a 2′′ slit, an OG515 blocking filter, and a 600 line mm-1 grism; this configuration produced a spectrum covering the wavelength range 6300–9100 Å at a resolving power of 1100.
The spectrum displays a number of notable and complex features, the most prominent being broad, deep Si IV and C IV absorption lines between redshifts of about 3.68 and 3.84 (a velocity width of approximately 10,000 km s-1). The sharp rise at the blue end of the spectrum is the red wing of the Lyman emission line. Also present is a strong Mg II absorption doublet (total rest equivalent width of nearly 7 Å).
The previously reported redshift of PSS 15065220 is 4.18;444See http://www.astro.caltech.edu/george/z4.qsos. however, accurate redshifts of BALQSOs are difficult to determine. In Fig. 2 we have indicated the expected position of the C IV emission line; no feature is found at this location. There is a suggestion of a broad emission feature centered at 7870 Å; if this is the C IV line, the redshift would be approximately 4.08 (there is a hint of a narrow absorption feature in the midst of this putative emission line).
G. Djorgovski has kindly showed an unpublished Keck spectrum of this object to us; his data extend far below the Lyman emission line. If the peak of this line is associated with the rest wavelength of Lyman , then the redshift is indeed 4.18. Given the significant distortions in the lines produced by the absorption troughs, we conclude that it is presently impossible to assign a redshift with an accuracy of better than 0.1 for this object. The ejection velocities of the BAL features would range between 20,000 km s-1 and 25,000 km s-1, depending on the quasar redshift. Throughout the analysis in this paper, we will adopt the published value of 4.18 for the redshift of this object (see Footnote 9).
The strong Mg II absorption feature suggests the presence of a massive galaxy at a redshift of 1.4711 along the line-of-sight to the quasar. Given this result, the high luminosity of PSS 15065220 may partially arise from amplification via gravitational lensing.
4. Multi-wavelength Properties of the Sample
The principal optical, X-ray, and radio properties of our target quasars
are listed in Table 3:
Column (1). — The name of the source.
Column (2). — The Galactic column density (from Dickey &
Lockman 1990) in units of 1020 cm-2.
Column (3). — The monochromatic rest-frame magnitude
(=;
Oke & Gunn 1983).
The magnitudes reported in Table 3 have been derived from the APM -band
magnitudes (corrected for Galactic extinction; Schlegel, Finkbeiner, & Davis
1998) assuming the empirical relationship
=0.684 ,
which is effective in the redshift range covered by our sample.
Columns (4) and (5). — The 2500 Å rest-frame flux
density and luminosity. These were computed from the magnitude
assuming an optical power-law slope of
( ; Fan et al. 2001)
to allow direct comparison with the results presented in V01a, V03a, and V03b.
Note that the 2500 Å rest-frame flux densities and luminosities are
reduced by 15% when the power-law slope of the optical continuum
is changed to (e.g., Schneider et al. 2001;
Vanden Berk et al. 2001).
Column (6). — The absolute -band magnitude computed using
. When is adopted for the extrapolation,
the absolute -band magnitudes are fainter by 0.35 mag.
Columns (7) and (8). — The observed count rate in the
0.5–2 keV band and the corresponding flux, corrected
for Galactic absorption and the quantum efficiency decay of Chandra ACIS
at low energy.
The fluxes have been calculated using pimms (Mukai 2002) and
a power-law model with =2.0; this is a good parameterization
of samples of 0–3 quasars (e.g., George et al. 2000;
Reeves & Turner 2000; Page et al. 2003; Piconcelli et al. 2005)
and quasars (V03a; V03b; see 6).
Columns (9) and (10). — The rest-frame 2 keV flux density
and luminosity, computed assuming =2.0 and corrected for the quantum
efficiency decay of Chandra ACIS at low energy.
Column (11). — The 2–10 keV rest-frame luminosity.
Column (12). — The optical-to-X-ray power-law slope, ,
defined as
| (1) |
where and are the
rest-frame flux densities at 2 keV and 2500 Å, respectively.
The errors on have been computed following the
“numerical method” described in 1.7.3 of Lyons (1991) considering
both the statistical uncertainties on the X-ray count rates and the effects
of reasonable changes in the X-ray and optical continuum shapes
(see 3 of V01a for details).
Column (13). — The radio-loudness parameter (e.g., Kellermann
et al. 1989), defined as
= (rest frame).
The rest-frame 5 GHz flux density was computed from the FIRST (Becker, White,
& Helfand 1995), NVSS (Condon et al. 1998) or Carilli et al. (2001)
observed 1.4 GHz flux density assuming a radio power-law slope
of . The upper limits are at the 3 level.
The rest-frame 4400 Å flux density was computed from the magnitude assuming an optical power-law slope of .
Typical radio-loudness values are for radio-loud quasars (RLQs)
and for radio-quiet quasars (RQQs).
For the two quasars with the lowest declinations, BR 04185723 and BR 22136729, no sensitive radio data are available. None of the remaining quasars is radio loud.
5. X-ray Properties of the Sample
In our previous study of a sample of optically luminous ( 28.4 to 30.2) PSS quasars (V03a), we derived the basic X-ray properties for some of the most luminous objects in the Universe and performed joint X-ray spectral fitting. No spectral evolution in quasar X-ray continua at high redshift was found. With the current sample of 11 PSS and BRI quasars, our goal is to improve the results presented in V03a. The new Chandra observations, coupled with some other observations retrieved from the archive,555See http://www.astro.psu.edu/users/niel/papers/highz-xray-detected.dat for a regularly updated compilation of X-ray detections and tight upper limits at . Details about the analyzed Chandra archival observations are reported in the Appendix. have increased the number of X-ray detected AGN at (mostly quasars) to 90. Overall, Chandra has detected 85% of the high-redshift quasars observed with snapshot observations. The program of snapshot observations has allowed filling of the soft X-ray flux versus plot shown in Fig. 3 with many X-ray detections over the last few years. This plot is effective in showing the large advances made recently in the knowledge of the properties of high-redshift quasars (only RQQs are reported); for comparison, note the paucity of data points in Fig. 2 of Brandt et al. (2001). Most of the upper limits shown in Fig. 3 have been obtained using archival ROSAT observations; some of these are reported here for the first time (see Appendix and Table A1 for details).
Most of the quasars presented in this paper (filled triangles in Fig. 3 for the nine X-ray detections and large downward-pointing arrows for the two upper limits) populate the region close to the =1.80 slanted line (computed assuming =4.3, the average redshift of the current sample). They have an average =1.88 (computed using the asurv software package Rev 1.2; LaValley, Isobe, & Feigelson 1992; the quoted errors represent the standard deviation of the mean) which is steeper than the average value found using the whole population of RQQs at high redshift with available X-ray information (=1.76).
This finding is consistent with the fact that the current Chandra sample is highly luminous (=32.1 erg s-1 Hz-1), and from previous work (e.g., Avni, Worrall, & Morgan 1995; Vignali, Brandt, & Schneider 2003, hereafter VBS03; see also Strateva et al., in preparation) has been found to depend upon optical luminosity, i.e., more optically luminous quasars have steeper (more negative) . The expected for the current sample would be . We note that for BR 03533820 is flat (=), much below the average value for the whole sample; it is possible that this flat is due to some source variability occurring over the time interval between the optical and X-ray observations.
As discussed in previous works (e.g., V01a; V03b), there is a correlation between and 0.5–2 keV flux (see Fig. 3). To have a homogeneous sample, we have used only the optically selected RQQs observed by Chandra; the significance of the correlation has been evaluated using the methods within asurv, in particular the generalized Kendall’s (Brown, Hollander, & Korwar 1974). The vs. 0.5–2 keV flux correlation is significant at the % level; according to the Estimate and Maximize (EM; Dempster, Laird, & Rubin 1977) regression algorithm, it can be parameterized by
plotted as a dotted line in Fig. 3.
Figure 3 also highlights the large discrepancy in our knowledge of the properties of the high-redshift AGN population in its entirety. While X-ray information is presently available for large numbers of optically luminous quasars at (i.e., those located on the right-hand side of Fig. 3 and plotted as filled symbols and downward-pointing arrows), only a few AGN at fainter optical magnitudes are detected in the X-rays (open squares). These have all been discovered by moderately deep and deep X-ray surveys with ROSAT (Schneider et al. 1998) and Chandra (Silverman et al. 2002; V02; Castander et al. 2003; Treister et al. 2004).
Two quasars in the present sample have not been detected by Chandra: PSS 15065220 (discussed in 2.1) and PSS 23440342 (no X-ray counts within a 2′′–radius circle). There are two possible explanations for the non-detections of these two quasars in the X-ray band: they are either strongly absorbed or intrinsically X-ray weak. If their non-detection is due to the presence of intrinsic X-ray absorption, then column densities of cm-2 and cm-2, respectively, are required to reproduce the Chandra constraints (using the optical-to-X-ray correlation of VBS03 and assuming a photon index =2.0). It is interesting to note that the HET spectrum of PSS 15065220 displays a number of notable and complex features, the most prominent being broad, deep Si IV and C IV absorption lines. For the other X-ray undetected quasar of the present sample, PSS 23440342, the optical spectrum shows two very high column density damped Lyman absorption (DLA) systems (Peroux et al. 2001; Prochaska et al. 2003); however, these are unlikely to be responsible for all of the absorption suggested by the X-ray constraints (see, e.g., Elvis et al. 1994 for discussion on the expected X-ray absorption by DLAs).
We also note that the X-ray weak BR 11171329 (detected with two counts, see 2.1 and Table 2) shows blueshifted broad absorption lines for O VI, N V, Si IV, and C IV (Storrie-Lombardi et al. 1996).
6. Joint Spectral Fitting: a Quasar X-ray Spectral Template at 4–6.3
Previous studies have provided basic information on the X-ray spectral properties of luminous, optically selected RQQs, in particular on their photon indices and column densities. These results have been achieved either with direct X-ray spectral fitting of a few X-ray luminous quasar spectra observed with XMM-Newton (e.g., Ferrero & Brinkmann 2003; Grupe et al. 2004; Farrah et al. 2004) and Chandra (Schwartz & Virani 2004) or using joint X-ray spectral fitting analysis, i.e., simultaneous fitting of sizable numbers of Chandra spectra of quasars (e.g., V03a; V03b; Vignali et al. 2004). Since these objects are among the most luminous quasars at , they do not represent the majority of the high-redshift quasar population. Similarly to low- and intermediate-redshift RQQs (e.g., George et al. 2000; Reeves & Turner 2000; Page et al. 2003; Piconcelli et al. 2005), high-redshift RQQs are, on average, characterized by power-law continua with 1.8–2.0, with no indication for widespread absorption. Joint X-ray spectral fitting studies are important given the difficulty in obtaining quality X-ray spectra of high-redshift quasars using reasonable exposures ( 40–60 ks) with XMM-Newton. Furthermore, combining the spectra of many high-redshift quasars is a practical way to derive their average X-ray spectral properties; in fact, studies limited to a few X-ray luminous quasars may not be representative of the high-redshift quasar population as a whole.
To provide further constraints on the average X-ray properties of high-redshift quasars, we have performed joint fitting using all the available Chandra data for RQQs in the redshift range =3.99–6.28. Neither X-ray selected quasars (see V02 for X-ray spectral analyses of X-ray selected AGN in the Chandra Deep Field-North) nor radio-selected quasars (with the exception of FIRST 07472739, which is radio quiet; see Bassett et al. 2004) have been considered in the following analysis. Source counts have been extracted for each quasar using a circular region of 2′′ radius centered on the X-ray centroid of the quasar. Although background is typically negligible in these Chandra observations, we have extracted background counts using annuli of different sizes (to avoid contamination from nearby X-ray sources) centered on the quasar position. Only sources with full-band counts have been considered in the analysis. The selection criteria adopted in this study (mainly the RQQ selection and the fact that only Chandra data are used) reduced the number of quasars with usable X-ray information from 90 to 48, for a total exposure time of 244.1 ks. We have 870 net source counts in the observed 0.3–8 keV band, corresponding to the rest-frame 1.5–58 keV band; the average number of counts per object is 18. Figure 4 summarizes the principal properties of the sample used in this X-ray spectral study. The average redshift of the sample is =4.57, while its median is =4.43.
Spectral analysis was carried out with xspec Version 11.3.0 (Arnaud 1996) using unbinned data and the C-statistic (Cash 1979); this statistical approach allows one to retain all spectral information and associate with each quasar its own Galactic absorption column density and redshift (for the fitting with intrinsic absorption, see below). Errors are quoted at the 90% confidence level for one interesting parameter (; Avni 1976; Cash 1979), unless stated otherwise. Solar abundances (from Anders & Grevesse 1989) have been adopted for the absorbing material, although optical studies indicate that high-redshift quasars are often characterized by supersolar abundances of heavy elements (e.g., Hamann & Ferland 1999; Dietrich et al. 2003a,b). Note that doubling the abundances in the fit produces a reduction in the column density of a factor of 2.
We started the joint X-ray spectral fitting using a power-law model, leaving the power-law normalizations for all of the quasars free to vary (to account for the different fluxes of the sources), plus Galactic absorption. The lack of significant data-to-model residuals for the fit suggests that the assumed model is acceptable; the resulting photon index, =1.93, is consistent with previous estimates for quasars. The addition of neutral intrinsic absorption at each source’s redshift does not improve the fit significantly; there is no evidence for widespread absorption toward the lines-of-sight of the quasars under investigation, the column density (i.e., the counts-weighted average column density) being cm-2 (see the solid contours in Fig. 5a showing the 68, 90, and 99% confidence levels for the photon index vs. column density; see also Table 4). If our targets had intrinsic absorption of (2–5) cm-2, as found in two RQQs at 2 using ASCA data (Reeves & Turner 2000), we would be able to detect it given the upper limit on the column density we derived. The spectral results do not change significantly if only the X-ray data in the rest-frame interval common to all of the quasars of the sample ( 2.2–40 keV band; 840 counts) are taken into account (see the dashed contours in Fig. 5a). In this case, the photon index is , while the upper limit on the column density remains essentially unchanged.
The sample does not appear to be biased by the presence of a few high signal-to-noise ratio objects.666For this reason, we have considered the 8.1 ks Chandra observation of SDSS 130608.26035626.3 (Brandt et al. 2002) instead of the longer ( 120 ks) observation presented recently by Schwartz & Virani (2004). This has been checked during the X-ray spectral analysis by removing some of the quasars with higher photon counting statistics. In particular, the removal of the three sources with 60 counts (BR 03533820, PSS 09263055, and PSS 13260743) leaves the photon index unchanged (=1.92), but the constraint on the column density intrinsic to the quasars is less tight ( cm-2; see Table 4). We also performed joint spectral fitting using the most and least optically luminous RQQs of the sample as well as the highest and lowest redshift RQQs; the results of the fitting are reported in Table 4. Within the statistical uncertainties due to the limited number of X-ray counts, no evidence for a significant dependence of the X-ray spectral parameters upon either the luminosity or the redshift of the quasar subsample has been found.
Given the limited counting statistics available and the fact that a power-law model seems to be acceptable, we did not investigate more complex spectral models. The typical upper limits on the equivalent width (EW) of a narrow, either neutral or ionized, iron K line are not stringent, lying in the range 270–370 eV. Using the parameterization of the anti-correlation between the EW of the iron K line and source X-ray luminosity (the “X-ray Baldwin effect”; see Iwasawa & Taniguchi 1993 and Nandra et al. 1997) recently reported by Page et al. (2004), we would expect EW 50 eV for our sample of RQQs (their average rest-frame 2–10 keV luminosity is erg s-1). The expected EW is below the upper limits provided by joint X-ray spectral fitting.
To investigate the reliability of the joint X-ray spectral fitting results, we performed two consistency checks. First, we compared the photon index obtained from the joint spectral fitting with that derived from band-ratio analysis (i.e., the ratio of the 2–8 keV to 0.5–2 keV counts, corrected for the ACIS quantum efficiency decay); for the Galactic column density, we assumed the average value for the 48 quasars weighted by the exposure time of each observation. The resulting photon index, =1.89 (the uncertainty quoted here corresponds to the 1 level, see Gehrels 1986 and the caption of Table 2), is consistent with our previous value. Secondly, we added all of the source and background counts using the ftool task mathpha; similarly, redistribution matrix files (RMFs) and auxiliary response files (ARFs) were combined using addrmf and addarf, respectively, weighted by the individual exposure times. In this case the source counts were grouped into a spectrum such that each spectral bin contained at least 15 counts to allow fitting. Our fitting obtained =1.97 and no evidence for intrinsic absorption ( cm-2), as for the previously adopted fitting procedures. The power-law model and the data-to-model residuals are shown in Fig. 5b.
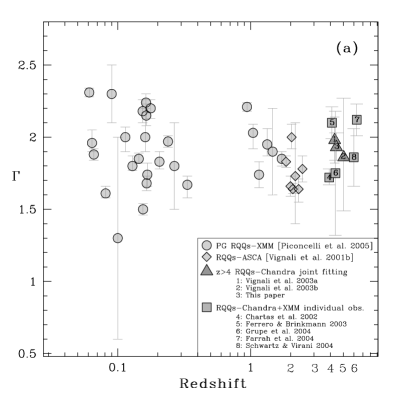
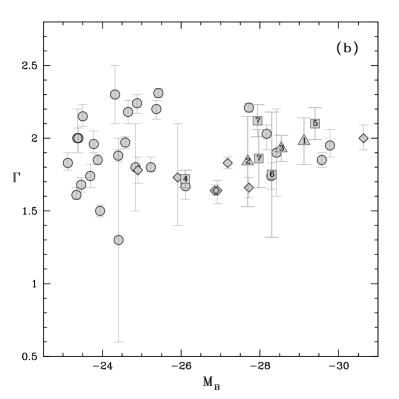
Fig. 6a shows the hard photon index (to avoid spectral complexities such as soft excesses at low energies) as a function of redshift for a compilation of optically selected RQQs. In particular, at low () redshift we have used the X-ray spectral information for the Bright Quasar Survey (PG; Schmidt & Green 1983) objects presented by Piconcelli et al. (2005; circles); a few sources with Seyfert-like luminosity () have been excluded from this analysis. At , the RQQs from the Vignali et al. (2001) sample have been selected (diamonds). At the highest redshifts, the X-ray spectral results obtained over the last three years with either joint spectral fitting (triangles) or individual observations (squares) are shown. The low-redshift () quasars plotted in Fig. 6a are usually 4 magnitudes less luminous than the quasars under study; we are able to get down only to with comparably luminous objects. Although significant intrinsic scatter in the photon indices at all redshifts is present, there is no detectable systematic change in the photon-index distribution at high redshift. The apparently smaller dispersion in the photon indices at high redshift than at lower redshift is at least partially due to the joint spectral fitting (used for some data points at ) which tends to average any dispersion out. Although it is possible in principle that a redshift-dependence of could be canceled out by a luminosity-dependence of (which is not evident from Fig. 6b, where is plotted against ), this would require somewhat of a conspiracy and cuts agains Occam’s razor. At present there is no overwhelming evidence that the photon index is significantly dependent upon quasar X-ray luminosity; for further details, see the contrasting results presented by Dai et al. (2004) and Reeves & Turner (2000). A partial correlation analysis of the photon index vs. redshift/X-ray luminosity for a large, uniformly selected sample of quasars is required to address this issue properly.
All of these spectral results confirm the lack of significant X-ray spectral evolution of luminous, optically selected quasars over cosmic time. Thus, despite the strong changes in environment and quasar number density that have occurred from 0–6, individual quasar X-ray emission regions seem to evolve relatively little (see Brandt et al. 2005).
7. X-ray undetected quasars: peculiar objects at high redshift?
Although the X-ray spectral results presented above are based on a significant fraction of the RQQs with Chandra observations, the selection of the sample might constitute a cause for concern, since we have excluded the X-ray faintest (with less than two counts) sources and non-detections. Overall, these X-ray weak or undetected quasars represent 25% of the RQQ population thus far observed by Chandra at . It is possible that in some cases the lack of an X-ray detection is due to absorption, which should be 1023 cm-2 to reproduce the X-ray constraints (under reasonable assumptions about the spectrum). This is an acceptable explanation for BALQSOs (40% of the the X-ray undetected quasars, see Fig. 7). Past works have shown that BALQSOs are typically absorbed in the X-ray band (e.g., Brandt et al. 2000; Green et al. 2001; V01a; Gallagher et al. 2002).
In the histogram shown in Fig. 7, BALQSOs populate preferentially the fainter part (i.e., more negative values) of the distribution. Although computed using a limited number of objects, their average (dotted line in Fig. 7) is ( including SDSS 104433.04012502.2 detected by XMM-Newton; see Brandt et al. 2001), while the optically selected non-BAL RQQs observed with Chandra have (long-dashed line in Fig. 7; the median value is 1.77). It is also plausible, though not necessarily required by the present data, that some of the remaining X-ray undetected quasars at high redshift are characterized by absorption features which are not recognized because of either low spectral resolution (see, e.g., the case of SDSS 173744.87582829.5 in V03b, where narrow absorption features were found with the HET) or limited spectral coverage (e.g., Maiolino et al. 2001, 2004; Goodrich et al. 2001).
Given this, we believe that the criteria adopted in the selection of the high-redshift non-BAL RQQs for X-ray spectral analysis (see 6) are not a cause for concern and the results we derived can be considered representative of the RQQ population at .
8. Summary
We have analyzed Chandra observations of a sample of 11 quasars at
3.96–4.55 selected from the PSS and APM surveys.
These are among the most luminous quasars known and
represent ideal probes of the dawn of the modern Universe.
Given the optical luminosities of these quasars
( to 29.5), the present study can be considered
complementary to past work (e.g., V03a; V03b).
The principal results of this work are
-
1.
Nine of the quasars have been detected, thus increasing the number of X-ray detected AGN at to 90. Including also the two X-ray non-detections, the average of the present sample, , is steeper that typically found for quasars, but consistent with the value expected applying the known dependence of this spectral index upon quasar luminosity.
-
2.
Two quasars are not detected, PSS 15065220 and PSS 23440342. If absorption intrinsic to the source were the cause of the X-ray weakness of these two objects, then column densities larger than cm-2 would be implied. In the case of PSS 15065220, we found evidence for notable features, the most prominent being broad absorption lines from Si IV and C IV. For this source it is possible that the UV absorber is linked to the absorption likely present in the X-ray band. This has been observed before in other BALQSOs at high redshift.
-
3.
Using all the available RQQs at detected by Chandra with more than 2 counts, we have derived X-ray spectral constraints for the quasar population at high redshift. A power law with =1.93 is a good parameterization of the quasar spectra in the rest-frame 2–40 keV band, similar to what is found for the hard X-ray continua of low- and intermediate-redshift quasars. Our results are consistent with a lack of significant spectral evolution of quasar X-ray continua over cosmic time. A partial correlation analysis of the photon index vs. redshift/luminosity for a uniform sample of quasars over a broad range of redshift and luminosity is required to address this issue further.
The tight constraint on the absorption intrinsic to the quasars, cm-2, indicates the lack of widespread obscuration.
References
- (1) Abazajian, K., et al. 2004, AJ, 128, 502
- (2) Anders, E., & Grevesse, N. 1989, Geochim. Cosmochim. Acta, 53, 197
- (3) Arnaud, K. A. 1996, in ASP Conf. Ser. 101, Astronomical Data Analysis Software and Systems V, ed. G. Jacoby, & J. Barnes (San Francisco: ASP), 17
- (4) Avni, Y. 1976, ApJ, 210, 642
- (5) Avni, Y., Worrall, D. M., & Morgan Jr., W. A. 1995, ApJ, 454, 673
- (6) Bassett, L. C., Brandt, W. N., Schneider, D. P., Vignali, C., Chartas, G., & Garmire, G. P. 2004, AJ, 128, 523
- (7) Bauer, F. E., Alexander, D. M., Brandt, W. N., Schneider, D. P., Treister, E., Hornschemeier, A. E., & Garmire, G. P. 2004, AJ, 128, 2048
- (8) Bechtold, J., et al. 2003, ApJ, 588, 119
- (9) Becker, R. H., White, R. L., & Helfand, D. J. 1995, ApJ, 450, 559
- (10) Bertin, E., & Arnouts, S. 1996, A&AS, 117, 393
- (11) Brandt, W. N., Laor, A., & Wills, B. J. 2000, ApJ, 528, 637
- (12) Brandt, W. N., Guainazzi, M., Kaspi, S., Fan, X., Schneider, D. P., Strauss, M. A., Clavel, J., & Gunn, J. E. 2001, AJ, 121, 591
- (13) Brandt, W. N., et al. 2002, ApJ, 569, L5
- (14) Brandt, W. N., Vignali, C., Lehmer, B. D., Lopez, L. A., Schneider, D. P., & Strateva, I. V. 2005, in Growing Black Holes, ed. A. Merloni, S. Nayakshin, & R. Sunyaev (Berlin: Springer-Verlag), in press (astro-ph/0411355)
- (15) Brown, B. W. M., Hollander, M., & Korwar, R. M. 1974, in Reliability and Biometry, ed. F. Proschan, & R. J. Serfling (Philadelphia: SIAM), 327
- (16) Carilli, C. L., Bertoldi, F., Omont, A., Cox, P., McMahon, R. G., & Isaak, K. G. 2001, AJ, 122, 1679
- (17) Cash, W. 1979, ApJ, 228, 939
- (18) Castander, F. J., Treister, E., Maccarone, T. J., Coppi, P. S., Maza, J., Zepf, S. E., & Guzman, R. 2003, AJ, 125, 1689
- (19) Chartas, G., Brandt, W. N., Gallagher, S. C., & Garmire, G. P., 2002, ApJ, 579, 169
- (20) Cobos Duenas, F. J., Tejada, C., Hill, G. J., & Perez, G. F. 1998, Proc. SPIE, 3355, 424
- (21) Comerford, J. M., Haiman, Z., & Schaye, J. 2002, ApJ, 580, 63
- (22) Condon, J. J., Cotton, W. D., Greisen, E. W., Yin, Q. F., Perley, R. A., Taylor, G. B., & Broderick, J. J. 1998, AJ, 115, 1693
- (23) Dai, X., Chartas, G., Eracleous, M., & Garmire, G. P. 2004, ApJ, 605, 45 Dempster, A. P., Laird, N. M., & Rubin, D. B. 1977, J. Roy. Stat. Soc. B, 39, 1
- (24) Dickey, J. M., & Lockman, F. J. 1990, ARA&A, 28, 215
- (25) Dietrich, M., Appenzeller, I., Hamann, F., Heidt, J., Jäger, K., Vestergaard, M., & Wagner, S. J. 2003a, A&A, 398, 891
- (26) Dietrich, M., Hamann, F., Shields, J. C., Constantin, A., Heidt, J., Jäger, K., Vestergaard, M., & Wagner, S. J. 2003b, ApJ, 589, 722
- (27) Djorgovski, S. G., Gal, R. R., Odewahn, S. C., de Carvalho, R. R., Brunner, R., Longo, G., & Scaramella, R. 1998, in Wide Field Surveys in Cosmology, ed. S. Colombi, & Y. Mellier (Paris: Editions Frontieres), 89
- (28) Eadie, W. T., Dryard, D., James, F. E., Roos, M., & Sadoulet, B. 1971, Statistical Methods in Experimental Physics, (Amsterdam: North-Holland)
- (29) Ebeling, H., White, D. A., & Rangarajan, F. V. N. 2005, MNRAS, submitted
- (30) Elvis, M., Fiore, F., Wilkes, B., McDowell, J. C., & Bechtold, J. 1994, ApJ, 422, 60
- (31) Fan, X., et al. 2001, AJ, 121, 31
- (32) Farrah, D., Priddey, R., Wilman, R., Haenhelt, M., & McMahon, R. G. 2004, ApJ, 611, L13
- (33) Ferrero, E., & Brinkmann, W. 2003, A&A, 402, 465
- (34) Freeman, P. E., Kashyap, V., Rosner, R., & Lamb, D. Q. 2002, ApJS, 138, 185
- (35) Gallagher, S. C., Brandt, W. N., Chartas, G., & Garmire, G. P. 2002, ApJ, 567, 37
- (36) Garmire, G. P., Bautz, M. W., Ford, P. G., Nousek, J. A., & Ricker, G. R. 2003, Proc. SPIE, 4851, 28
- (37) Gehrels, N. 1986, ApJ, 303, 336
- (38) George, I. M., Turner, T. J., Yaqoob, T., Netzer, H., Laor, A., Mushotzky, R. F., Nandra, K., & Takahashi, T. 2000, ApJ, 531, 52
- (39) Giommi, P., Angelini, L., Jacobs, P., & Tagliaferri, G. 1992, in ASP Conf. Ser. 25, Astronomical Data Analysis Software and Systems I, ed. D. M. Worrall, C. Biemesderfer, & J. Barnes (San Francisco: ASP), 100
- (40) Goodrich, R. W., et al. 2001, ApJ, 561, L23
- (41) Green, P. J., Aldcroft, T. L., Mathur, S., Wilkes, B. J., & Elvis, M. 2001, ApJ, 558, 109
- (42) Grupe, D., Mathur, S., Wilkes, B., & Elvis, M. 2004, AJ, 127, 1
- (43) Hamann, F., & Ferland, G. 1999, ARA&A, 37, 487
- (44) Hill, G. J., Nicklas, H. E., MacQueen, P. J., Mitsch, W., Wellem, W., Altmann, W., Wesley, G. L., & Ray, F. B. 1998a, Proc. SPIE, 3355, 433
- (45) Hill, G. J., Nicklas, H. E., MacQueen, P. J., Tejada, C., Cobos Duenas, F. J., & Mitsch, W. 1998b, Proc. SPIE, 3355, 375
- (46) Irwin, M., McMahon, R. G., & Hazard, C. 1991, in ASP Conf. Ser. 21, The space distribution of quasars, ed. D. Crampton (San Francisco: ASP), 117
- (47) Iwasawa, K., & Taniguchi, Y. 1993, ApJ, 413, L15
- (48) Kaspi, S., Brandt, W. N., & Schneider, D. P. 2000, AJ, 119, 2031
- (49) Kellermann, K. I., Sramek, R., Schmidt, M., Shaffer, D. B., & Green, R. F. 1989, AJ, 98, 1195
- (50) Kraft, R. P., Burrows, D. N., & Nousek, J. A. 1991, ApJ, 374, 344
- (51) LaValley, M., Isobe, T., & Feigelson, E. D. 1992, in ASP Conf. Ser. 25, Astronomical Data Analysis Software and Systems, ed. D. M. Worrall, C. Biemesderfer, & J. Barnes (San Francisco: ASP), 245
- (52) Lyons, L. 1991, Data Analysis for Physical Science Students, (Cambridge: Cambridge University Press)
- (53) Maiolino, R., Mannucci, F., Baffa, C., Gennari, S., & Oliva, E. 2001, A&A, 372, L5
- (54) Maiolino, R., Oliva, E., Ghinassi, F., Pedani, M., Mannucci, F., Mujica, R., & Juarez, Y. 2004, A&A, 420, 889
- (55) Mukai, K. 2002, pimms Users’ Guide (Greenbelt: NASA/GSFC)
- (56) Nandra, K., George, I. M., Mushotzky, R. F., Turner, T. J., & Yaqoob, T. 1997, ApJ, 488, L91
- (57) Oke, J. B., & Gunn., J. E. 1983, ApJ, 266, 713
- (58) Omont, A., Cox, P., Bertoldi, F., McMahon, R. G., Carilli, C., & Isaak, K. G. 2001, A&A, 374, 371
- (59) Page, K. L., O’Brien, P. T., Reeves, J. N., & Turner, M. J. L. 2004, MNRAS, 347, 316
- (60) Page, K. L., Turner, M. J. L., Reeves, J. N., O’Brien, P. T., & Sembay, S. 2003, MNRAS, 338, 1004
- (61) Peroux, C., Storrie-Lombardi, L. J., McMahon, R. G., Irwin, M., & Hook, I. M. 2001, AJ, 121, 1799
- (62) Piconcelli, E., Jimenez-Bailon, E., Guainazzi, M., & Schartel, N., Rodriguez-Pascual, P.M., & Santos-Lleó, M. 2005, A&A, in press (astro-ph/0411051)
- (63) Prochaska, J. X., Gawiser, E., Wolfe, A. M., Cooke, J., & Gelino, D. 2003, ApJS, 147, 227
- (64) Ramsey, L. W., et al. 1998, Proc. SPIE, 3352, 34
- (65) Rees, M. J. 1999, in After the Dark Ages: When Galaxies were Young (the Universe at ), ed. S. Holt, & E. Smith (New York: American Institute of Physics), 13
- (66) Reeves, J. N., & Turner, M. J. L. 2000, MNRAS, 316, 234
- (67) Schlegel, D. J., Finkbeiner, D. P., & Davis, M. 1998, ApJ, 500, 525
- (68) Schmidt, M., & Green, R. F. 1983, ApJ, 269, 352
- (69) Schneider, D. P., Schmidt, M., Hasinger, G., Lehmann, I., Gunn, J. E., Giacconi, R., Trümper, J., & Zamorani, G. 1998, AJ, 115, 1230
- (70) Schneider, D. P., et al. 2001, AJ, 121, 1232
- (71) Schwartz, D. A., & Virani, S. N. 2004, ApJ, 615, L21
- (72) Silverman, J. D., et al. 2002, ApJ, 569, L1
- (73) Spergel, D. N., et al. 2003, ApJS, 148, 175
- (74) Storrie-Lombardi, L. J., McMahon, R. G., Irwin, M. J., & Hazard, C. 1996, ApJ, 468, 121
- (75) Storrie-Lombardi, L. J., Irwin, M. J., McMahon, R. G., & Hook, I. M. 2001, MNRAS, 322, 933
- (76) Treister, E., Castander, F.J., Maccarone, Herrera, D., Gaiser, E., Maza, J., & Coppi, P. S. 2004, ApJ, 603, 36
- (77) Vanden Berk, D. E., et al. 2001, AJ, 122, 549
- (78) Vignali, C., Brandt, W. N., Fan, X., Gunn, J. E., Kaspi, S., Schneider, D. P., & Strauss, M. A. 2001, AJ, 122, 2143 (V01a)
- (79) Vignali, C., Comastri, A., Cappi, M., Palumbo, G. G. C., & Matsuoka, M. 2001b, in AIP Conf. Proc. 599, X-ray Astronomy: Stellar Endpoints, AGN, and the X-ray background, ed. N. White, G. Malaguti, & G. Palumbo (New York: New York: American Institute of Physics), 999 (V01b)
- (80) Vignali, C., Bauer, F. E., Alexander, D. M., Brandt, W. N., Hornschemeier, A. E., Schneider, D. P., & Garmire, G. P. 2002, ApJ, 580, L105 (V02)
- (81) Vignali, C., Brandt, W. N., & Schneider, D. P. 2003, AJ, 125, 433 (VBS03)
- (82) Vignali, C., Brandt, W. N., Schneider, D. P., Garmire, G. P., & Kaspi, S. 2003, AJ, 125, 418 (V03a)
- (83) Vignali, C., et al. 2003, AJ, 125, 2876 (V03b)
- (84) Vignali, C., Brandt, W. N., & Schneider, D. P. 2004, in ASP Conf. Ser. 311, AGN Physics with the Sloan Digital Sky Survey, ed. G. T. Richards, & P. B. Hall (San Francisco: ASP), 317
| Object | Optical | Optical | aaDistance between the optical and X-ray positions; the dots indicate no X-ray detection. | X-ray | Exp. TimebbThe Chandra exposure time has been corrected for detector dead time. | ||
|---|---|---|---|---|---|---|---|
| Name | () | () | (arcsec) | Obs. Date | (ks) | Ref. | |
| BR 03311622 | 4.36 | 03 34 13.4 | 16 12 04.8 | 0.4 | 2003 Jun 17 | 4.67 | 1,2 |
| BR 03533820 | 4.55 | 03 55 04.9 | 38 11 42.3 | 0.3 | 2003 Sep 10 | 4.06 | 1,2 |
| BR 04185723 | 4.46 | 04 19 50.9 | 57 16 13.1 | 0.7 | 2003 Jun 15 | 3.99 | 1,2 |
| BR 04242209 | 4.32 | 04 26 10.3 | 22 02 17.6 | 0.4 | 2002 Dec 14 | 4.67 | 1,2 |
| PSS 07474434 | 4.43 | 07 47 49.7 | 44 34 16.9 | 0.5 | 2002 Dec 17 | 4.54 | 1 |
| PSS 10581245 | 4.33 | 10 58 58.4 | 12 45 54.8 | 0.1 | 2003 Mar 2–3 | 5.05 | 3 |
| BR 11171329 | 3.96 | 11 20 10.3 | 13 46 25.7 | 0.4 | 2003 Jan 28 | 4.70 | 4 |
| PSS 15065220 | 4.18 | 15 06 54.5 | 52 20 05.2 | 2003 Mar 14 | 4.86 | 3 | |
| PSS 16465514 | 4.04 | 16 46 56.4 | 55 14 46.4 | 0.3 | 2003 Sep 10 | 4.85 | 1 |
| BR 22136729 | 4.47 | 22 16 51.9 | 67 14 43.4 | 0.4 | 2003 Mar 10 | 4.90 | 1,2 |
| PSS 23440342 | 4.24 | 23 44 03.2 | 03 42 25.5 | 2003 Nov 20 | 5.10 | 1 |
Note. — The optical positions of the quasars have been obtained using SExtractor (Bertin & Arnouts 1996) on the DPOSS2 images, while the X-ray positions have been obtained with wavdetect.
References. — (1) Peroux et al. 2001; (2) Storrie-Lombardi et al. 2001; (3) Omont et al. 2001; (4) Storrie-Lombardi et al. 1996.
| X-ray Countsa | ||||||
|---|---|---|---|---|---|---|
| Object | [0.3–0.5 keV] | [0.5–2 keV] | [2–8 keV] | [0.5–8 keV] | Band Ratiobb We calculated errors at the level for the band ratio and effective photon index following the “numerical method” described in 1.7.3 of Lyons (1991); this avoids the failure of the standard approximate variance formula when the number of counts is small (see 2.4.5 of Eadie et al. 1971). The band ratios and photon indices have been obtained applying the correction required to account for the ACIS quantum efficiency decay at low energy. | bb We calculated errors at the level for the band ratio and effective photon index following the “numerical method” described in 1.7.3 of Lyons (1991); this avoids the failure of the standard approximate variance formula when the number of counts is small (see 2.4.5 of Eadie et al. 1971). The band ratios and photon indices have been obtained applying the correction required to account for the ACIS quantum efficiency decay at low energy. |
| BR 03311622 | 8.9 | 3.9 | 12.6 | 0.34 | 1.6 | |
| BR 03533820 | 4.0 | 45.9 | 10.9 | 56.7 | 0.18 | 2.0 |
| BR 04185723 | 7.0 | 9.0 | ||||
| BR 04242209 | 10.0 | 11.9 | ||||
| PSS 07474434 | 6.0 | 6.0 | ||||
| PSS 10581245 | 3.0 | 5.0 | ||||
| BR 11171329 | 2.0 | 2.0 | ||||
| PSS 15065220 | ||||||
| PSS 16465514 | 6.0 | 6.0 | ||||
| BR 22136729 | 17.9 | 3.0 | 20.9 | 0.13 | 2.3 | |
| PSS 23440342 | ||||||
| Object | aa Errors on the X-ray counts were computed according to Tables 1 and 2 of Gehrels (1986) and correspond to the 1 level; these were calculated using Poisson statistics. The upper limits are at the 95% confidence level and were computed according to Kraft, Burrows, & Nousek (1991). For sake of clarity, upper limits of 3.0, 4.8, and 6.4 indicate that 0, 1, and 2 X-ray counts, respectively, have been found within an extraction region of radius 2′′ centered on the optical position of the quasar (considering the background within this source extraction region negligible). | bbRest-frame 2500 Å flux density in units of erg cm-2 s-1 Hz-1. | Count rateccObserved count rate computed in the 0.5–2 keV band in units of counts s-1. | ddGalactic absorption-corrected flux in the observed 0.5–2 keV band in units of erg cm-2 s-1. These fluxes and the following X-ray parameters have been corrected for the ACIS quantum efficiency decay at low energy. | eeRest-frame 2 keV flux density in units of erg cm-2 s-1 Hz-1. | ffRest-frame 2–10 keV luminosity in units of erg s-1. | ggErrors have been computed following the “numerical method” described in 1.7.3 of Lyons (1991); both the statistical uncertainties on the X-ray count rates and the effects of the observed ranges of the X-ray and optical continuum shapes have been taken into account (see 3 of V01 for details). | hhRadio-loudness parameter, defined as = (rest frame; e.g., Kellermann et al. 1989). The rest-frame 5 GHz flux density is computed from the observed 1.4 GHz flux density (mainly taken from the FIRST and the NVSS) assuming a radio power-law slope of , with . For two quasars, BR 04185723 and BR 22136729, no radio measurements are available. | ||||
|---|---|---|---|---|---|---|---|---|---|---|---|---|
| (1) | (2) | (3) | (4) | (5) | (6) | (7) | (8) | (9) | (10) | (11) | (12) | (13) |
| BR 03311622 | 5.99 | 17.7 | 4.64 | 47.3 | 29.3 | 1.90 | 8.5 | 6.81 | 45.1 | 45.3 | ii1.4 GHz flux density from FIRST (Becker, White, & Helfand 1995) . | |
| BR 03533820 | 1.51 | 17.9 | 3.86 | 47.2 | 29.2 | 11.30 | 44.7 | 37.04 | 45.8 | 46.0 | 1.54 | 5.2ii1.4 GHz flux density from FIRST (Becker, White, & Helfand 1995) . |
| BR 04185723 | 1.72 | 17.8 | 4.24 | 47.3 | 29.2 | 1.76 | 7.0 | 5.69 | 45.0 | 45.2 | ||
| BR 04242209 | 2.51 | 18.0 | 3.52 | 47.2 | 29.0 | 2.14 | 8.6 | 6.84 | 45.1 | 45.3 | 1.81 | ii1.4 GHz flux density from FIRST (Becker, White, & Helfand 1995) . |
| PSS 07474434 | 5.25 | 18.4 | 2.44 | 47.0 | 28.6 | 1.32 | 5.7 | 4.66 | 44.9 | 45.1 | 1.81 | jj1.4 GHz flux density from NVSS (Condon et al. 1998). |
| PSS 10581245 | 2.05 | 17.7 | 4.64 | 47.3 | 29.3 | 0.59 | 2.4 | 1.88 | 44.5 | 44.7 | jj1.4 GHz flux density from NVSS (Condon et al. 1998). | |
| BR 11171329 | 5.05 | 18.3 | 2.67 | 47.0 | 28.5 | 0.43 | 1.8 | 1.37 | 44.3 | 44.5 | ii1.4 GHz flux density from FIRST (Becker, White, & Helfand 1995) . | |
| PSS 15065220 | 1.68 | 18.3 | 2.67 | 47.0 | 28.6 | jj1.4 GHz flux density from NVSS (Condon et al. 1998). | ||||||
| PSS 16465514 | 2.34 | 17.4 | 6.12 | 47.4 | 29.5 | 1.24 | 5.0 | 3.78 | 44.8 | 45.0 | 2.00 | kk1.4 GHz flux density from Carilli et al. (2001). |
| BR 22136729 | 2.73 | 18.5 | 2.22 | 47.0 | 28.6 | 3.66 | 14.9 | 12.17 | 45.3 | 45.5 | 1.64 | |
| PSS 23440342 | 5.56 | 18.2 | 2.93 | 47.1 | 28.8 | ii1.4 GHz flux density from FIRST (Becker, White, & Helfand 1995) . |
Note. — Luminosities are computed using =70 km s-1 Mpc-1, =0.3, and =0.7.
| Quasars used | Number of | X-ray | aaFrom Dickey & Lockman (1990) in units of cm-2 . | |||
|---|---|---|---|---|---|---|
| in the fitting | Quasars | Median | Median | Counts | (cm-2) | |
| All RQQsbbThe slightly different spectral-fit result reported in 6 () is referred to the power-law model without absorption. | 48 | 4.43 | 28.54 | 872 | 1.93 | |
| All but the 3 highest S/N QSOs | 45 | 4.43 | 28.48 | 674 | 1.92 | |
| Most optically luminous half of the sample | 24 | 4.30 | 29.06 | 563 | 1.97 | |
| Least optically luminous half of the sample | 24 | 4.60 | 28.25 | 309 | 1.88 | |
| Highest redshift half of the sample | 24 | 4.83 | 28.10 | 373 | 1.98 | |
| Lowest redshift half of the sample | 24 | 4.20 | 28.75 | 499 | 1.92 |


Appendix A New ROSAT upper limits for 4 SDSS DR2 quasars
Here we report some additional X-ray flux upper limits for the Sloan Digital Sky Survey Data Release 2 (SDSS DR2; Abazajian et al. 2004) quasars at . These were obtained with ROSAT PSPC and HRI using only the inner 20′ of these instruments. The 3 upper limits (see Table A1) have been derived in a similar way to those shown in Table 4 of V01 using the sosta command in the ximage package (Giommi et al. 1992) Version 4.2. The magnitudes have been derived using the method described in 2.2 of VBS03.
| Object | aaColumn density in the quasar rest frame. | bbRadio-loudness parameter. | ||||
|---|---|---|---|---|---|---|
| SDSS 004054.65091526.79 | 4.973 | 19.3 | 27.6 | |||
| SDSS 100645.60462717.25 | 4.440 | 20.1 | 26.7 | |||
| SDSS 101053.00531144.82 | 4.506 | 20.1 | 26.7 | |||
| SDSS 123735.47642936.00 | 4.334 | 20.1 | 26.6 | |||
| SDSS 140146.53024434.72 | 4.375 | 18.7 | 28.0 | |||
| SDSS 150730.63553710.83 | 4.499 | 20.2 | 26.6 | |||
| SDSS 213243.26010633.91 | 4.032 | 20.2 | 26.4 |
Appendix B Optical, X-ray, and Radio Properties of Quasars in Archival Chandra Observations
Here we report the main optical, X-ray, and radio properties for quasars with unpublished Chandra observations. Note that BR 12020725 was detected also by ROSAT (Kaspi, Brandt, & Schneider 2000).
| Object | aaGalactic absorption-corrected flux in the observed 0.5–2 keV band in units of erg cm-2 s-1. | bbRest-frame 2 keV luminosity density (erg s-1 Hz-1). | |||||||||
|---|---|---|---|---|---|---|---|---|---|---|---|
| PSS 01343307 | 4.53 | 18.8 | 1.69 | 31.80 | 28.3 | 11.5 | 9.45 | 27.55 | 45.44 | 1.63 | |
| PSS 08085215 | 4.44 | 18.2 | 2.93 | 32.03 | 28.8 | 3.5 | 2.81 | 27.01 | 44.90 | 0.2 | |
| BR 12020725 | 4.70 | 18.0 | 3.52 | 32.14 | 29.1 | 8.5 | 7.21 | 27.45 | 45.34 | ||
| BR 16000724 | 4.38 | 19.3 | 1.06 | 31.58 | 27.7 | 6.8 | 5.43 | 27.28 | 45.21 | ||
| BR 22350301ccBALQSO. | 4.25 | 18.9 | 1.54 | 31.72 | 28.1 | ||||||
| PSS 23221944 | 4.12 | 17.9 | 3.86 | 32.09 | 29.0 | 10.4 | 7.92 | 27.41 | 45.30 | 0.2 |
Note. — Units are the same as in Table 3.