Investigation of the rapid magnetic field variability
in Equ
Abstract
We investigated magnetic variability of the roAp star Equ (HD 201601) with high time resolution. Measurements of the stellar longitudinal magnetic field were performed with the hydrogen line polarimeter and the 6-m optical telescope of Special Astrophysical Observatory (Russia) on 20/21 August 1989. We obtained a single 3-hour series of 1720 rapid measurements for this star with the average time resolution of 6.6 sec. The averaged value of on this night equals G. Both the power spectrum and the amplitude spectrum of the time series are essentially flat. However, they show the presence of a marginally significant magnetic period at min. which is real with the probability 67 %. The amplitude of the magnetic field variations with this period equals G. We did not detect variations of field in Equ with the well-known photometric period, min.
1 Introduction
Rapid oscillations in some of Ap-stars were discovered by Kurtz & Wegner (1979), and Kurtz (1982). These oscillations are due to high-overtone p-mode pulsations, and appear as rapid periodic photometric variations in B and V filters of the Johnson broadband photometric system. Periods of oscillations are in the range 4–16 min., and photometric variations exhibit low amplitudes. They are independent on photometric variations caused by the stellar rotation.
Rapidly oscillating Ap-stars are often refered to as roAp-stars, and this class presently contains 32 stars (Kurtz & Martinez 2000).
Search for rapid variations of the radial velocity in Equ (HD 201601, A9p SrCrEu, mag) was initialized by Bychkov (1987, 1988). Paper by Zverko et al. (1989) reported the search for a rapid variability of its magnetic field and radial velocity. All these early investigations used the photometric technique of observations, and did not yield conclusive results due to low accuracy. Recently, Kochukhov & Ryabchikova (2001) performed similar research using modern equipment, and have obtained reliable phase variations of the radial velocity in Equ.
Recently some research groups attempted to observe rapid variations of its magnetic field. Particularly interesting is a possible variability of the magnetic field with the pulsation period of Equ. Leone & Kurtz (2003) reported a discovery of rapid variations of the stellar longitudinal (effective) magnetic field with a period of 12.1 min., and the amplitude equal to G. In a later communication Savanov et al. (2003) have found variations of the magnetic field modulus with the period 12.53 min. with the amplitude G. The authors reported in their paper variability of a separation between the resolved Zeeman components of the Fe II 6149.2 A line.
On the other hand, Kochukhov et al. (2004a) reported the absence of variations of the longitudinal magnetic field in Equ, which directly contradicts earlier claims by Leone & Kurtz (2003). Kochukhov et al. (2004a) obtained a series of 210 spectropolarimetric observations with a high time resolution, and found no variations with amplitudes above G in the circularly polarized components of 13 Nd III lines. Such a limit represents their confidence level. Moreover, Kochukhov et al. (2004b) have shown that possible variations of the surface magnetic field in Equ do not exceed G in short time scales (observations in Fe II 6149.25 and Fe I 6173.34 lines).
Recently Hubrig et al. (2004) concluded a search for rapid variability of the longitudinal field in several magnetic stars (observations in circularly polarized profiles of hydrogen lines). Unfortunately, their results on Equ are not conclusive due to a small number of points.
This paper presents results of our search for rapid periodic variations of the longitudinal field in Equ. We have performed Fourier spectral analysis of archival time series of 1720 continuous measurements in the search for periods. Individual points were measured with a very fine time resolution ( 6 seconds on the average).
2 Observations and data analysis
2.1 Instrumentation
We used the hydrogen line polarimeter (Bychkov et al. 1988; Shtol’ 1991, 1993) for measurements of the longitudinal stellar magnetic field . The polarimeter was placed in the prime focus of the 6-meter telescope in order to minimize the influence of instrumental effects from other optical elements of the telescope.
The hydrogen line polarimeter was used to determine circular polarization of radiation () simultaneously in both wings of a hydrogen line. Actual observations were performed in two Balmer lines, and . The polarimeter cuts out two narrow bands from the line wings of the width 18 Å each, using a special mask. Both spectral transmission bands were located symmetrically about the line core, and the edges of transmission were shifted by 2 Å away from the core.
Profiles of both and lines are usually very similar but are not identical.
First, we determined the average profiles of both lines separately with the same mask, which was described above. Then the averaged line profiles were used to determine the transformation coefficient between the degree of circular polarization measured in line wings, and the stellar effective magnetic field . That transformation was measured in both and line wings simultaneously, taking into account a real contribution of each line to the total flux (weighted by the number of photons received per second). At the time of actual observations of Equ the transformation coefficient was equal to G per 1 % of the circular polarization.
Measurements of the circular polarization were performed both in the blue and red line wings simultaneously, which allowed us to find and take into account instrumental contribution to the observed polarization. Stability of the modulator and other optical and electronic components of our instrumentation were constantly monitored at the time of observations. Moreover, at the time of the observing run we measured also other stars with the well known values of the magnetic field , usually 2-3 times per run.
2.2 Observations
Observations of the magnetic field in Equ were performed during a single night of 20/21 August 1989. Heliocentric moments of the beginning and the end of our observations are JD 2447759.414471 and .545842, respectively.
Time length of a single exposure was determined by the time of accumulation of up to 800000 photons, and it varied between 3 and 24 seconds. The average time length of a single observation was equal to 6.6 sec in our run. Time span between the end of a previous exposure and the beginning of the following one did not exceed 0.05 sec, which means that a series of measurements was practically continuous. The total time length of our observing run of Equ was equal to 189 minutes, which enabled us to collect 1720 estimates of of this star. Such a large number of points in a single, uninterrupted series allowed us to compute reliable power spectra of the above data.
Photon statistics implies some rough estimates of the error of a single magnetic field determination. The error
| (1) |
where denotes the number of accumulated photons (Shtol’ 1993).
The error of a single measurement can be estimated in an independent way. We assume that the projected magnetic field does not change at the time of observations, and the scatter of individual points results from random observational errors. Then, the error of a single measurement equals
| (2) |
for the actual series of measurements. One can see that both independent estimates of the error of an individual observation differ rather insignificantly.
We stress here that we have presented in this paper the first magnetic field measurements obtained with such a fine time resolution, without any significant readout time between measurements.
2.3 Spectral analysis of a time series
We have performed spectral analysis of the above time series using two different numerical techniques: the power spectrum and the amplitude spectrum analysis. First, the standard Fast Fourier Transform subroutines were used to analyse the above series of 1720 measurements of Equ. We have computed its power spectrum in the frequency range , which corresponds to periods ranging from 90 min. to 1 min. Fig. 1 shows the power spectrum, which is rather noisy in this frequency range. We have identified the distinct peak at 4.635 mHz, significantly exceeding the level of a spectral noise. The peak frequency corresponds to the period min.
Numbers on the vertical axis of Fig. 1 denote the values of the normalised power of our series. Spectral power of a time series is the square of the Fourier transform. In case of magnetic observations power can be measured in G2/mHz2. Normalised power of a signal is defined as the ratio of the true power and its variance, and therefore it is a dimensionless variable (Horne & Baliunas 1986).
The advantage of using the normalised power is that Scargle (1982) proposed a relation between the power at a spectral peak and the probability that the peak corresponds either to real or false period in a time series (False Alarm Probability test).
The value of a normalised power at the peak of 4.635 mHz in our measurements equals 6.327. False Alarm Probability test of the latter paper predicts, that the peak is real with the probability 67 % (cf. Section II.b in Horne & Baliunas 1986). Therefore, the spectral peak is a 1 sigma event and the corresponding period is not necessarily a real feature.

Subsequently, we have analysed the amplitude spectrum of our time series with the method developed by Kurtz (1985) and with his software (Kurtz 2004). Fig. 2 shows the amplitude spectrum which is also flat with a much lower amplitude peak at the same frequency. Fig. 2 allows one to estimate the noise level of our data, which is of the order of 250 G. The amplitude of possible periodic variations shown there is of the order of 350 G.
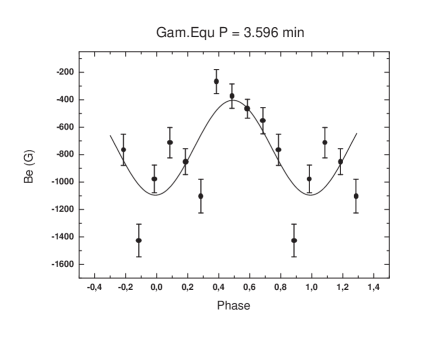
Fig. 3 presents the magnetic phase curve for Equ corresponding to the period min. Phase curve was fitted to ten points, which were obtained by averaging of individual noisy measurements in phase bins of the width . The value of averaged over all phases equals G, and the amplitude of the phase curve is G.
One should note that the phase plot in Fig. 3 does not confirm the reality of the peak in Fourier transform. Any high peak in the FT will produce a phase plot where you can see apparent variation. That is true whether the peak is real or spurious (Kurtz 2004). The only useful information given by Fig. 3 is that the phase coverage of the data in our series is satisfactory, assuming that the min period, or rather 4.635 mHz peak frequency, is real.

3 Discusion
Most of the previously analysed magnetic measurements of Equ were obtained in metal lines. Consequently, the results could be affected by a nonuniform distribution of these elements over the stellar surface. Such a well known effect is common among Ap stars. Moreover, measurements in metal lines in principle may be distorted by other effects, e.g. by complex blending of lines, cross-over effect, etc.
The only exception is the paper by Hubrig et al. (2004) who obtained their measurements in wings of the hydrogen Balmer lines. As a consequence, their data are free of the above effects, and they seem to be more credible since the hydrogen line data represent best the value of the longitudinal component of the global magnetic field integrated over the stellar disc.
It is a well known fact, that the profiles and equivalent widths of the Balmer lines exhibit periodic variations in most of Ap stars. Such variations are the result of stellar rotation, and proceed with the corresponding rotational period. For example, observations of the periodic variability of line with were presented by Madej (1983) and Musielok & Madej (1988) for a group of bright Ap stars. The presence of rapid variations in the wings of Balmer lines in Equ cannot be excluded, since momentary line profiles should reflect all changes in the structure of a stellar atmosphere caused by pulsations. However, the impact of a possible rapid variability of Balmer line profiles on the determinations is unknown and will be the subject of our research in future.
One can also note, that the amplitudes of magnetic curves observed in hydrogen lines can be distinctly larger than the amplitudes measured in metal lines. Such an effect arises since (in atmospheres of magnetic Ap stars) far wings of hydrogen lines are formed mostly in much deeper layers than metal lines. Therefore, if strength or direction of the local surface magnetic field depends on depth, i.e. if it exhibits nonzero gradient, then the apparent intensity of and its temporal variations can differ depending on the depth of a spectral line formation.
Hubrig et al. (2004) presented only 18 individual measurements of the longitudinal magnetic field of Equ, due to the cloudy weather during their 2.5 hour observing run. They did not find any significant traces of the period. In particular, Hubrig et al. (2004) did not confirm any periodic variability close to the four pulsation periods in the range 11.68–12.44 min. (Martinez et al. 1996).
We have taken 18 magnetic field points from Hubrig et al. (2004), and searched for a period disregarding small number of available points. They show pure spectral noise with amplitude of G in the frequency range mHz, hence they do not confirm our marginal period of .
We cannot rule out the possibility, that processes which cause rapid pulsations in Equ are not stable, and cause a drift of pulsation periods and amplitudes with time. One can speculate, that our observations and the period of obtained in 1989 ( min.) do not correspond to periods obtained at a later time.
Such a hypothesis would explain, why Leone & Kurtz (2003), and Savanov et al. (2003) could obtain a period close to the photometric period min. On the other hand, Kochukhov et al. (2004a,b) might have observed Equ during a time interval, when the amplitude of rapid variations of decreased below the detection limit.
Kochukhov et al. (2004a,b) measured magnetic field in lines of Fe I, Fe II, and Nd III, which may not be very sensitive to the magnetic field variations (Nd III lines were useful to measure variations of radial velocity). Plachinda & Polosukhina (1994) showed, that values of determined in different lines can differ by a factor up to a few times. Therefore, we propose that the most representative values of are those measured in wings of hydrogen Balmer lines.
4 Summary
In this paper we present our high time resolution observations of the global longitudinal magnetic field in the Ap star Equ = HD 201601. The series of 1720 measurements was obtained during 189 min. of a single uninterrupted run on August 20-21, 1989. We found that the average value of at the time of observations equals G.
Spectral analysis of this time series has shown that the frequency spectrum of Equ is flat. However, we have found possible variations of the global-scale with the period min. There is only a 67 % probability that this period is a real feature (1 sigma event), and therefore, its significance is not high.
Both the power spectrum and the amplitude spectrum of our data reveal no signal at the frequency of pulsations, which was identified with the well-known period of rapid photometric variations, min. Our amplitude spectrum (Fig. 2) shows, that if rapid variations of with the period 12.44 min. existed in 1989, then their amplitude was lower than 250 G (noise level).
There exists a number of theoretical papers, which attempt to explain the existence of nonradial pulsations in Ap stars with very short periods of the order 10 min (Bigot et al. 2000; Cunha & Gough 2000; Bigot & Dziembowski 2002). We believe, that the model of inclined pulsator presented in the latter paper is the most relevant one to discuss possible variations of the global magnetic field in Equ with periods as short as 3.6 min.
References
- (1) Angel, J.R.P., Mcgraw, J.T., Stockman, H.S., 1973, ApJ, 184, L79
- (2) Bigot, L., Dziembowski, W.A., 2002, A&A, 391, 235
- (3) Bigot, L., Provost, J., Berthomieu, G., Dziembowski, W.A., Goode, P.R., 2000, A&A, 356, 218
- (4) Bychkov, V.D., 1987, Pis’ma Astron. Zh., 13, 773
- (5) Bychkov, V.D., 1988, Magnetic Stars (Leningrad: Nauka), 197
- (6) Bychkov, V.D., Gazhur, E.B., Glagolevskij, Y.V., El’kin, V.G., Nazarenko, A.F., Naidenov, I.D., Romanyuk, I.I., 1988, Magnetic Stars (Leningrad: Nauka), 12
- (7) Bychkov, V.D., Bychkova, L.V., Madej, J., 2004, Proceedings of 49-th Conf. Stavropol University, 85
- (8) Cunha, M.S., Gough, D., 2000, MNRAS, 319, 1020
- (9) Horne, J.H., Baliunas, S.L., 1986, ApJ, 302, 757
- (10) Hubrig, S., Kurtz, D.W., Bagnulo, S., Szeifert, T., Schöller, M., Mathys, G., Dziembowski, W.A., 2004, A&A, 415, 661
- (11) Kochukhov, O., Ryabchikova, T., 2001, A&A, 374, 615
- (12) Kochukhov, O., Ryabchikova, T., Piskunov, N., 2004a, A&A, 415, L13
- (13) Kochukhov, O., Ryabchikova, T., Landstreet, J.D., Weiss, W.W., 2004b, MNRAS, 351, L34
- (14) Kurtz, D.W., Wegner, G., 1979, ApJ, 232, 510
- (15) Kurtz, D.W., 1982, MNRAS, 200, 807
- (16) Kurtz, D.W., 1985, MNRAS, 213, 773
- (17) Kurtz, D.W., 2004, personal comunication
- (18) Kurtz, D.W., Martinez, P., 2000, Baltic Astronomy, 9, 253
- (19) Leone, F., Kurtz, D.W., 2003, A&A, 407, L67
- (20) Madej, J., 1983, Acta Astron., 33, 253
- (21) Martinez, P., Weiss, W.W., Nelson, M.J., Kreidl, T.J., Roberts, G.R., Mkrtichian, D.E., Dorokhov, N.I., Dorokhova, T.N., Birch, P.V., 1996, MNRAS, 282, 243
- (22) Musielok, B., Madej, J., 1988, A&A, 202, 143
- (23) Plachinda, S.I., Polosukhina, N., 1994, Chemically peculiar and magnetic stars, Tatranska Lomnica, Proc. Int. Conference, 47
- (24) Savanov, I., Musaev, F.A., Bondar, A.V., 2003, IBVS N5468
- (25) Scargle, J.D. 1982, ApJ, 263, 835
- (26) Shtol’, V.G., 1991, Bull. Spec. Astrophys. Obs., 33, 176
- (27) Shtol’, V.G., 1993, Bull. Spec. Astrophys. Obs., 35, 114
- (28) Zverko, J., Bychkov, V.D., Ziznovsky, J., Hric, L., 1989, Contr. Astron. Observatory Skalnate Pleso, 18, 71