Chandra Observations of 12 Luminous Red Quasars
Abstract
We present results of a study of 12 dust-reddened quasars with 0.4 z 2.65 and reddenings in the range 0.15 1.7. We obtained ACIS-S X-ray spectra of these quasars, estimated the column densities towards them, and hence obtained the gas:dust ratios in the material obscuring the quasar. We detect all but one of the red quasars in the X-rays. Even though there is no obvious correlation between the X-ray determined column densities of our sources and their optical color or reddening, all of the sources show absorbed X-ray spectra. When we correct the luminosity for absorption, they can be placed among luminous quasars; therefore our objects belong to the group of high luminosity analogues of the sources contributing to the X-ray background seen in deep X-ray observations. Such sources are also found in serendipitous shallow X-ray surveys. There is a hint that the mean spectral slope of the red quasar is higher than that of normal, unobscured quasars, which could be an indication for higher accretion rates and/or an evolutionary effect. We investigate the number density of these sources compared to type 2 AGN based on the X-ray background and estimate how many moderate luminosity red quasars may be found in deep X-ray fields.
1 Introduction
For a long time, deciphering the nature of the X-ray background (XRB) was a key problem in astrophysics. In the last years with the launch of the new generation of X-ray telescopes, Chandra and XMM/Newton, it has been possible to resolve the XRB into discrete point sources in very deep X-ray images (e.g. Chandra Deep Field South (Giacconi et al., 2001), Lockmann Hole (Hasinger et al., 2001), Chandra Deep Field North (Brandt et al., 2001)). Most of these point sources have harder spectra than known quasars. About 90% of the X-ray sources in these deep fields have an optical counterpart with R 24 (Barger et al., 2003). Optical identification of these sources shows that while some objects are normal quasars, many are reddened quasars, narrow-line AGN or low redshift “normal” galaxies (Rosati et al., 2002). As a complement to the deep X-ray fields, studies of X-ray weak quasars have yielded harder X-ray spectra and redder optical colors than normal quasars (Risaliti et al., 2003).
The discovery of large numbers of reddened quasars and narrow-line AGN implies that a large amount of the accretion luminosity from material falling into black holes is hidden by dust (in the optical) and gas (in the soft X-ray). Although there is order-of magnitude agreement between the amount of radiation produced by quasars over the lifetime of the Universe and the mass accreted onto the black holes we see in the centers of galaxies today (Merritt & Ferrarese, 2001), there is still discussion on the fraction of quasars that are obscured by dust. Population synthesis analysis of the hard XRB estimate that up to 90% of AGN, whose evolution peaks at z 0.7, are absorbed by dust (Gilli, Salvati & Hasinger, 2001; Ueda et al., 2003). This fraction of obscured quasars does not coincide with the quasar population we are used to seeing in the optical, where the majority of quasars are blue, unabsorbed and peak at larger redshifts. We might be missing a large number of dust reddened quasars (Webster et al., 1995). It remains to be investigated what fraction of the quasar population we are missing in optical color-selected surveys, which are most effective at selecting quasars with blue optical colors.
In addition to the X-ray surveys, various techniques have been developed to find quasars that are redder than those typically found in optical quasars surveys. Radio selected quasars overall seem to have redder colors (Francis et al., 2000; Gregg et al., 2002; White et al., 2003) than optical selected samples, although there is still some debate about how much of this redness can be produced by optical synchrotron emission in these powerful radio sources. In addition, broad absorption line quasars (BAL quasars) samples have redder colors than typical quasars (Sprayberry & Foltz, 1992; Reichard et al., 2003) and higher X-ray column densities (Gallagher et al., 2001) also suggesting that a large fraction of this population is missing from optical selected samples. Searches for red quasars have yielded a higher than normal amount of lensed systems (Gregg et al., 2002; Lacy et al., 2002), whose discovery is aided by magnification bias, raising the possibility of large numbers of unmagnified obscured objects.
Although it seems clear that the reddening of the quasars is caused by the optical absorption by the warm dust obscuring the nuclear region, we do not yet know where this obscuration is taking place. The dust could be located in the host galaxy’s ISM, but obscuration could also arise due to an accretion disk’s dusty regions. There is evidence that dust exists in the Narrow Line Region (NLR) of AGN (Radomski et al., 2003) and even as we move inward of the accretion disk large dust grains could survive the radiation field in dense molecular clouds (Dopita et al., 2002). The location of the dust responsible for reddening is important in that we can compare it with the obscuring gas in the X-rays. Maiolino et al. (2001) speculate that AGN classification in the optical is different than in the X-ray with / ratios lower than Galactic by a factor of 3 up to 100. We do not know what this ratio is for extremely absorbed quasars. Simple AGN models (e.g. Antonucci (1993)) cannot explain this high dispersion, so the nuclear region of AGN is apparently more complicated than usually assumed.
In this paper we present results of X-ray observations of 12 red quasars with Chandra and compare these results with other X-ray observation of red AGN (Wilkes et al., 2002). Our principal aim is to investigate whether our optically selected are the high luminosity analogues of the faint red quasars found in the deep Chandra fields. Other shallow serendipitous X-ray surveys have found cases of high luminosity, obscured or red Type 2 quasars (Fiore et al., 2003), so our goal is that our objects belong to those group of objects fall into this category. We adopt a flat universe, , cosmology.
2 Observations and data analysis
2.1 Optical selection process
To find red quasars which could have been missed in optical surveys we applied the following three criteria: (1) the object has to be as FIRST radio source (Becker, White & Helfand, 1995), (2) it must be in the 2MASS point-source catalog (Kleinmann, 1992), and (3) it must have based on comparison with the Palomar Observatory Sky Survey first (POSS-I) or second generation (POSS-II) images (McMahon & Irwin, 1992). These criteria are similar to those of Glikman et al. (2004), but differ in one significant respect in that we also include objects which are detected on the POSS-I as long as they satisfy our criterion (using the POSS E magnitude as an approximation for R), while Glikman et al. did not. This results in the inclusion of several objects which are not present in the sample of Glikman et al. (2004).
The resulting candidate list included 20 objects detected on the POSS-I plates in addition to the 69 undetected objects in the Glikman et al. candidate list. Optical magnitudes for the candidates were obtained from the POSS-II plates, or from the Sloan Digital Sky Survey (SDSS) if they were in the area covered by data release 2 (Abazajian et al., 2004). Irregular host galaxies of or companions to our lower-redshift red quasars can often be seen in the SDSS data, in agreement with studies of other red quasars (Hines et al., 2001).
Spectroscopy of our candidate quasars was carried out in the optical and near-infrared at various facilities. Objects with emission line widths 1000km were classified as quasars. 28 of our 89 candidates turned out to be broad-line quasars with extremely red spectral energy distributions. The spectra of seven of our objects can be seen in Glikman et al. (2004), Gregg et al. (2002) and Lacy et al. (2002). The remaining five objects have similar spectra (red continuum, broad quasar lines, no features associated with stellar light). Our requirement for detection of broad lines naturally excludes Type 2 AGN, and thus results in an expected X-ray column density .
The selection of red quasars based on colors can, in principle, include objects which are red due to galaxy starlight, hence the need for high quality spectra. However, since all the objects under discussion in this paper are high luminosity quasars, it is not possible that the colors are dominated by starlight. Nonetheless, a quantitative discussion must go beyond colors to an actual determination of . Where our spectra covers both and , the Balmer decrement can be used for this purpose. This is the case for nine of the twelve objects. In calculating the Balmer decrements, we assumed an intrinsic = 3.2 from the SDSS quasar composite (Vanden Berk et al., 2001). The errors from the Balmer decrement measurements are derived from propagating the line flux errors. Since the broad Balmer lines are presumed to arise only in quasars, the reddening derived from the Balmer decrement is independent of any starlight in the spectrum. In the three spectra, which didn’t cover both and (FTM09064952, FTM09152418 and FTM10362828) we have fit the continuum slope following the technique described in Glikman et al. (2004). The spectra of these three quasars show no sign of starlight, e.g. from stellar absorption features (nor do the other nine spectra). Furthermore, the continuum estimates ranged up to the K-band, where in the case of our luminous obscured quasars, starlight has a negligible contribution to the spectrum, so the continuum slope should give a meaningful estimate of .
It turns out that FTM09064952 was a variable source which was especially bright when the infrared observations (2MASS) were being taken. Its reddening ( = 0.15) is still is somewhat redder than the mean SDSS quasar, but it does not compare to the extreme extinction shown by our other quasars. Nevertheless, we opted to keep FTM09064952 in our sample for comparison reasons. values are quoted in Table 1.
Our sample for study with Chandra was restricted to z 0.4 to ensure that it contained moderate to high luminosity quasars (the least well-studied obscured AGN population in the X-ray). Also, to ensure that the red colors of our quasars were not caused by an optical synchrotron component (Whiting, Webster & Francis, 2001), we included only objects with faint radio fluxes (mJy at 1.4GHz), or objects with higher radio fluxes but which show clear Balmer decrements in their optical/near-infrared spectra. Among the quasars chosen are FTM01340931 (a gravitational lens) and FTM07382750, two sources already discussed in Gregg et al. (2002).
2.2 X-ray observations
We followed up on 12 of the red quasars mentioned in section 2.1 in the X-rays to find out if these red quasars represent the high luminosity counterparts of the obscured quasars found in the deep Chandra fields. Observations were carried out with Chandra, six quasars were observed during AO3 and six during AO5 as part of the GO program (proposal numbers 03700742 and 05700838). For the observations the ACIS-S backside illuminated CCD (S3) with a 1/8 sub-array was used (faint mode). Table 1 shows the journal of observation of our quasars.
The ACIS images were analyzed with CIAO package, version 3.0.1. We used the detection algorithm celldetect; all but one source were detected at the positions predicted by the optical data. The non-detected source (FTM07382750) displays two very hard photons at the optical position of the quasar. FTM10221929 shows two peaks, it might be a missed gravitational lens, even though the detection algorithm classified it as one source.
Table 2 shows the X-ray properties of our sources. In our convention 0.2 to 10.0 represents the broad, 0.2 to 2.0 keV the soft and 2.0 to 10.0 keV the hard energy range. The hardness ratio (HR) is defined as , where S are the number of photons in the soft band and H are the number of photons in the hard band. Table 3 shows our deduced HRs in the first column. As these are not the bands typically used in Chandra surveys, we also show the HR with 0.5 - 2.0 keV in the soft band and 2.0 - 7.0 keV in the hard band in column 2 of Table 3. As expected, the color or hardness ratio of FTM09064952 (the variable source) in the X-ray was the softest in our sample.
We then extracted the source and background pulse height amplitude (PHA) spectra for the X-ray sources with more than 40 counts detected. For the source a 5” circle region and for the background a (30”,15”)-annulus region were used. The response function (RMF) was then extracted corresponding to the region of the chip, where the source was located. The spectral analysis of the X-ray sources was carried out with XSPEC version 11.2.0, as part of the Xanadu package, obtainable at HEASARC (http://xspec.gsfc.nasa.gov). An absorbed power-law model at the quasar redshift was fitted to the spectra. We used the photo-electric, redshift corrected absorption model, with Wisconsin cross sections (Morrison & McCammon, 1983), in Xspec: zwabs. These fits the yielded us the values of the spectral slope () and column density () in the rest frame of the quasar (see Table 4). The resulting spectra are shown in Figure 1.
3 Results
One of the remarkable, if not surprising, results we find, is that all of the red quasars are absorbed to some degree in the X-rays, as they have harder X-ray colors than typical quasars. Most of our sources have a low S/N, therefore we cannot get accurate spectral slopes and column densities. However, from the measured HRs alone, we can extract useful information for the faint sources. Our sample has a mean HR of 0.08 0.11 (observed frame). The mean HR changes very little (to 0.09 +/- 0.10) when we calculate it with the bands normally used in Chandra deep fields: soft = 0.5 - 2.0 keV, hard = 2.0 - 7.0 keV (see Table 3). This value is higher than expected in non-biased X-ray surveys, where the median HR of typical quasar lies more around -0.5 (Rosati et al., 2002). We then corrected the HR for redshift. For absorbed sources the absorption cutoff moves to lower energies when the object is at high redshift, so the corrected HR tends to be softer at higher redshift. We chose a HR at z = 1, that is the 0.4 - 4.0 keV and 4.0 - 20.0 keV bands in the rest frame, the values are quoted in column 3 of Table 3. The mean for the corrected HR is 0.15 0.10.
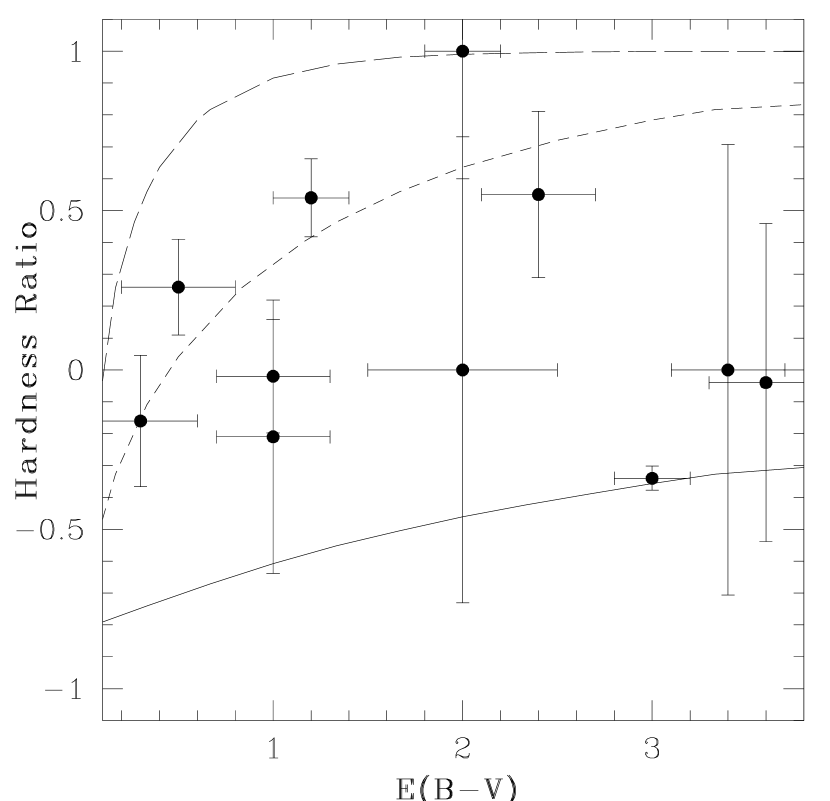
Figure 2 shows the distribution of redshift corrected hardness ratios versus reddening. There is no clear correlation between the reddening and the hardness ratio of our sample. Shown are 1 error bars on the HR to get an idea how low the S/N is. We have calculated quasar models with and different gas:dust ratios. The solid line represents the a Galactic gas:dust model (), the small dashed line represents a model with 20 times Galactic gas:dust ratio and the large dashed line is a model with a gas:dust ratio of 100 times Galactic value.
Wilkes’ X-ray observations of a sample of 26 low redshift AGN (Wilkes et al., 2002), has a mean observed frame HR of +0.14 0.05, slightly higher than our our sample. This higher HR is expected for lower redshift models as the absorption cutoff is at higher energies. Again, for the few objects of Wilkes’ sample for which we could obtain X-ray spectral information, no obvious correlation between reddening and column density is found.
Nevertheless, our redshift corrected HRs all lie around the regime where the column density tends to be around a few times , so there should be obscuration in the quasars, although not the obscuration we typically associate with Seyfert 2 galaxies, where the typical column density lies around . Column densities around are directly verified in those cases having large enough counts to allow a proper spectral fit (Table 4), which seems to indicate that the absorbed power law model we chose for the spectra is the correct one.
Also, the fact that our points all have column densities larger than expected from the dust reddening (assuming a Galactic gas:dust ratio) confirms the results of Maiolino et al. (2001), who claim that the ratio is lower than Galactic by a factor of 3 to 100 and that this is due to the circumnuclear region being dominated by large dust grains. For the largest reddenings in Figure 2, though, the gas:dust ratio seems to approach Galactic value, in contradiction to Maiolino et al. (2001). One possible explanation for this is that the ISM of the host galaxy itself could be doing the obscuration for the extremely reddened objects.
For the quasars, where we could extract a spectrum we corrected for the absorption given by our models deduced with XSPEC (Table 4). The corrected luminosity value for FTM01340931 is likely to be wrong as there is luminosity enhancement due to the gravitational lens, but the correction for the other quasars places them among the high section of the quasars luminosity function. Our quasars therefore should represent only the tip of the red quasar iceberg, at lower X-ray luminosities we should find higher numbers of them, which is in agreement with the results from the X-ray deep fields. Luminosity correction for the AGN in Wilkes’ sample do not show such high luminosities, a logical finding, as they are at lower redshifts. The fact that we don’t see these exceedingly large luminosities at low redshift in the Wilkes sample rules out the possibility that all highly reddened quasars are highly luminous. As our sample is highly luminous and at higher redshift, we are obviously missing an even larger, as yet undiscovered, population of quasars at lower luminosity, in agreement with findings from White et al. (2003).
It has often been put forward that the higher than normal steepness of the X-ray spectrum in BAL quasars and narrow line Seyfert 1 galaxies (NLS1) is a signature of a high accretion rate (Mathur, 2000; Boller, Brandt & Fink, 1996). Becker et al. (2000) speculate that the popular notion that all BAL quasars are normal quasars seen edge-on is wrong, but that the nature of BALs could be more an evolutionary effect. If BAL quasars and NLS1s were to represent an early phase in quasar evolution, the steeper than normal spectrum we find in red quasars, could also represent an evolutionary phase in the lifetime of an quasar. To investigate this possibility, we need a bright enough sample to find the intrinsic power law, as the quasars themselves are obscured. We have to probe this hypothesis on the quasars that lie on the high end of the intrinsic X-ray luminosity function.
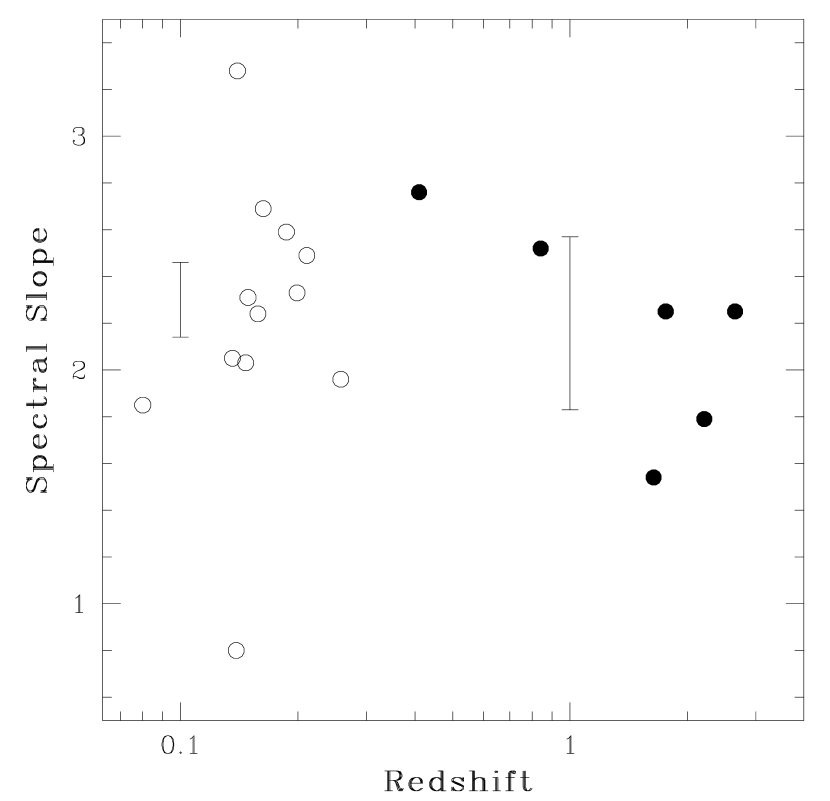
The quasars with spectral information also present a somewhat steeper than normal spectral slope than normal quasars. The unweighted mean for our sample is 2.2 0.4. We use the unweighted mean, because otherwise we would be dominated by FTM08303759, which has very small errors (weighted mean ’ = 2.8 0.1). The fact that our red quasars are radio selected actually contradicts broad band studies of quasars that have found that radio-loud quasars tend to have flatter spectra in the X-rays () than radio-quiet quasars (), although there is a large scatter for both types (Elvis et al., 1994). Usually Seyfert 1 galaxies tend to have 1.8 - 1.9 for energies between 0.2 - 10.0 keV (Walter & Fink, 1993), so our mean is slightly above the expected spectral index. To make sure that we are getting the correct spectral slopes we also fit a simple power-law to the high energy region in the spectra, where absorption is not a factor. These new spectral slopes do not vary from the other ones significantly and are well within the errors. Their mean is 2.1 0.5. The errors are larger, since we are fitting even fewer counts. The fact that the slopes from the fit to the high energy portion of the spectra are similar to those obtained from modeling of the whole spectrum suggests that our fitting is reliable, and that the higher spectral slopes we obtain are not an artifact of the absorbed power law model we chose. There is only a marginal evolution of the spectral index with redshift (Figure 3). The spectral index flattens somewhat at higher redshift, because the reflection hump in the rest-frame range of 10-40 keV moves into the Chandra band at high redshift (Schartel et al., 1996).
Wilkes’ red AGN also have statistically larger than usual spectral index, with a weighted mean of 2.3 0.2 and an unweighted mean of 2.2 0.2. The fact that the spectral indices for red quasars are larger than expected, could be an indicator of these objects having larger accretion rates. Just like NLS1 galaxies or BAL quasars, the red quasar phenomenon could be an evolutionary stage in the quasar lifetime. The quasar would be obscured as it has just ignited and the dust is still settling in. All of the deduced values of for the red quasars are still normal range for Seyfert 1 galaxies within the errors, but overall the values are higher.
We now comment briefly on our two brightest sources, for which we could get most spectral information.
3.1 FTM0134-0931
This FIRST-2MASS object is extremely red (R - K = 7.61). It has been identified as a lensed quasar, showing absorption lines from the lensing galaxy in the optical spectrum (Gregg et al., 2002). The quasar lies at a redshift of z = 2.21, while the lensing galaxy is at z = 0.76. Even with such a short exposure time of 1.1 ksec, the quasar had around 95 detection counts, which was enough to get spectral information. When we analyze the X-ray spectrum, neither an absorbed power law fit at the redshift of the quasar nor at the redshift of the lens seems to yield a satisfying fit. Nevertheless the inferred column density is strongly dependent on which system is doing the absorption ( if the lens is absorbing, for absorption within the quasar).
One fact that complicates this analysis is the fact that in the radio, we see a lensing geometry of 5 radio components, it seems the lensing galaxy itself has a radio counterpart (Gregg et al., 2002). It might well be that the lensing galaxy is an AGN, accounting for a soft component in the X-rays. So far, no simple model has been able to account for this object in any wavelength range. Further X-ray spectroscopy with a longer exposure time could support the claim that the lensing galaxy is an AGN if we do see hints for two power-laws.
3.2 FTM0830+3759
When FTM08303759 was observed for aprox. 9.2 ksec, it showed a bright X-ray source with close to 800 counts. We have fitted an absorbed power law to FTM08303759, which is absorbed in the soft X-rays (see Table 2). Notice that, even though this is fairly bright X-ray quasar, we are able to fit the broadened Iron K line, which you can see from the “hump” at around 4.5 keV in middle left of Figure 1. More features are clearly visible in the spectrum, although it is not clear if they are emission lines which become visible as the power law gets absorbed or if they are absorption lines associated with the warm absorbing gas.
In FTM08303759, we are probably looking almost directly into the accretion disk, as we see the Fe K emission line (6.4 keV) with a 4 significance. Fits with X-spec estimate its width to about 0.6 keV (4 km/s), which should only possible at the extreme relativistic areas of the accretion disk (about 20 Schwarzschild radii). This fit should, however be taken with a grain of salt, as it has big errors (0.3 keV). Better resolution will tell us what the conditions are near the black hole. It is interesting to note, that if we correct the luminosity for the obscuration obtained with the spectral fit (), it places FTM08303759 among luminous X-ray quasars in the sky ( erg/s). At such luminosities, the accretion disk could be completely ionized and would not produce the Fe K reflection component, which comes from a cooler disk (“X-ray Baldwin effect”, Nandra et al. (1995)).
FTM08303759 also has the steepest spectrum of all our red quasars, a hint for a large accretion rate. Note from the spectrum, that the quasar probably has a soft excess which is not included in the model. If we ignore the spectrum to an energy of approx. 0.85 keV the statistics significantly get better (almost all ), we obtain more absorption and a steeper spectrum ( and ). This further supports our view that FTM08303759 is a young quasar with a high accretion rate, an obscured analog to NLS1s (Mathur et al., 2001).
4 Discussion
Even though all our quasars show absorption in the X-rays it is not enough to classify them as Type 2 AGN in the X-rays (). This fact is interesting, because it is believed that highly obscured objects, preferably Seyfert 2 galaxies at low redshifts, make up the hard XRB, which peaks at around 40 keV. But so far more quasars with only moderate obscuration have been found in faint X-ray surveys than Type 2 quasars. Highly obscured quasars have been found in X-ray surveys (Norman et al., 2002), however not in the numbers necessary to account for the hard XRB (Fabian, Wilman & Crawford, 2002). It is still not certain what fraction of Compton-thick AGN make up the XRB. In that context, we don’t know what fraction of the XRB is made up by red quasars, but our objects appear to be the high luminosity equivalents of the bulk faint X-ray sources, which aren’t Compton thick.
In recent times, in the Chandra deep fields, a new population of sources has been discovered, which have extreme X-ray/optical ratios, the so-called EXOs (Koekemoer et al., 2004). In that sense, our red quasars are the high luminosity equivalent of these objects, having high X-ray and IR flux compared to the optical. The higher accretion rates suggested by the spectral indices in our objects could be a hint that they are the same population. The EXO population, seems to have atypically higher accretion rates than implied by the when comparing the their X-ray flux to the K-band magnitude of their hosts. The high accretion rates are indications of our objects and EXOs being still young and where the dust is just settling in. This may be a common phenomenon, nevertheless it still remains to be seen what fraction of objects in deep X-ray surveys belong to the population of EXOs.
Deeper optical surveys are needed to detect red quasars, beyond the highly luminous obscured ones. By obtaining the fraction of obscured quasars at a certain redshift, we can then tell if the missing population of the hard XRB is made up primarily of Type 1 obscured AGN or Compton thick Type 2 AGN. To this day, this has proven difficult because selection criteria, like color-color properties, to find red quasars are not yet established. For example, light from the host galaxies will dominate over the quasar light at blue wavelength. Optical surveys also are magnitude limited, so it will be a difficult task to find the bulk of obscured quasars (White et al., 2003). Another fact that complicates this analysis is that we found out that the red color in quasars is not closely correlated to the column density of X-ray absorbing material, which makes it difficult to speculate on X-ray properties from IR/optical data alone. Using the Spitzer Spitzer Space Telescope (Werner et al., 2004) we might be able to discern the true fraction of obscured to unobscured AGN, due to the fact that the mid-infrared emission regions of AGN are less obscured and we can easily distinguish the galaxies from AGN from the MIR SEDs alone (Lacy et al., 2004).
References
- Abazajian et al. (2004) Abazajian, K. and the SDSS Collaboration 2004, AJ, 128, 502
- Antonucci (1993) Antonucci, R. 1993, ARA&A, 31, 473
- Barger et al. (2003) Barger, A. J., Cowie, L. L., Capak, P., Alexander, D. M., Bauer, F. E., Fernandez, E., Brandt, W. N., Garmire, G. P., Hornschemeier, A. E. 2003, AJ, 126, 632
- Becker, White & Helfand (1995) Becker, R.H., White, R. L., Helfand, D. J. 1995, ApJ, 450, 559
- Becker et al. (2000) Becker, R. H., White, R. L., Gregg, M. D., Brotherton, M. S., Laurent-Muehleisen, S. A., Arav, N. 2000, ApJ, 538, 72
- Boller, Brandt & Fink (1996) Boller, Th., Brandt, W. N., Fink, H. 1996, A&A, 305, 53
- Brandt et al. (2001) Brandt, W. N., Hornschemeier, A. E., Alexander, D. M., Garmire, G. P., Schneider, D. P., Broos, P. S., Townsley, L. K., Bautz, M. W., Feigelson, E. D., Griffiths, R. E. 2001, AJ, 122, 1
- Cutri et al. (2001) Cutri, R. M., Nelson, B. O., Kirkpatrick, J. D., Huchra, J. D., Smith, P. J. 2001, in ASP Conf. Ser. 232, The New Era of Wide Field Astronomy, ed. R. G. Clowes, A. J. Adamson and G. E. Bromage (San Francisco: ASP), 78
- Dopita et al. (2002) Dopita, M. A., Groves, B. A., Sutherland, R. S., Binette, L., Cecil, G. 2002, ApJ, 572, 753
- Elvis et al. (1994) Elvis, M., Wilkes, B. J., McDowell, J. C., Green, R. F., Bechtold, J., Willner, S. P., Oey, M. S., Polomski, E., Cutri, Roc 1994, ApJS, 95, 1
- Fabian, Wilman & Crawford (2002) Fabian, A. C., Wilman, R. J., Crawford, C. S. 2002, MNRAS, 329, L18
- Fiore et al. (2003) Fiore, F. et al. 2003, A&A, 409, 79
- Francis et al. (2000) Francis, P. J., Whiting, M. T., Webster, R. L. 2000, PASA, 53, 56
- Gallagher et al. (2001) Gallagher, S. C., Brandt, W. N., Laor, A., Elvis, M., Mathur, S., Wills, B. J.; Iyomoto, N. 2001, ApJ, 546, 795
- Giacconi et al. (2001) Giacconi, R., Rosati, P., Tozzi, P., Nonino, M., Hasinger, G., Norman, C., Bergeron, J., Borgani, S., Gilli, R., Gilmozzi, R., Zheng, W. 2001, ApJ, 551, 627
- Gilli, Salvati & Hasinger (2001) Gilli, R., Salvati, M., Hasinger, G. 2001, A&A, 366, 407
- Glikman et al. (2004) Glikman E., Gregg M. D., Lacy M., Helfand D. J., Becker, R. H., White R. L. 2004, ApJ, 607, 60
- Gregg et al. (2002) Gregg, M.D., Lacy, M, White, R. L., Glikman, E., Helfand, D., Becker, R. H., Brotherton, M. S. 2002, ApJ, 564, 133
- Hasinger et al. (2001) Hasinger, G., et al. 2001, A&A, 365, L45
- Hines et al. (2001) Hines, D. C., Schmidt, G. D., Gordon, K. D., Smith, P. S., Wills, B. J., Allen, R. G., Sitko, M. L. 2001, ApJ, 563, 512
- Kleinmann (1992) Kleinmann, S. G. 1992, in Robotic telescopes in the 1990s, p. 203
- Koekemoer et al. (2004) Koekemoer, A. M., et al. 2004, ApJ, 600, L123
- Lacy et al. (2002) Lacy, M., Gregg, M., Becker, R. H., White, R. L., Glikman, E., Helfand, D., Winn, J. N. 2002, AJ, 123, 2925
- Lacy et al. (2004) Lacy, M., et al. 2004, ApJS, 154, 166
- Maiolino et al. (2001) Maiolino, R., Marconi, A., Salvati, M., Risaliti, G., Severgini, P., Oliva, E., La Franca, F., Vanzi, L. 2001, A&A, 365, 28
- Mathur et al. (2001) Mathur, S., Matt, G., Green, P. J., Elvis, M., Singh, K. P. 2001, ApJ, 551, L13
- Mathur (2000) Mathur, S. 2000, MNRAS, 314, L17
- McMahon & Irwin (1992) McMahon R. G. & Irwin, M. J. 1992, in Digitised Optical Sky Surveys, p. 417
- Merritt & Ferrarese (2001) Merritt, D. & Ferrarese, L. 2001, MNRAS, 320, 30
- Morrison & McCammon (1983) Morrison, R., McCammon, D. 1983, ApJ, 270, 119
- Nandra et al. (1995) Nandra, K., Fabian, A. C., Brandt, W. N., Kunieda, H., Matsuoka, M., Mihara, T., Ogasaka, Y., Terashima, Y. 1995, MNRAS, 276, 1
- Norman et al. (2002) Norman, C., et al. 2002, ApJ, 571, 218
- Radomski et al. (2003) Radomski, J. T., Pi a, R. K., Packham, C., Telesco, C. M., De Buizer, J. M., Fisher, R. S.; Robinson, A. 2003, ApJ, 587, 117
- Reichard et al. (2003) Reichard, T. A. et al. 2003, AJ, 126, 2594
- Risaliti et al. (2003) Risaliti, G., Elvis, M., Gilli, R., Salvati, M. 2003, ApJ, 587, 9
- Rosati et al. (2002) Rosati, P., et al. 2002, ApJ, 556, 667
- Schartel et al. (1996) Schartel, N., Green, P. J., Anderson, S. F., Hewett, P. C., Foltz, C. B., Margon, B., Brinkmann, W., Fink, H., Trumper, J. 1996, MNRAS, 283, 1015
- Sprayberry & Foltz (1992) Sprayberry, D., Foltz, C. B. 1992, ApJ, 390, 39
- Ueda et al. (2003) Ueda, Y., Akiyama, M., Ohta, K., Miyaji, T. 2003, ApJ, 598, 886
- Vanden Berk et al. (2001) Vanden Berk, D. E. et al. 2001, AJ, 122, 549
- Walter & Fink (1993) Walter, R., Fink, H. H. 1993, A&A, 274, 105
- Webster et al. (1995) Webster, R. L., Francis, P. J., Peterson, B. A., Drinkwater, M. J., Masci, F. J. 1995, Nature, 275, 469
- Werner et al. (2004) Werner, M. W., et al. 2004, in press, astro-ph/0406223
- White et al. (2003) White, R. L., Helfand, D. J., Becker, R. H., Gregg, M. D., Postman, M., Lauer, T. R., Oegerle, W. 2003, AJ, 126, 706
- Whiting, Webster & Francis (2001) Whiting, M. T., Webster, R. L., Francis, P. J 2001, MNRAS, 323, 718
- Wilkes et al. (2002) Wilkes, B. J., Schmidt, G. D., Cutri, R. M., Ghosh, H., Hines, D. C., Nelson, B., Smith, P. S. 2002, ApJ, 564, L65


| Galactic | Exposure | ||||||||
|---|---|---|---|---|---|---|---|---|---|
| Source | R.A. | Dec. | z | ()11The Galactic absorption was obtained from Skyview’s nH survey, based on Dickey & Lockman 1990, ARA&A28, 215. | K-mag | R-K | Obs. Date | (s) | |
| FTM01340931 | 01 34 35.60 | 09 31 03.00 | 2.21 | 2.73 | 13.6 | 7.6 | 0.6 0.2 | 2002 Aug 23 | 1078 |
| FTM07293336 | 07 29 10.40 | 33 36 34.00 | 0.95 | 5.35 | 14.5 | 5.2 | 1.0 0.2 | 2002 Feb 26 | 1899 |
| FTM07382750 | 07 38 20.10 | 27 50 45.50 | 1.99 | 4.91 | 15.3 | 5.5 | 1.3 0.4 | 2002 Apr 14 | 3998 |
| FTM08303759 | 08 30 11.10 | 37 59 51.90 | 0.41 | 4.23 | 14.6 | 4.8 | 1.5 0.2 | 2004 Jan 26 | 9203 |
| FTM08413604 | 08 41 05.00 | 36 04 50.10 | 0.55 | 3.41 | 14.9 | 5.9 | 1.7 0.3 | 2004 Feb 21 | 9318 |
| FTM09040145 | 09 04 50.50 | 01 45 24.60 | 1.00 | 2.74 | 14.9 | 4.8 | 1.0 0.5 | 2003 Nov 25 | 7515 |
| FTM09064952 | 09 06 51.50 | 49 52 36.00 | 1.64 | 1.78 | 15.1 | 6.1 | 0.15 0.322These objects have continuum reddening estimates. For the remaining objects, the Balmer decrement was used to derive . | 2002 Jun 01 | 5385 |
| FTM09152418 | 09 15 01.70 | 24 18 12.20 | 0.84 | 3.84 | 13.8 | 5.5 | 0.5 0.322These objects have continuum reddening estimates. For the remaining objects, the Balmer decrement was used to derive . | 2003 Nov 27 | 3205 |
| FTM10041229 | 10 04 24.90 | 12 29 22.40 | 2.65 | 3.59 | 14.5 | 6.3 | 1.2 0.3 | 2004 Jun 07 | 17666 |
| FTM10122825 | 10 12 30.50 | 28 25 27.20 | 0.94 | 2.57 | 15.2 | 5.5 | 1.8 0.3 | 2002 Apr 25 | 3309 |
| FTM10221929 | 10 22 29.40 | 19 29 39.00 | 0.41 | 2.34 | 15.2 | 4.4 | 0.5 0.3 | 2004 Mar 28 | 6607 |
| FTM10362828 | 10 36 33.50 | 28 28 21.60 | 1.76 | 2.08 | 15.3 | 4.9 | 0.5 0.322These objects have continuum reddening estimates. For the remaining objects, the Balmer decrement was used to derive . | 2002 May 07 | 4136 |
Note. — Units of right ascension are hours, minutes, and seconds, and units of declination are degrees, arcminutes, and arcseconds. We use FIRST coordinates, which are in J2000 epoch.
| Xray counts | (broad) | (0.5 - 10.0 keV) | |||||
|---|---|---|---|---|---|---|---|
| Source | R.A. | Dec. | total | soft | hard | (erg//s) | (erg/s) |
| FTM0134 | 01:34:35.66 | 09:31:02.8 | 95 12 | 52 9 | 40 8 | 7.57 | 1.10 |
| FTM0729 | 07:29:10.33 | 33:36:33.9 | 6.0 3.7 | 0 | 5.0 3.6 | 3.04 | 1.01 |
| FTM0738 | not | detected | - | - | - | - | |
| FTM0830 | 08:30:11.15 | 37:59:51.8 | 790 30 | 400 20 | 390 20 | 7.90 | 3.42 |
| FTM0841 | 08:41:04.98 | 36:04:50.2 | 5.4 3.8 | 3.0 3.0 | 3.0 3.0 | 5.17 | 4.52 |
| FTM0904 | 09:04:50.53 | 01:45:24.7 | 6.0 3.7 | 3.0 3.1 | 3.0 3.1 | 6.89 | 2.61 |
| FTM0906 | 09:06:51.53 | 49:52:35.8 | 40 8 | 26 7 | 13 5 | 6.12 | 7.35 |
| FTM0915 | 09:15:01.72 | 24:18:11.9 | 68 10 | 23 7 | 48 8 | 1.92 | 4.72 |
| FTM1004 | 10:04:24.88 | 12:29:22.4 | 41 9 | 22 7 | 26 10 | 6.74 | 2.31 |
| FTM1012 | 10:12:30.48 | 28:25:26.0 | 10 5 | 5.4 3.8 | 5.0 3.6 | 2.69 | 8.73 |
| FTM1022 | 10:22:29.39 | 19:29:39.1 | 11 5 | 3.9 3.7 | 7.4 4.2 | 1.45 | 6.28 |
| FTM1036 | 10:36:33.55 | 28:28:21.2 | 48 8 | 34 7 | 19 6 | 9.70 | 1.36 |
Note. — The flux given for the not detected source is the background flux and is considered an upper limit. Coordinates listed are in J2000 epoch and are for the Chandra X-ray data. Broad band is 0.2 - 10.0 keV, the soft band spans the 0.2 - 2.0 keV range, while the hard band energy range is 2.0 - 10.0 keV. The luminosity is given in the 0.5 - 10.0 keV rest frame.
| Source | HR | HR | corrected HR |
|---|---|---|---|
| 0.2 - 2.0 and 2.0 - 10.0 keV | 0.5 - 2.0 and 2.0 - 7.0 keV | 0.4 - 4.0 and 4.0 - 20.0 keV | |
| observed frame | observed frame | rest frame | |
| FTM01340931 | 0.12 0.13 | 0.06 0.13 | 0.54 0.12 |
| FTM07293336 | 1.00 0.72 | 1.00 0.72 | 1.00 0.40 |
| FTM07382750 | — | — | — |
| FTM08303759 | 0.02 0.04 | 0.02 0.04 | 0.34 0.04 |
| FTM08413604 | 0.00 0.71 | 0.00 0.71 | 0.00 0.71 |
| FTM09040145 | 0.00 0.73 | 0.00 0.73 | 0.00 0.73 |
| FTM09064952 | 0.34 0.20 | 0.34 0.20 | 0.21 |
| FTM09152418 | 0.36 0.15 | 0.36 0.15 | 0.26 0.15 |
| FTM10041229 | 0.10 0.23 | 0.10 0.23 | 0.55 0.26 |
| FTM10122825 | 0.04 0.50 | 0.04 0.50 | 0.04 0.50 |
| FTM10221929 | 0.32 0.50 | 0.34 0.45 | 0.21 0.43 |
| FTM10362828 | 0.27 0.17 | 0.30 0.17 | 0.02 0.18 |
Note. — The first HR uses 0.2 - 2.0 keV as the soft and 2.0 - 10.0 keV as the hard band to obtain the most photons in each band. The second HR is the HR typically used in Chandra surveys, 0.5 - 2.0 keV for the soft and 2.0 - 7.0 keV for the hard band. The last HR is corrected for redshift, so we used the bands of the first HR at z = 1 or 0.4 - 4.0 keV for the soft and 4.0 - 20.0 keV for the hard band in the quasar rest frame.
| corrected (erg/s) | |||
|---|---|---|---|
| Source | () | (0.5-10 keV rest frame) | |
| FTM01340931a | 5.9 2.8 | 1.8 0.5 | 2.4 |
| FTM01340931b | 1.4 0.6 | 1.8 0.5 | 2.4 |
| FTM08303759 | 2.7 0.2 | 2.9 0.1 | 2.1 |
| FTM09064952 | 0.6 0.9 | 1.5 1.0 | 6.3 |
| FTM09152418 | 6.7 4.3 | 2.5 1.2 | 2.3 |
| FTM10041229 | 28 25 | 2.3 1.3 | 8.6 |
| FTM10362828 | 3.8 3.4 | 2.3 1.3 | 3.5 |
Note. — a Absorption at quasar redshift, b Absorption at lens redshift. The luminosity is corrected for absorption and is given in rest frame band 0.5 - 10 keV. Note that for FTM09064952 the luminosity actually decreases because it has a flatter spectral slope than the assumed = 2 in Table 2 and a relatively small absorption.