Batch discovery of nine clusters using x-ray and or images.
Abstract
We present results of an initial search for clusters of galaxies at and above, using data from 2.9 square degrees of XMM-Newton images. By selecting weak potentially extended X-ray sources with faint or no identifications in deep, ground-based optical imaging, we have constructed a starting sample of 19 high redshift cluster candidates. Near-IR and imaging of these fields identified nine of them as high redshift systems. Six of these were confirmed spectroscopically, three at and the other three in range. The remaining three systems have solid photometric evidence to be at and . The present sample significantly increases the number of such clusters. The measured density of clusters, after discarding “low” redshift systems at is about 1.7 deg-2 (with 68 % confidence interval equal to ) for ergs cm-2 s-1 ( keV) and this is a lower limit, having screened not all potential candidate clusters. Coordinates, x-ray measures and evidence for nine x-ray selected high redshift clusters is given.
keywords:
Galaxies: clusters: general — Cosmology: observations — X-rays: galaxies: clusters1 Introduction
Although previous generations of X-ray satellites (notably ROSAT and Einstein) had the sensitivity to carry out large surveys for intermediate redshift clusters, they discovered relatively few clusters at . The number of the X-ray selected clusters at from these two observatories are twelve, five of which are at (e.g. Gioia et al. 1990, 2003; Henry et al. 1997; Viklinin et al. 1998; Nichol et al. 1999; Rosati et al. 1999, 2004; Cagnoni et al. 2001; Stanford et al. 2002).
Identifying more X-ray selected clusters at high redshift is a key step in understanding their evolution and their galaxy content. The X-ray luminosity function of clusters shows little or no evidence for evolution out to (Rosati et al. 1998, Lewis et al., 2002), except for the most luminous (massive) systems (e.g. Mullis et al, 2004). Therefore, strong cluster evolution for more typical clusters is expected to occur at higher redshifts.
Although studies of the evolution of X-ray properties of clusters have been carried out to (e.g. Ettori et al, 2004), the conclusions are limited by the handful of high redshift systems. Similarly, studies of the individual galaxies that are found in the cores of intermediate redshift clusters indicate that there is little evolution in their stellar populations out to (Stanford et al. 1997, Kodama et al. 1997, Andreon et al. 2004a).
| Long Name | Short Name | clus+bkg | bkg | (P(noise)) | (P(ext.)) | Notes | |
|---|---|---|---|---|---|---|---|
| ks | counts | counts | |||||
| (1) | (2) | (3) | (4) | (5) | (6) | (7) | (8) |
| XLSSJ022738.5-031806 | XLSSC 003 | 3.96 | 179 | 63 | 14 | 14 | |
| XLSSJ022708.7-041759 | XLSSC 005a | 14.01 | 126 | 54 | 14 | 14 | |
| XLSSJ022403.9-041328 | XLSSC 029 | 8.37 | 325 | 124 | 14 | 14 | |
| XLSSJ022157.4-034001 | c | 4.32 | 59 | 38 | 3.2 | 2.3 | low surface brightness |
| XLSSJ022253.5-032824 | f | 4.96 | 69 | 43 | 4.0 | 1.3 | |
| XLSSJ022400.5-032526 | XLSSC 032 | 2.29 | 61 | 39 | 3.4 | 1.1 | present in two pointings |
| XLSSJ022303.0-043622 | h | 9.75 | 68 | 33 | 7.5 | 0.7 | |
| XLSSJ022534.2-042535 | l | 12.80 | 63 | 43 | 2.8 | 0.5 | see sect. 3.2 |
| XLSSJ022712.0-041835 | XLSSC 005b | 14.01 | – | – | – | blended with XLSSC 005a |
Counts are for PN only in the [0.5-2] keV band and within the radius at which the grow curve converged. Hence, count rates derived from these counts are asymptotic. In col. 6, P(noise) is the probability of observing, in the studied area, a number of photons larger than quoted in col. 4, given the background (quoted in col. 5) assumed to be well known (Gehrels 1986, Andreon 2005). Of course, larger values can be derived considering a smaller area of higher S/N. In col. 7, P(ext.) is the probability to be a point source, as measured by a KS test.
The search for distant X-ray selected clusters is also driven by the need to obtain more reliable values for the key cosmological parameters. Despite the recent emergence of the so-called “concordance” cosmology, with most of the main cosmological parameters known with good accuracy, there is still significant uncertainty in the values of some of them. So, a well-designed and characterized survey for high redshift clusters can put complementary and independent constraints and be a key tool for reliable measurements of some of the cosmological parameters (see e.g. Refregier, Valtchanov & Pierre 2002, Borgani et al. 2001, Haiman et al. 2001). Individual cluster galaxies can also be used as a standard candle in a new cosmological test using the lookback time (Capoziello et al. 2004).
Here we describe the results of an initial search for clusters using X-ray observations of about three square degrees, in order to prove the feasibility of detecting and studying X-ray selected clusters at with XMM-Newton plus deep optical or near–infrared photometry. We deliver position, redshift and basic x-ray quantities for our nine systems with solid photometric or spectroscopic evidence to be at high redshift.
Sect. 2 presents the data (X-ray, NIR and imaging) and their reduction. Sect. 3 addresses the cluster confirmation using photometric data, whereas Sect. 4 reports about the spectroscopic confirmation and focuses on the estimate of the photometric redshift of the three clusters without spectroscopic redshift. Finally, Sect. 5 summarizes the results.
In this paper we adopt , and km s-1 Mpc-1.
2 The data and the sample
2.1 X-ray data and sample selection
The sample of candidate clusters is drawn from the first connected 2.9 degrees of the XMM Large-Scale Structure Survey (Pierre et al. 2004, Andreon & Pierre 2003) available at the time of NIR observations (November 2002). This comprise 26 individual contiguous XMM-Newton pointings with exposure times mostly of 10 ks and some deeper ones of typically 20 ks (see Pierre et al. 2004).
In this pilot search, our aim is to demonstrate that we can found clusters efficiently without being concerned with the precise knowledge of the cluster selection function, which indeed is needed for cosmological applications and is the focus of Bremer et al. (in preparation). A massive Coma-like cluster ( keV) at will result in XMM-Newton detection of photons in 10 ks on the PN detector, while medium to low-mass cluster ( keV, like A1060 for instance) will give counts. Therefore, both should be easely detected in our exposures.
The data were analysed and a list of possibly extended sources were generated in the manner outlined in Valtchanov, Pierre, & Gastaud (2001). Their classification procedure efficiently excludes point-like sources although it leaves some complex cases (mostly objects of low signal-to-noise or contaminated by a nearby source), as shown by the grow curve analysis described below.
We have excluded all X-ray sources at more than 12 arcmin off-axis, in order to avoid low sensitivity and regions with distorted PSF.
In the second step, we use optical -band imaging of the complete field from the CFH12K camera on CFHT (the VIRMOS-VLT Deep survey, MacCracken et al. 2003). The images were of sufficient depth ( mag) to easily recognize a cluster, but insufficient to detect, at high significance, higher redshift clusters, because of their low contrast with respect to the background. For each X-ray source, the -band image was examined for the presence of any obvious galaxy overdensity. If found, the X-ray source is discarded. A few more sources are discarded when they match obvious low redshift targets, for example a resolved (nearby) galaxy in the optical. From the resulting shortlist we have chosen 19 examples, putting priority on X-ray sources spatially coincident with optically faint galaxies, suggestive of a cluster. Nine of these examples have been confirmed at present as high redshift systems, and here we focus on them. Table 1 lists a few basic X-ray features. The faintest cluster has about 20 PN net counts in a 13 ks exposure, corresponding to a flux of about ergs cm-2 s-1.
The probability of extension listed in Table 1 is measured after the cluster candidate choice in the following way: for each source we construct the X-ray growth curve (also called integral profile) using only the PN detector photons in the keV energy band. The candidate cluster location, extent, background region and possible overlapping sources that need to be excluded from the analysis are defined from the adaptively smoothed image of the three XMM-Newton detectors (MOS1+MOS2+pn). We use the XMM-SAS task asmooth with signal-to-noise ratio of 5. Then the list of photons from the source region is extracted with xmmselect and the standard selection of good PN events. The background is measured in an adjacent annulus. The extracted X-ray growth curve is then compared to that expected for a point source at the the same angular distance from the centre using the Kolmogorov–Smirnov test.
Figure 1 shows the X-ray growth curves for 8 out of 9 high redshift systems. The remaining source, XLSSC 005b, falls too near to a bright source for a reliable extension measure. The observed profile is compared to the XMM-Newton point spread function (PSF) encircled energy fraction (the King -model, Ghizzardi 2001) convolved with the measured background. Note that the PSF EEF varies insignificantly with the off-axis angle at all studied off-axis angles (Ghizzardi 2003). The KS test applied to these pairs of curves gives the likelihood of extension listed in Table 1. Three sources are clearly extended, whereas two faint sources show no evidence for extension. The latter sources are in our list because of the conservative (and appropriate) choice of the Valtchanov et al. (2001) of keeping ambiguous cases in the sample.
Figure 2 shows the combined (MOS1 + MOS2 + pn) XMM images in keV energy band, for the X-ray sources that turned out to be photometrically or spectroscopically confirmed high redshift clusters. The images are corrected for vignetting and chip gaps using the appropriate exposure maps and over-plotted with the contours from the adaptive smoothing. In some cases (eg. h) point-like X-ray sources overlap the extended X-ray emission and might confuse the measurement of the extent probability. In all these cases, the point source is offset from the centroid of the target emission, so that its presence will increase the extent probability.
2.2 NIR observations
In order to confirm the candidates as clusters we need images in a redder band than the existing I band CFH12k observations. Galaxies at the centres of distant clusters generally have colours of passively evolving ellipticals and are consequently red objects. At , galaxies close to the centres of clusters typically have (Vega), a magnitude or more redder than the general faint galaxy population. Thus, high redshift clusters, otherwise difficult to identify in optical imaging, are detectable as clear overdensities of faint () galaxies in near IR imaging.
-band images of the sample were acquired with SOFI (Moorwood, Cuby & Lidman, 1998) on the 3.5m NTT at La Silla on November 19/20 and 20/21, 2002. SOFI is a near-infrared imager equipped with a pixels Rockwell ”Hawaii” array and was used in its large field mode, with a field of view of arcmin and a pixel size of .
All our 19 targets were exposed for 30 min, except a target not presented in this paper, resulting from the coaddition of many short jittered exposures. Photometric calibrations were obtained by observing a series of NICMOS infrared standard stars (Persson et al., 1998). The adopted value for the atmospheric absorption is 0.05 magnitudes in . The derived zero-point from all standard stars was found to be constant throughout the two nights with a scatter of 0.01–0.02 mag.
All images were flat-fielded by a special flaton-flatoff frames fully described in the SOFI manual (see also Andreon 2001). The IRAF/DIMSUM external package developed by Eisenhard et al. (see info at the IRAF www site) was used to produce accurate sky subtracted images from the dithered observations. Object detection has been performed by using SExtractor (Bertin & Arnouts 1996).
On the composite image, the seeing varied from 0.61 arcsec FWHM to 0.85 arcsec. In order to build a galaxy sample, all obvious stars have been removed from the sample by using the SExtractor stellarity index. The catalogue turned out to be complete down to magnitude measured in 2 arcsec apertures.
Figure 3 shows the three-colour () images of eight out of nine high redshift clusters, superposed by the X-ray contours shown in Figure 2. Three-colour image of the remaining system is missing because unobserved in and . Note the diversity of the optical-NIR appearance of the clusters: h is quite compact, whereas source c extends out to the nearby extended source in the W; XLLSC 005b appears, at first sight, to have a galaxy population more variegate in colour than XLSSC 029.
2.3 and observations
and images have been taken at the 4m CTIO telescope during two observing runs, in August 2000 and November 2001, with the Mosaic II camera. The Mosaic II is a camera of 8k8k pixels with 36 36 arcmin field of view. The observing time was typically 1200s in and 2750s in . The seeing in the final images was between 1.0 and 1.4 arcsec in the November 2001 run, and 0.9 to 1.0 arcsec in the August 2000 run. The useful nights of the two observing runs were photometric, however images taken during the 2001 run have been acquired at bright time (about 70 % illuminated moon), making them shallower than images taken in the previous (dark time) run. Despite being observed during bright time, all three spectroscopically confirmed clusters at can be identified (and detected) in these images, as Figure 3 shows. Images are reduced as usual and more details can be found in Andreon et al. (2004a). Typical completeness magnitudes are , mag () in a 3 arcsec aperture.
We used SExtractor (Bertin & Arnouts 1996) for object detection and characterisation. The colours were measured inside 3 arcsec apertures. We have adopted a larger aperture in and than in to account for the worse seeing of the optical data. Obvious stars (those with SExtractor stellarity index larger than 0.95) were discarded from the galaxy sample.
and images are available for 13 out of the 19 selected targets and, in particular, for 8 out 9 our photometrically/spectroscopically confirmed high redshift clusters. Figure 3 is produced using these data.
3 Results
3.1 Cluster confirmation using the -band data
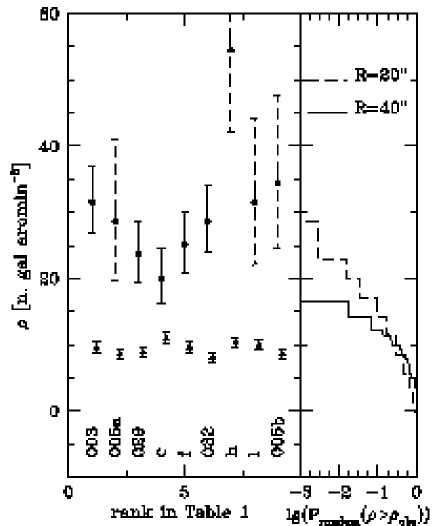
In order to identify an extended X-ray source as cluster of galaxies we look for the presence of a galaxy overdensity in the region where the X-ray source is detected. This overdensity must be significant enough so to be ruled out as a chance fluctuation. For all 19 cluster candidates X-ray sources in the SOFI field of view we have counted the surface density of galaxies brighter than inside the area where an excess of X-ray photons is detected (i.e. within the X-ray isophotal area), approximated as a circle of equivalent area. X-ray sources have an equivalent radius of 40 or 20 arcsec. is slightly deeper than the completeness limit, and has been adopted in order to make full use of the data.
The left panel of Figure 4 shows the galaxy density, , for the nine high redshift clusters, with the Poissonian 68 % confidence intervals (Gehrels 1986, Andreon 2005). Sources with solid/dashed error bars are 40/20 arcsec in radius.
The triangles in the left panel of Figure 4 show the average density (and its Poissonian 68 % confidence interval) measured in each SOFI pointing, after excluding the image borders (where the exposure time is lower) and a circle twice larger than the X-ray source.
In order to accurately measure the statistical significance of the galaxy overdensity, taking into account any possible contribution related to galaxy structures other than our 19 putative clusters, we proceed as follows: we randomly put square apertures of the same area as the actually detected cluster on our SOFI images, and we count how many times we detect a density, inside the apertures, higher than . As before, we exclude image borders and a circle twice as large as the X-ray source radius. The right panel of Figure 4 shows the frequency of observing by chance a number density or higher. A large negative number means that the overdensity is unlikely to be a background fluctuation. The curve is not smooth because the galaxy number density can take only discrete values. This approach does take into account the angular correlation function of galaxies and is preferable than assuming a Poissonian distribution of the galaxy counts.
Following our analysis we have found:
-
•
Four potentially extended X-ray sources with scale of 20 arcsec (XLSSC 005a, h, l and XLSSC 005b) are spatially coincident with galaxy overdensity in which was seldom observed in the control field (649 independent lines of sight, the 18 SOFI images minus twice the area occupied by the targets). Their statistical significance is therefore larger than 0.999. Note, however, that the center of source l has been moved away from the x-ray center by about 40” (see sec 3.2).
-
•
Five extended sources with scale of 40 arcsec (XLSSC 003, XLSSC 029, c, f, XLSSC 032), are spatially coincident with galaxy overdensity in which was never observed in our control field (51 independent lines of sight). The statistically significance is larger than 0.98 but it is worth to note that we cannot quote a larger confidence level because of the limited area of the control field, not because of the “low signal” of the detection.
All listed statistical significances include contribution from clusters/groups unrelated to the X-ray emission (line of sight projections), i.e. the statistical analysis takes into account the possibility that the X-ray emission is, by chance on the same line of sight of the cluster but at different redshift (i.e. the X-ray photons does not come from the NIR identified cluster). The detected galaxy overdensity is not due to the cosmic variance of galaxy counts, because it is not shared by the whole SOFI field of view where the clusters are detected, as the left panel of Figure 4 shows (compare the triangles and the circles). The stated statistical significance holds for the assumed aperture. An optimal aperture will only increases the statistical significance of the NIR cluster detection.
Concluding, we have found galaxy overdensities with statistical significance larger than 0.98 in direction of all presented nine cluster candidates, with the caveat of the spatial offset of source l.

3.2 Cluster confirmation using colour–selection
Clusters of galaxies up to should be detectable in colour space using (e.g. Gladders & Yee 2000). We have developed a method to detect clusters inspired by, but different from Gladders & Yee (2000) and described in Andreon et al. (2003b, 2004a,b). Shortly, the method takes advantage from the observed fact that most of galaxies in clusters share similar colours, while background galaxies have a variety of colours, both because they are spread over a larger redshift range and because the field population is more variegate in colour than the cluster one, even at a fixed redshift. In practice, the method looks at spatially localized galaxy overdensities of similar colour.
Figure 5 shows the observed colour distribution (solid line) and the expected contribution unrelated to the cluster (dashed histogram) measured in a control field chosen as described in the figure legend. The cluster contribution is given by the area between the solid and dashed histograms, and its significance can be easely computed (this is the standard problem discussed several times in literature including, say, Loredo 1992). In Figure 5 we considered galaxies within a fixed distance from the x-ray measured center, and we arbitrary chose the amplitude of the colour bin. In the detection algorithm, the location and scale of the detection kernel in the spatial and colour space are optimized. The significances quoted in Table 2 comes from the optimization and are larger than one may derive from reading Figure 5 and straightforward application of statistics. These confidences are quoted with more decimals than for confidences determined from band data because of the large number of independent line of sights sampled with the huge control field available for data.
Table 2 shows that in for 6 out of 8 candidates having both NIR and data, the band and detection agree on the detection of a galaxy overdensity spatially coincident with the X-ray source. There is an apparent disagreement in just two cases:
-
•
source h, which brightest cluster galaxy is faint (see Fig. 3, Section 4.1 and Table 2) and the colour of the reddest galaxies in the cluster direction is very red (Figure 5). During the paper revision, deeper imaging has been taken at Gemini and the reason for the non detection clarified: the cluster is now colour detected at (estimated from the peak of the colour distribution) but using as colour (Figure 5, bottom–right panel). The non-detection in comes from the too large distance of the cluster, associated to the unfortunate location of the cluster near a bright star whose diffraction spike crosses the cluster centre in the old data (see Fig. 3).
-
•
Source l is a complex case. At the exact location of the presently determined x-ray center there is no overdensity of galaxies in -band or in colour space, reason why the source is undetected in both and colour. However, there is a galaxy overdensity in the -band about 40 arcsec west (about 300 kpc at ), detected as such in the -band (and reported in Fig 4), spectroscopically confirmed (four central galaxies have within 500 km/s, as well some other galaxies scattered over the field, see Fig 3), but undetected in , probably because the extreme poorness of the group and because its spatial distribution is more compact than the smallest scale used in the cluster detection (30 arcsec). While the existence of an x-ray source and of a cluster of galaxies is beyond doubt, the identification of the -band and spectroscopically confirmed cluster with the x-ray source is only possible, because the small, but not negligible, distance (300 kpc) between the optical and x-ray sources. Another possibility is that a weak emission centered on the optical cluster center, just below the detection threshold may be there, but we have detected only the portion of it contaminated by a nearby X-ray source.
Therefore, to confirm the high redshift clusters in our sample, the detection in is almost as efficient as the NIR one. performance is not expected to continue to be as good at , and redder/deeper data will be needed, as for source h.
| Short name | NIR det? | detected? | K(BCG) | Notes | |||
|---|---|---|---|---|---|---|---|
| XLSSC 003 | 0.98 c.l. | Out of f.o.v. | 0.84 | 16.9 | |||
| XLSSC 005a | 0.999 c.l | 0.999995 c.l. | 1.0 | 18.1 | blended with XLSSC 005b | ||
| XLSSC 029 | 0.98 c.l. | 0.999995 c.l. | 1.05 | 1.5 | 17.3 | ||
| c | 0.98 c.l. | 0.999995 c.l. | 1.3 | 16.6 | |||
| f | 0.98 c.l. | 0.999995 c.l. | 1.5 | 16.3 | uncertain BCG ID | ||
| XLSSC 032 | 0.98 c.l. | 0.999995 c.l. | 0.81 | 1.2 | 16.3 | ||
| h | 0.999 c.l. | NO | 17.5 | detected | |||
| l | 0.999 c.l. | NO | 0.92 | optical-X uncertain identification | |||
| XLSSC 005b | 0.999 c.l. | 0.999995 c.l. | 1.0 | 1.45 | 18.1 |
(1) Valtchanov et al. (2004), Willis et al. (2005 and private communication) and Sprimont et al. (private communication), to be published in the XMM-LSS cluster catalogue. Note: In col. 3, ”NO” means undetected at the 97 % confidence level.
4 Redshift determination
4.1 Spectroscopic redshift
Table 2 lists the spectroscopic redshift determined during fall 2002 (the time of the NIR campaign) or later. Three clusters turned out to be at . Two, instead, are “low” redshift (but !) and escaped our (eye-based) cluster identification procedure, similarly to the cluster possibly identified with the source l at 111The redshifts were measured and kindly provided by the VIRMOS consortium. Here “spectroscopically confirmed” means that at least 3 galaxies falling inside the x-ray emitting region have measured spectroscopic redshifts within 1000 km/s or less, following standard practice (e.g. Mullis et al. 2003; Böhringer et al. 2004), with the mentioned exception of the special source l.
XLSSC 005a and XLSSC 005b are two parts of a complex structure at . The structure has thickness of about km/s (Valtchanov et al. 2004), and hence the two objects are unlikely to be part of one single cluster and we count them as two separate entities. The superposition of the two structures both in the plane of the sky and in redshift, together to a limited sampling in redshift space (eleven measures inside the central arcmin), force us to give a coarse redshift for the two sources in Table 2.
4.2 Redshifts assuming BCGs as a standard candle
The Hubble diagram (i.e. redshift vs magnitude) for brightest cluster galaxies (BCGs) is a classical cosmological tool (e.g. Sandage 1995). The dispersion of the BCG magnitude in the -band at a fixed redshift is about 0.22 mag in homogeneously selected samples (Collins & Mann 1998; Brough, Collins, Burke, Mann, & Lynam, 2002), but easily become twice as large when an heterogeneous sample is taken (e.g. including BGCs listed in Stanford et al. 2002 or Aragon–Salamanca et al. 1993). For the assumed cosmology, a 0.22 mag dispersion correspond to in redshift. Mullis et al. (2003) quote a slightly better figure ( 90 % confidence, instead of 68 % confidence) for a large X-ray selected sample, but at .
Table 2 lists the SExtractor isophotal corrected K-band BCG luminosity for all our 9 targets, but the special source l. Six of the objects have a spectroscopic redshift and allow us to empirically calibrate the Hubble diagram using our own data. Out of the 3 candidate clusters without and spatially coincident with a galaxy overdensity in NIR, one have fainter than, or similar to, our clusters. Two, instead, are quite brighter suggesting , inferred from the comparison with our clusters with .
Photometric redshifts estimated from the luminosity of the BCG are prone to be underestimated, because of the possibility that the galaxy identified as the BCG is instead an interloper: in such a case the actual BCG would be fainter and the cluster more distant than claimed.
4.3 Redshift from colours
Assuming that the colour of the reddest galaxies in clusters evolve passively with , we can infer the (photometric) redshift of the cluster from the colour of the red sequence. The method has been used, and confirmed, for 5 X-ray selected clusters at (Puddu et al. 2001), in 140 cluster at (Andreon 2003), in 19 clusters at by Stanford et al. (1998), in 18 clusters by Andreon et al. (2004a).
Instead of relying on galaxy evolutionary models, we can afford a direct approach: since we known, by our own observations of XLSSC 005b and 029, the colour of the main population of a cluster at ( mag, see Table 2), we can derive the other photometric redshifts by comparison with the reference one.
There are only two clusters colour detected lacking a spectroscopic redshift: one (source f) has and one (source c) has . There is a good agreement between the photometric redshift () derived by colour and by the BCG luminosity for source c, but disagreement for source f, whose colour suggest , while its BCG suggest . For such a cluster it is possible that the galaxy identified as BCG is, instead, an interloper.
Source h, instead, is NIR detected but not colour detected in the old data. The non-detection of the source h in and the red colour of the reddest of its galaxies shown in Figure 5, both imply , in good agreement with the value estimated from the colour of the red sequence from new data ().
5 Summary and discussion
We have selected 19 X-ray potentially extended sources, without obvious counterpart in deep optical images, and hence are candidates for clusters. All 19 objects were observed with SOFI at NTT, while 14 of them were in the field surveyed in at CTIO.
NIR/ observations photometrically confirm night of them as genuine high redshift clusters: they are detected as NIR galaxy overdensity, their galaxies share similar enough colours that the cluster is detected by the (, in one case) colour detection algorithm, their brightest galaxy members have luminosity compatible with and the galaxies on the colour magnitude relation (the colour of detection) have the right colour to be early-type galaxies at . Spectroscopical observations already confirmed three of them as spectroscopic clusters, and three more as clusters. The three remaining clusters have and .
Our success in identifying high redshift clusters does not come unexpected. However, we show that expectations are satisfied with data. For all identified systems we give position, basic x-ray quantities (fluxes for example, can be computed from numbers quoted in Table 1), solid evidence about their photometric (high) redshift and, in six cases out nine, spectroscopic redshift. With the current work the number of high redshift clusters with x-ray emission has approximatively doubled.
Cluster (h has very low likelihood of extension, still it is a cluster, suggesting caution in using likelihood of extension at low x-ray counts.
About half of our 19 X-ray sources are not identified as clusters of galaxies (and not reported here individually). These sources should not be considered as a failure: they are unidentified sources at present. However, the identification may change with new data, which probe, for example, a different redshift range ( with UKIDSS/Spitzer data) or which increases the significance of the NIR/ detection, or which allow a full three dimensional sampling.
Overall, there are 5 clusters with solid evidence to be at (we neglect clusters at and the cluster at ) in the inspected 2.9 deg2. Three of them are spectroscopically confirmed to be at . The number density of observed clusters at , implied from this study, is about 1.7 deg-2 for clusters with ergs cm-2 s-1 keV (the flux of the faintest considered source). The 68 % confidence interval (Gehrels 1986, Andreon 2005), assuming a Poissonian probability distribution function, is . This estimate is a lower limit, because not all sources in the considered area have been scheduled for NIR observations. We leave the discussion of the volume density of clusters at and selection function to Bremer et al. (2005).
Colour detection and NIR overdensity achieve similar performance in confirming potentially extended X-ray sources deemed to be at . Therefore, we are currently considering a cross-correlation between colour detected and X-ray detected clusters, without the restriction to sources with NIR images (i.e. the targets of this study) to enlarge the cluster sample. The cross-correlation with X-ray is compelling if clusters with deep potential wells are to be selected and discriminated against structures of larger size (and similar mass) and from superposition of groups nearby in space, but not part of a single halo.
Acknowledgements
We acknowledge the VIRMOS consortium for the redshift of cluster l. The authors thank all the XMM-LSS consortium members for stimulating conversations, and Sergio dos Santos for its early help at the start of this project. Referee suggestions helped to improve the paper presentations, and we thank him. H. Quintana is thankful for partial support to the FONDAP Astrophysics Center. This paper is based on observations obtained with XMM, with ESO (prop. 70.A-0733), Cerro-Tololo (prog. 0295 and 0316) and, in part, Gemini (GN-2004B-Q-55) telescopes.
References
- Andreon (2001) Andreon, S. 2001, ApJ, 547, 623
- Andreon (2003) Andreon, S. 2003, A&A , 409, 37
- (3) Andreon, S. 2005, submitted
- (4) Andreon S. et al. 2004a, MNRAS, 353, 353
- (5) Andreon S. et al. 2004b, in the proceeding of ‘Rencontres de Moriond: Exploring the Universe. Contents and Structure of the Universe’ (astro-ph/0405574)
- Andreon, Pierre, & the XMM-LSS collaboration (2003) Andreon, S., Pierre, M., & the XMM-LSS collaboration, 2003, SAIt Memorie Supplement, 3, 188
- Bertin & Arnouts (1996) Bertin, E. & Arnouts, S. 1996, A&AS, 117, 393
- Böhringer et al. (2004) Böhringer, H., et al. 2004, A&A, 425, 367
- Borgani et al. (2001) Borgani S., Rosati P., Tozzi P., et al., 2001, ApJ, 561, 13
- Cagnoni et al. (2001) Cagnoni, I., Elvis, M., Kim, D.-W., Mazzotta, P., Huang, J.-S., & Celotti, A. 2001, ApJ, 560, 86
- Capozziello et al. (2004) Capozziello, S., Cardone, V. F., Funaro, M., & Andreon, S. 2004, Phys Rev D, 70, 123501
- Collins & Mann (1998) Collins, C. A. & Mann, R. G. 1998, MNRAS, 297, 128
- Evrard et al. (2002) Evrard, A. E. et al. 2002, ApJ, 573, 7
- Gehrels (1986) Gehrels, N. 1986, ApJ, 303, 336
- Gioia et al. (1990) Gioia, I. M., Maccacaro, T., Schild, R. E., Wolter, A., Stocke, J. T., Morris, S. L., & Henry, J. P. 1990, ApJS, 72, 567
- Gioia et al. (2003) Gioia, I. M., Henry, J. P., Mullis, C. R., Böhringer, H., Briel, U. G., Voges, W., & Huchra, J. P. 2003, ApJS, 149, 29
- Ghizzardi (2001) Ghizzardi, S., 2001, XMM-Newton calibration documentation, EPIC-MCT-TN-001
- Gladders & Yee (2000) Gladders, M. D. & Yee, H. K. C. 2000, AJ, 120, 2148
- Haiman et al. (2001) Haiman, Z., Mohr, J. & Holder, G., 2001, ApJ, 552, 545
- Henry et al. (1997) Henry, J. P., et al. 1997, AJ, 114, 1293
- Kodama et al. (1998) Kodama T., Arimoto N., Barger A. J., Arag’on-Salamanca A., 1998, A&A, 334, 99
- (22) Lin et al. 2004, astro-ph/0402308
- (23) Loredo T., 1992, in Statistical Challenges in Modern Astronomy, ed. E.D. Feigelson and G.J. Babu (New York: Springer-Verlag), pp. 275–297
- MacCracken et al. (2003) MacCracken, H.J., Radovich, M., Bertin, E., et al., 2003, A&A, 410, 17
- (25) Moorwood A., Cuby J.-G., Lidman C., 1998, The Messenger, 91, 9
- Mullis et al. (2003) Mullis, C. R., et al. 2003, ApJ, 594, 154
- Nichol et al. (1999) Nichol, R. C., et al. 1999, ApJL, 521, L21
- Persson et al. (1998) Persson S. E., Murphy D. C., Krzeminski W., Roth M., Rieke M. J. 1998, AJ 116, 2475
- Pierre et al. (2004) Pierre, M., Valtchanov, I., Altieri, B., et al., 2004, JCAP, 09, 011
- Puddu et al. (2001) Puddu, E., Andreon, S., Longo, G., Strazzullo, V., Paolillo, M., & Gal, R. R. 2001, A&A, 379, 4
- Refregier, Valtchanov, & Pierre (2002) Refregier, A., Valtchanov, I., & Pierre, M. 2002, A&A, 390, 1
- Rosati et al. (1999) Rosati, P., Stanford, S. A., Eisenhardt, P. R., Elston, R., Spinrad, H., Stern, D., & Dey, A. 1999, AJ, 118, 76
- Rosati et al. (2004) Rosati, P., et al. 2004, AJ, 127, 230
- Sandage et al. (1995) Sandage, A. R., Kron, R. G., Longair, M. S., 1995, Saas-Fee Advanced Course 23. Lecture Notes 1993. eds: Binggeli, B., & Buser, R. Springer-Verlag
- Stanford, Eisenhardt, & Dickinson (1998) Stanford, S. A., Eisenhardt, P. R., & Dickinson, M. 1998, ApJ, 492, 461
- Stanford et al. (2002) Stanford, S. A., Eisenhardt, P. R., Dickinson, M., Holden, B. P., & De Propris, R. 2002, ApJs, 142, 153
- Stanford et al. (2002) Stanford, S. A., Holden, B., Rosati, P., Eisenhardt, P. R., Stern, D., Squires, G., & Spinrad, H. 2002, AJ, 123, 619
- Valtchanov et al. (2004) Valtchanov, I., Pierre, M., Willis, J., et al., 2004, A&A, 423, 75
- Valtchanov, Pierre, & Gastaud (2001) Valtchanov, I., Pierre, M., & Gastaud, R. 2001, A&A , 370, 689
- Vikhlinin et al. (1998) Vikhlinin, A., McNamara, B. R., Forman, W., Jones, C., Quintana, H., & Hornstrup, A. 1998, ApJ, 502, 558
- (41) Willis J. et al., 2005, MNRAS, submitted