Probing the precession of the inner accretion disk in Cygnus X-1
Abstract
We show that changes in the orientation of the inner accretion disk of Cygnus X-1 affect the shape of the broad Fe K emission line emitted from this object, in such a way that eV-level spectral resolution observations (such as those that will be carried out by the ASTRO-E2 satellite) can be used to analyze the dynamics of the disk. We here present a potential diagnostic tool, supported by numerical simulations, by which a few observations of Cygnus X-1, separated in time, can determine whether its accretion disk actually precesses, and if so, determine its period and precession angle. This approach could also be used for similar studies in other microquasar systems.
Subject headings:
X-rays: binaries—X-rays: individual (Cygnus X-1)1. Introduction
Cygnus X-1 is a 5.6-day X-ray binary that harbors the best studied black-hole candidate in the Galaxy. The mass of the accreting compact object has been estimated as M⊙ and the donor star is classified as an O9.7 Iab supergiant of M⊙ (Herrero et al. 1995). The system is located at kpc (e.g. Gierliński et al. 1999). The black hole accretes through the wind of the companion star. Most of the time, the X-ray source is in the so-called low/hard state, characterized by a relatively weak blackbody component peaking at a few keV plus a strong hard power-law of photon index . A nonthermal radio jet has been observed in this state (Stirling et al. 2001), extending up to mas. The jet seems to form an average angle with the line of sight of (Fender 2001) and it has been suggested that it might be precessing (Stirling et al. 2001, Romero et al. 2002). Occasionally, a transition to a high/soft state can occur. In this state, most of the radiated energy is concentrated in the blackbody, while the power-law component becomes softer, with an index of and no jet has been observed.
The usual interpretation of the X-ray behavior of the source is that the blackbody component originates in a cold, optically thick accretion disk, whereas the power-law component is produced in an optically thin hot corona by thermal Comptonization of disk photons (Poutanen et al. 1997, Dove et al. 1997, Esin et al. 1997, 1998). The hot corona fills the inner few tens of gravitational radii around the compact object and the accretion disk would penetrate only marginally into the coronal region. In the low/hard state the thermal X-ray luminosity is dominated by the corona, with typical luminosities of a few times erg s-1. During the transition to the high/soft state the corona is likely ejected as the accretion disk approaches to the black hole (Fender et al. 2004, also Esin et al. 1997, 1998). Most of the energy is then dissipated by the disk, until the inner part of it dominates the radiation again, and the cycle starts again.
In the low/hard state, the disk is illuminated by hard photons from the corona resulting in the production of an Fe K line and a Compton reflection feature. The first detection of the line was made by Barr et al. (1985) with . They reported a broad (FWHM keV) emission line at keV with an equivalent width of eV. Kitamoto et al. (1990) obtained a GSPC spectrum which was consistent with a narrow emission line at keV with an equivalent width of eV. A Compton reflection feature was then found above 20 keV (see Tanaka 1991 and references therein). The spectrum in the keV range can be fitted quite well by the sum of a power-law with index , a reflection component and a narrow Fe emission line at keV with an equivalent width of eV (Tanaka 1991). Subsequent observations confirmed these results but restricting the width to eV (Ebisawa et al. 1996). A broad edge at keV was also reported. A detailed historical account of attempts to detect an Fe line in Cygnus X-1 and the intrinsic difficulties it entails, can be found in Reynolds & Nowak (2003). Recently, Chandra observed Cygnus X-1 with the High Energy Transmission Grating Spectrometer in an intermediate X-ray state (Miller et al. 2002). The narrow Fe line was detected at keV with an equivalent width of eV, along with a broad line at keV with eV. A smeared edge was also detected at keV. Miller et al. (2002) interpret these results in terms of an accretion disk with irradiation of the inner disk producing the broad Fe K emission line and edge, and irradiation of the outer disk producing the narrow line. The broad line is shaped by Doppler and gravitational effects and, to a lesser extent, by Compton reflection.
For different spectral states, the different disk structure may change the Fe K line. For example, if the disk is truncated at a much larger radius rather than the innermost stable orbit as suggested for the hard state, then the width of the Fe K line may significantly decrease. In any case, the variation due to disk precession, if that were observable, and that due to the accretion mode (disk structure), will have a different temporal signature (periodicity), what would make them easy to distinguish.
In this paper, we show that changes in the orientation of the inner accretion disk of Cygnus X-1 would affect the shape of the broad Fe K emission line in a periodic way. Under the assumption that the X-ray spectrum of Cyg X-1 is not substantially more complex than what has already been found in the Chandra observation, eV-level spectral resolution observations of the system (as those that will be carried out by the ASTRO-E2 satellite) can be used to constrain the dynamics of the disk and establish whether the accretion disk of Cygnus X-1 actually precesses, and if so, to determine its dynamics.
2. Disk precession in Cygnus X-1
Several X-ray binaries present periodic behavior in their light curves on timescales longer than the orbital period. Among these systems we can mention Her X-1, SS 433, and LMC X-4. It has been suggested that these long periods correspond to the precession of the accretion disk (e.g. Katz 1973). In the case of SS 433 the precession is directly measured in the jets, so if these are attached to the accretion disk it is reasonable to expect that the disk will also display precession (Katz 1980). Although there is no reported compelling evidence yet for disk precession in black hole binaries, it is reasonable that the same mechanisms responsible for this phenomenon in neutron binaries will apply.
The mechanism that produces the precession might be the instability of the response of the disc to the radiation reaction force from the illumination by the central source (e.g, Wijers & Pringle 1999, Ogilvie & Dubus 2001), or the tidal force of the companion star on a disk which is not coplanar with the binary orbit (Katz 1973, Larwood 1998, Kaufman Bernadó et al. 2002). Uniform disk precession will occur in this case only if the sound crossing time through the disk is considerably shorter than the characteristic precession period induced by the perturbing star. The precession angular velocity is given by (e.g. Romero et al. 2000): where is the gravitational constant, is the orbital radius, is the inner disk angular velocity, is the half-opening angle of the precession cone, and is the mass of the star that exerts the torque upon the disk. The orbital period is related with the involved masses and the size of the orbit by Kepler’s law: where is the mass of the accreting object. The ratio between the orbital and the precessing periods can be related through the disk angular velocity :
| (1) |
where and . Since , normally . In the case of Cygnus X-1, Brocksopp et al. (1999) have reported multiwavelength evidence for the existence of a period of days. Similar precessing periods have been calculated by Larwood (1998), Katz (1973, 1980) and Katz et al. (1982) for other X-ray binaries on the basis of the same model. As shown by Romero et al. (2002) in the case of Cygnus X-1, such a period can be obtained from tidally-induced precession for an accretion disk with a size cm, if the half opening angle of the precession cone is . For a purely wind-fed system, this size might be too large and other mechanism may be in operation to generate the observed timescales. In particular, radiation-driven precession (Pringle 1996, Maloney & Begelman 1997, Ogilvie & Dubus 2001), wind-driven warping and precession (Schandl & Meyer 1994, Quillen 2001), and spin-spin precession (Bardeen & Petterson 1975, Armitage & Natarajan 1999) can yield precession periods of several weeks to a few months. In all these mechanisms the observed optical and X-ray modulation points to precession of the disk, whereas the radio variations might originate in the jet.
3. Fe K- line profile diagnosis
The use of emission lines as a diagnosis tool for the state of binary systems has been proposed in the past (e.g., for an investigation on supermassive black hole binarity, see Torres et al. 2003, also Gaskell 2003; Zakharov et al. 2004a,b). Here we show that a similar method can be used to extract information about the precession status of microquasars.
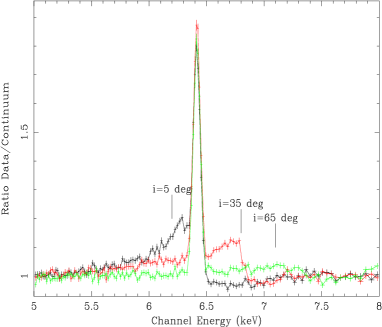
For the case of Cygnus X-1, we shall assume that the time-averaged disk inclination angle is 35∘, which is in agreement with the fitting of the system’s Fe line (Miller et al. 2002). Values around this time-averaged inclination angle were also found for other binary systems ( e.g., Her X-1, LMC X-4, SMC X-1, etc. e.g., as discussed by Larwood 1998). We also assume two extreme cases for the amplitude of the disk precession: (1) the disk inclination angle precesses from 31∘ to 39∘ (very low magnitude of the precession angle); (2) the disk inclination angle precesses from 5∘ to 65∘ (large magnitude of the precession angle). The amplitude of the precession of the inner disk should not be large if it is due to the tidal force of the secondary star and if the disk (especially the outer disk region) develops a significant warp. However, if the initial spin direction of the BH is significantly different from the orbital angular momentum direction, the inner disk, which is confined to the equatorial plane of the BH (if the spin is high) due to the Bardeen-Peterson effect, may precess around the total angular momentum (dominated by the orbital angular momentum) with an amplitude as large as the initial orbital inclination angle with respect to the BH equatorial plane. If we assume that the disk is rigidly precessing around the total angular momentum (dominated by the orbital angular momentum), then the amplitude of the precession may also be around 30∘.
Several calculations on the disk line profiles have been performed. We use a ray-tracing technique and elliptic integrals (Rauch & Blandford 1994; see also Yu & Lu 2000; Lu & Yu 2001 and references therein) to follow the trajectories of photons from the observer, keeping track of all coordinates until the photons either intersect the accretion disk plane, disappear below the event horizon, or escape to ”infinity” (operationally defined to be away from the BH). We then calculate the redshift factor for a photon (to the observer) emitted from a particular position on the disk. The solid angle subtended at the observer by each disk element is also calculated. We set the inner radius of the disk to be at the marginally stable orbit ( for a Schwarzschild black hole or for a Kerr black hole with spin , where ), and the outer radius at . We assume that the surface emissivity of line photons follows a power-law, , with . Both the power-law emissivity law and the size of the disk in Schwarszchild units, are usual assumptions (see, e.g., Nandra et al. 1997). The BH spin is assumed to be . In microquasar systems, both the high frequency quasi-periodic oscillation and relativistic lines suggest a high spin. In any case, we proved that if we were to assume a lower spin, there is not much qualitative difference for the problem we have studied here. With the above assumptions, we sum up all the photons received by the observer, which is emitted from each disk element, and obtain the profile of emergent Fe K lines, with different inclination angles from the Cygnus X-1 system, as shown in the Figure 1.
4. Observing the Fe line profile variations
The complex X-ray spectrum of Cygnus X-1 revealed by the Chandra observation reported in Miller et al (2002) implies that the detection of minute variations in the Fe line shape will require a high spectral resolution instrument with large throughput. In what follows, we discuss the feasibility of detecting the precession of the accretion disk with ASTRO-E2, and specifically with the X-ray Spectrometer (XRS) consisting of an array of semiconductor-based calorimeters delivering the best spectral resolution to date at 6 keV (pre-flight value of 6.5 eV). ASTRO-E2 is a JAXA/NASA mission to observe X-rays with unprecedented high spectral resolution imaging detectors, which is scheduled for launch by Summer 2005. The ASTRO-E2 Science Working Group target list includes two observations of Cygnus X-1.
The underlying assumption is that the X-ray spectrum of Cyg X-1 can be well described by the best-fit model obtained by Miller et al (2002). Indeed, at higher spectral resolution, other -so far undetected- spectral components might appear. Examples include the presence of blue-shifted edges due to high velocity ejecta. Should these, or other, features impact strongly either on the Fe line region itself or in the energy ranges where the underlying continuum is estimated, the specific methodology proposed here will need to be revised. Fortunately the instrument selected will deliver spectra with a very high signal to noise at a spectral resolution so high that many of these putative components might be resolved and modeled out. That would certainly complicate, but not invalidate, the proposed analysis.
As argued by Miller et al (2002) the spectrum of Cygnus X-1 is complex below 3 keV, where they did not succeed in fitting an appropriate model. All our discussion assumes the Be filter is on at the XRS. This removes low energy photons which are not needed for our purposes. In our analysis, we ignore photons below 3 keV and above 9 keV. In addition, we do not use the X-ray Imaging Spectrometers (XIS) on board ASTRO-E2, which have less spectral resolution at the Fe line energy range. A typical 50 ks exposure is assumed, and the background is assumed to be negligible for such an strong source (see below) and not included in the simulations. Pre-launch calibration redistribution matrices and efficiency curves have been downloaded from the ASTRO-E2 web site at NASA555http://astroe2.gsfc.nasa.gov/docs/astroe/prop_tools/xrs_mat.html, with the most recent updates included (as of August 4, 2004) .
The simulated model is that fitted by Miller et al. (2002) to the Chandra data. The continuum is a power law with , absorbed by a Galactic column of which is absorbed by a smeared edge at 7.2 keV, with a width of 7 keV and a depth of 1.2. The narrow line component at 6.415 keV, believed to arise from the irradiated outer disk, has been simulated as a gaussian of width eV. The broad line component has been simulated using the numerical models explained in the previous section, for a fixed equivalent width of 140 eV and a variety of disk inclination angles.
As expected, this model produces a very high count rate in the XRS, of the order of 60 counts s-1. This count rate will be distributed among several XRS pixels, according to the PSF. Although the overall count rate is below the telemetry limit, the fraction of events that will be measured by the on-board software as medium or low resolution will be large (). There are two possibilities to deal with this: either using the neutral density filter (which will decrease the overall count rate to an acceptable level of counts s-1 ) or to ignore the few pixels with the higher count rates and work only with the pixels which have count rates below a few counts s-1. Both of these procedures will result in an overall loss of throughput. This is why we consider effective exposures of 10 and 5 ks.
To analyze the simulated data, we follow Miller et al (2002) to fit the continuum, by excluding the range from 4.0 to 7.2 keV. A single power law leaves enormous residuals which can be well fitted by the smeared absorption edge. In general, the edge energy is well reproduced by the fit (statistical 90% errors in the range of 50–150 eV depending on the effective exposure time), although there is substantial degeneracy between the width of the edge and its depth. This does not affect the continuum in the Fe emission line region.
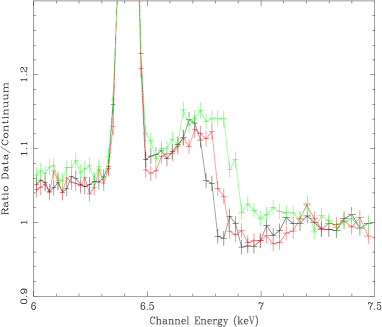
Once the continuum is fitted, we include all data in the 3.0-9.0 energy band, and add a narrow gaussian emission line and a relativistic emission line (see Figure 2, left). Thanks to the superb spectral resolution of this instrument, the narrow line is very well characterized, with errors in its centroid actually limited by systematics (2 eV) rather than by statistics, even in a 5 ks exposure. The relativistic line model returns the disk inclination angle with a 90% error of 0.3 deg for a 50 ks exposure and 0.7 deg for a 5 ks exposure. This is due to the fact that the sharp drop in the blue edge of the line is very clearly marked by the XRS. Figure 2 (right panel) shows the differences in these sharp edges for a 50 ks exposure and various disk inclination angles. Note that these changes amount to about 50 eV per degree of disk inclination, and therefore the claimed limit in the systematics for line centering of 2 eV is really not an issue for this purpose. Table 1 summarizes the results of the fits to simulated data with 5, 10 and 50 ks net exposure and disk inclination of .
5. Concluding remarks
This work suggests a diagnostic tool to investigate whether the accretion disk of Cygnus X-1 (and of other microquasar systems) precesses, and if so, what is the period and precession angle. We have shown that the study of the periodic variations of the Fe K line, that would be unavoidably produced in the putatively precessing disk of the system, are observable in short (5–10 ks) exposures of the ASTRO-E2 satellite. The degree of precision and confidence level up to which we will be able to determine the inclination angle of disk for each short observations, thus, the magnitude of the precession, was shown to be sufficiently high as to allow a clear determination of these parameters even when the precession angle is of only a few degrees.
References
- (1) Armitage, P.J. & Natrarajan, P. 1999, ApJ, 525, 909
- (2) Bardeen, J.M. & Petterson, J.A. 1975, ApJ, 195, L65
- (3) Barr, P., White, N. E., & Page, C. G. 1985, MNRAS, 216, 65p
- (4) Brocksopp, C., Fender, R. P., Larimov, V., et al. 1999, MNRAS, 309, 1063
- (5) Dove, J. B., Wilms, J., Maisack, M., & Begelman, M. G. 1997, ApJ, 487, 759
- (6) Ebisawa, K. et al. 1996, ApJ, 467, 419
- (7) Esin A. A., McClintock, J. E. & Narayan, R., 1997, ApJ, 489, 865,
- (8) Esin A. A., Narayan, R., Cui, W., Grove, J. E. & Zhang, S. 1998, ApJ, 505, 854
- (9) Fender, R. P. 2001, MNRAS, 322, 31
- (10) Gaskell, C. M. 2003, ”Quasars as Supermassive Binaries”, Proceedings of 24th Liege International Astrophysical Colloquium, p. 473.
- (11) Gierliński, M., Zdziarski, A. A., Poutanen, J., et al. 1999, MNRAS 309, 496
- (12) Herrero, A., Kudritzki, R. P., Gabler, R., et al. 1995, A&A 297, 556
- (13) Katz, J.I. 1973, Nature Phys. Sci., 246, 87
- (14) Katz, J. I. 1980, ApJ, 236, L127
- (15) Katz, J.I., Anderson, S.F., Margon, B., & Grandi, S.A. 1982, ApJ, 260, 780
- (16) Kaufman Bernadó, M. M., Romero, G. E., & Mirabel, I. F. 2002, A&A, 385, L10
- (17) Kitamoto, S., et al. 1990, PASJ, 36, 731
- (18) Lu, Y., & Yu, Q. 2001, ApJ, 561, 660
- (19) Larwood, J.D. 1998, MNRAS, 299, L32
- (20) Maloney, P.R. & Begelman, M.C. 1997, ApJ, 491, L43
- (21) Miller, J. M. et al. 2002, ApJ, 578, 348
- (22) Nandra, K., George, I. M., Mushotzky, R. F., Turner, T. J., & Yaqoob, T., 1997, ApJ, 477, 602
- (23) Ogilvie G. I. & Dubus G. 2001, MNRAS 320, 485
- (24) Poutanen, J., Krolik, J. H., & Ryde, F. 1997, MNRAS, 292, L21
- (25) Pringle, J.E. 1996, MNRAS, 281, 357
- (26) Quillen, A.C. 2001, ApJ, 563, 313
- (27) Rauch, K., & Blandford, R. D. 1994, ApJ, 421, 46
- (28) Reynolds, C.S. & Nowak, M.A., 2003, Phys. Rep., 377, 389
- (29) Romero, G. E., Chajet, L., Abraham, Z, Fan, J. H. 2000, A&A, 360, 57
- (30) Romero, G. E., Kaufman Bernadó, M. M., & Mirabel, I.F. 2002, A&A, 393, L61
- (31) Schandl, S. & Meyer, F. 1994, A&A 289, 149
- (32) Stirling, A. M., Spencer, R. E., de la Force, C. J., et al. 2001, MNRAS, 327, 1273
- (33) Tanaka, Y. 1991, Fe Line Diagnostics in X-Ray Sources, ed. A. Treves (Berlin, Springer), 98
- (34) Torres, D. F., Romero, G. E., Barcons, X. & Lu, Y. J. 2003, ApJ 596, L31
- (35) Wijers, R. A. M. J. & Pringle J. E. 1999, MNRAS 308, 207
- (36) Yu, Q., & Lu, Y., 2000, MNRAS, 311, 161
- (37) Zakharov, A. F., Ma, Z. & Bao, Y. 2004a, New Astronomy 9, 663
- (38) Zakharov, A. F., 2004b, astro-ph/0411611


| Parameter | input | 50 ks | 10 ks | 5 ks |
|---|---|---|---|---|
| (keV) | ||||
| (keV) | ||||
| (eV) | ||||
| Disk inclination |