Constraints on the Distance to SGR 1806–20 from H i Absorption
Abstract
The giant flare detected from the magnetar SGR 1806–20 on 2004 December 27 had a fluence more than 100 times higher than the only two other SGR flares ever recorded. Whereas the fluence is independent of distance, an estimate for the luminosity of the burst depends on the source’s distance, which has previously been argued to be kpc. The burst produced a bright radio afterglow, against which Cameron et al. (2005) have measured an H i absorption spectrum. This has been used to propose a revised distance to SGR 1806–20 of between 6.4 and 9.8 kpc. Here we analyze this absorption spectrum, and compare it both to H i emission data from the Southern Galactic Plane Survey and to archival 12CO survey data. We confirm 6 kpc, as a likely lower limit on the distance to SGR 1806–20, but argue that it is difficult to place an upper limit on the distance to SGR 1806–20 from the H i data currently available. The previous value of kpc thus remains the best estimate of the distance to the source.
1 Introduction
Magnetars are highly magnetized neutron stars, with inferred surface magnetic fields G (Duncan & Thompson, 1992; Woods & Thompson, 2005). Very rarely (perhaps once per century per magnetar), a magnetar emits a giant flare of high energy radiation, with luminosity ergs.
On 2004 December 27, a brief but enormously bright burst of X-rays and -rays was detected from the magnetar SGR 1806–20 (e.g., Borkowski et al., 2004; Palmer et al., 2005; Hurley et al., 2005). Spectrally and temporally, this giant flare was very similar to the only two giant flares seen previously (from SGR 0526–66 in 1979, and from SGR 1900+14 in 1998). However, the flare from SGR 1806–20 was much brighter than these two prior events, with a fluence higher than from any extra-solar event in recorded history. It was so intense that it saturated all but a few of the instruments which detected it, and even produced an observable echo off the moon (Mazets et al., 2005).
While the flux seen at Earth from this event was impressive, what is more relevant for our overall understanding is the total luminosity inferred for the flare, which depends in turn on the distance adopted for the source. Specifically, at a nominal distance to SGR 1806–20 of 15 kpc, the isotropic luminosity of the flare was ergs (Palmer et al., 2005; Hurley et al., 2005). This is a significant fraction of the total magnetic energy of the neutron star, and suggests that we witnessed a catastrophic reconnection event that may have reconfigured the magnetic field of the entire star, and which perhaps only occurs a few times in a magnetar’s entire lifetime. Such a flare could have been detected by existing instruments out to 30–40 Mpc (Palmer et al., 2005; Hurley et al., 2005). This raises the possibility that a small but significant fraction of the enigmatic population of short gamma-ray bursts (GRBs) may be flares from extragalactic magnetars (Nakar et al., 2005; Hurley et al., 2005; Palmer et al., 2005). On the other hand, if the magnetar is at a smaller distance from us, then the inferred energetics are substantially reduced, and flaring magnetars are unlikely to be detectable in distant galaxies.
There have been several previous attempts to estimate the distance to SGR 1806–20. Corbel et al. (1997) directly estimated the distance to this source via 12CO and X-ray observations. They determined the distribution of molecular clouds and their visual extinction along this line of sight, and compared this to the foreground hydrogen absorbing column inferred from the X-ray spectrum of SGR 1806–20. By requiring the hydrogen column inferred from visual extinction to match that seen in X-ray absorption, Corbel et al. (1997) concluded that the distance to SGR 1806–20 is kpc.
Alternative distance estimates come more indirectly, by considering the distance to the luminous blue variable (LBV) 1806–20 (just to the east of SGR 1806–20; Hurley et al., 1999; Kaplan et al., 2002) and its associated cluster of very massive stars. Detailed investigations of the distance to LBV 1806–20 have been undertaken by Corbel & Eikenberry (2004) and Figer et al. (2004), who inferred distances to this star of kpc and kpc, respectively. If magnetars are associated with massive star formation (e.g., Vrba et al., 2000; Klose et al., 2004; Gaensler et al., 2005a), then these distance estimates can also potentially be extended to SGR 1806–20.
A new distance estimate has been made in the aftermath of the giant flare from SGR 1806–20. The flare produced a rapidly fading radio afterglow (Cameron & Kulkarni, 2005; Gaensler et al., 2005b), which for the first few days after detection was sufficiently bright to be studied through H i absorption. Such a measurement was made by Cameron et al. (2005), who used the resulting absorption spectrum to argue for a hard lower limit on the distance to SGR 1806–20 of 6.4 kpc, and to propose an upper limit of 9.8 kpc. The implied range is substantially smaller than all previous estimates to this source, with immediate implications for the energetics of the flare, for associations of magnetars with massive stars, and for the nature of short GRBs.
Here we consider the distance to SGR 1806–20, using the absorption data presented by Cameron et al. (2005), 12CO data from the surveys of Sanders et al. (1986) and Dame et al. (2001), and additional information on H i emission in the field from the Southern Galactic Plane Survey (SGPS; McClure-Griffiths et al., 2005).
2 Results and Discussion
H i absorption is a powerful tool for providing distance constraints to Galactic objects (e.g. Gathier et al., 1986; Kuchar & Bania, 1990; Kolpak et al., 2003). Because H i is broadly distributed throughout the Galactic plane, the presence of H i absorption features (or lack thereof) can constrain the position of an object behind or in front of specific H i features. However, interpretation of H i spectra is challenging, owing to its occasionally patchy distribution (Garwood & Dickey, 1989). Furthermore, the application of global circular rotation curves for estimating distances can be misleading, due to widespread non-circular gas motions.
In considering H i absorption toward SGR 1806–20, Cameron et al. (2005) compared the H i absorption spectrum toward SGR 1806–20 with H i and 12CO emission spectra along the line of sight, to derive kinematic distance limits to the magnetar. Figure 2 of Cameron et al. (2005) presents these absorption and emission spectra, as well as the H i absorption spectrum toward the nearby extragalactic source NVSS J181106–205503 (hereafter J1811–2055).
In general, one uses the absorption feature with the most extreme velocity (positive or negative) to define a lower limit on the distance (e.g. Kuchar & Bania, 1990). For Galactic longitudes , and assuming circular rotation, gas at negative velocities is more distant from us than gas at positive velocities. However, SGR 1806–20 is at a Galactic longitude of where non-circular motions from the so-called “3 kpc” spiral arm produce unusual velocity structures. This can put relatively nearby emission at negative velocities. The spectrum of SGR 1806–20 obtained by Cameron et al. (2005) is a clear case for which there is significant H i absorption at a radial velocity . As pointed out by Cameron et al. (2005), these features can be attributed to non-circular motions.
The next most extreme velocity feature toward SGR 1806–20 is a strong absorption line at . This agrees well with both the H i and CO emission at the same velocity. At there may be another weak absorption feature, which Cameron et al. (2005) state has a significance of . While we prefer to use the feature at to provide a definitive lower limit on the distance, we note that the choice between these two features makes little difference to the inferred distance, both yielding a lower limit kpc (see §3 below).
A commonly used technique to place an upper limit on H i determined distances is to compare an absorption spectrum toward the target source with absorption seen toward nearby extragalactic sources. If there is absorption toward an extragalactic source that is from more distant gas than the last absorption feature observed in the target source, that can suggest an upper limit for the target source. The H i absorption spectrum presented for J1811–2055 by Cameron et al. (2005) exhibits strong absorption near which is not present in the spectrum toward SGR 1806–20. Cameron et al. (2005) argue that the absorbing gas seen at is widespread. The absence of strong absorption at toward SGR 1806–20 then provides an upper limit on the distance of the magnetar.
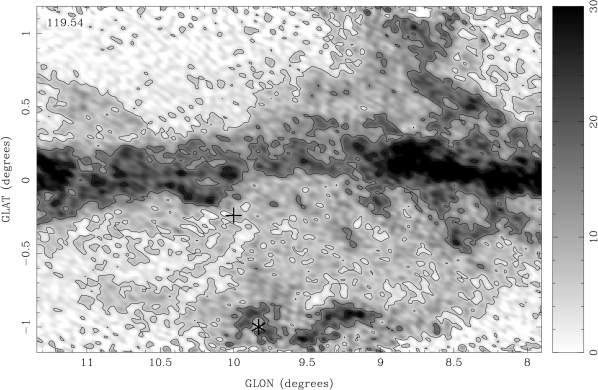
However, J1811–2055 is nearly one degree away from SGR 1806–20. The H i distribution can change significantly on scales much smaller than one degree, and indeed this seems to be the case here. We demonstrate this in Figure 1, where we show an SGPS image of the H i brightness temperature distribution in the vicinity of SGR 1806–20 and J1811–2055 at (McClure-Griffiths et al., 2005). The positions of SGR 1806–20 and J1811–2055 are marked with a cross and a star, respectively. Clearly the H i is not distributed smoothly at this velocity. Of particular importance, the image shows that there is a strong H i feature coincident with J1811–2055 (peak brightness temperature K) which is presumably also the source of the H i absorption. However, this feature does not extend to the position of SGR 1806–20, at whose position we find K.111Conversely, the SGPS H i distribution at shows H i emission coincident with SGR 1806–20 that is not present at the position of J1811–2055, explaining the lack of any absorption at toward J1811–2055.
Additional evidence for this point comes from 12CO emission, which is a reasonably good tracer of the cold gas that produces H i absorption. Garwood & Dickey (1989) found that in the inner Galaxy, 85% of H i absorption features with optical depths have counterparts in 12CO at the same position and velocity. A good example of this agreement is seen in Figure 2 of Cameron et al. (2005), where every H i absorption feature toward SGR 1806–20 is accompanied by a 12CO emission feature. However, the distribution of 12CO emission at in this region is patchy, just as is seen in H i. Specifically, the latitude-velocity images of 12CO emission in the surveys of Sanders et al. (1986) and of Dame et al. (2001) both clearly show that at there is 12CO emission toward J1811–2055, but that there is no CO emission at this velocity aligned with SGR 1806–20. Given the good agreement between H i absorption and CO emission along these lines of sight at other velocities, it is difficult to state convincingly that there is cold, absorbing H i at in the direction of SGR 1806–20.
3 Conclusion
The absorption feature at seen in the H i spectrum of SGR 1806–20 can be used to place a lower limit on the distance. Using the Brand & Blitz (1993) rotation curve, with the IAU standard values and kpc, and assuming an error in the velocity measurement of to account for random cloud-to-cloud motions in the ISM (e.g., Belfort & Crovisier, 1984), we estimate that SGR 1806–20 must be at a distance of at least kpc.222It should be noted that errors in the assumed rotation curve are likely to significantly exceed the errors quoted here. The assumption of circular rotation breaks down near spiral arms where streaming motions can account for non-circular motions on the order of (Shane & Bieger-Smith, 1966). These non-circular motions are particularly influential in the inner degrees of the Galaxy, reflecting the effects of the 3 kpc arm and the central bar. We point this out as a cautionary note that the minimum kinematic distance could have errors as large 5–7%. However, because H i and 12CO are both clearly unevenly distributed at , we do not believe that an upper limit to the distance of SGR 1806–20 can be inferred from the lack of H i absorption at this velocity. We conclude that the distance of SGR 1806–20 as determined from the H i measurements of Cameron et al. (2005) is fully consistent with the earlier distance estimates of kpc discussed in §1. As considered in detail by Hurley et al. (2005) and by Palmer et al. (2005), the inferred energetics of the giant flare from SGR 1806–20 thus remain remarkable.
References
- Belfort & Crovisier (1984) Belfort, P., & Crovisier, J. 1984, A&A, 136, 368
- Borkowski et al. (2004) Borkowski, J., Gotz, D., Mereghetti, S., Mowlavi, N., Shaw, S., & Turler, M. 2004, GCN 2920
- Brand & Blitz (1993) Brand, J. & Blitz, L. 1993, A&A, 275, 67
- Cameron et al. (2005) Cameron, P. B. et al. 2005, Nature, 434, 1112
- Cameron & Kulkarni (2005) Cameron, P. B. & Kulkarni, S. R. 2005, GCN 2928
- Corbel & Eikenberry (2004) Corbel, S. & Eikenberry, S. S. 2004, A&A, 419, 191
- Corbel et al. (1997) Corbel, S., Wallyn, P., Dame, T. M., Durouchoux, P., Mahoney, W. A., Vilhu, O., & Grindlay, J. E. 1997, ApJ, 478, 624
- Crovisier et al. (1980) Crovisier, J., Kazes, I., & Aubry, D. 1980, A&AS, 41, 229
- Dame et al. (2001) Dame, T. M., Hartmann, D., & Thaddeus, P. 2001, ApJ, 547, 792
- Dickey & Lockman (1990) Dickey, J. M. & Lockman, F. J. 1990, ARA&A, 28, 215
- Dickey et al. (1978) Dickey, J. M., Terzian, Y., & Salpeter, E. E. 1978, ApJS, 36, 77
- Duncan & Thompson (1992) Duncan, R. C. & Thompson, C. 1992, ApJ, 392, L9
- Figer et al. (2004) Figer, D. F., Najarro, F., & Kudritzki, R. P. 2004, ApJ, 610, L109
- Gaensler et al. (2005a) Gaensler, B. M., McClure-Griffiths, N. M., Oey, M. S., Haverkorn, M., Dickey, J. M., & Green, A. J. 2005a, ApJ, 620, L95
- Gaensler et al. (2005b) Gaensler, B. M., et al. 2005b, Nature, 434, 1104
- Garwood & Dickey (1989) Garwood, R. W., & Dickey, J. M. 1989, ApJ, 338, 841
- Gathier et al. (1986) Gathier, R., Pottasch, S. R., & Goss, W. M. 1986, A&A, 157, 191
- Hurley et al. (1999) Hurley, K., Kouveliotou, C., Cline, T., Mazets, E., Golenetskii, S., Frederiks, D. D., & van Paradijs, J. 1999, ApJ, 523, L37
- Hurley et al. (2005) Hurley, K. et al. 2005, Nature, 434, 1098
- Kaplan et al. (2002) Kaplan, D. L., Fox, D. W., Kulkarni, S. R., Gotthelf, E. V., Vasisht, G., & Frail, D. A. 2002, ApJ, 564, 935
- Klose et al. (2004) Klose, S., Henden, A. A., Geppert, U., Greiner, J., Guetter, H. H., Hartmann, D. H., Kouveliotou, C., Luginbuhl, C. B., Stecklum, B., & Vrba, F. J. 2004, ApJ, 609, L13
- Kolpak et al. (2003) Kolpak, M. A., Jackson, J. M., Bania, T. M., Clemens, D. P., & Dickey, J. M. 2003, ApJ, 582, 756
- Kuchar & Bania (1990) Kuchar, T. A., & Bania, T. M. 1990, ApJ, 352, 192
- Mazets et al. (2005) Mazets, E. P., Cline, T. L., Aptekar, R. L., Frederiks, D. D., Golenetskii, S. V., Il’inskii, V. N., & Pal’shin, V. D. 2005, astro-ph/0502541
- McClure-Griffiths et al. (2005) McClure-Griffiths, N. M., Dickey, J. M., Gaensler, B. M., Green, A. J., Haverkorn, M., & Strasser, S. 2005, ApJS, 158, 178
- Nakar et al. (2005) Nakar, E., Gal-Yam, A., Piran, T., & Fox, D. B. 2005, ApJ, submitted (astro-ph/0502148)
- Palmer et al. (2005) Palmer, D. M. et al. 2005, Nature, 434, 1107
- Sanders et al. (1986) Sanders, D. B., Clemens, D. P., Scoville, N. Z., & Solomon, P. M. 1986, ApJS, 60, 1
- Shane & Bieger-Smith (1966) Shane, W. W. & Bieger-Smith, G. P. 1966, Bull. Astron. Inst. Netherlands, 18, 263
- Vrba et al. (2000) Vrba, F. J., Henden, A. A., Luginbuhl, C. B., Guetter, H. H., Hartmann, D. H., & Klose, S. 2000, ApJ, 533, L17
- Woods & Thompson (2005) Woods, P. M. & Thompson, C. 2005, in Compact Stellar X-ray Sources, ed. W. H. G. Lewin & M. van der Klis (Cambridge: Cambridge University Press), in press (astro-ph/0406133)