Optical spectroscopy of X-Mega targets in the Carina Nebula - V. The spectroscopic binary HD 93161A and its visual companion HD 93161B ††thanks: Based on observations collected at the European Southern Observatory (La Silla, Chile), at the Cerro Tololo Inter-American Observatory (CTIO), and with XMM-Newton, an ESA Science Mission with instruments and contributions directly funded by ESA Member States and the USA (NASA).
Abstract
We present the analysis of an extensive set of high-resolution spectroscopic observations of HD 93161, a visual binary with a separation of 2″.
HD 93161A is a spectroscopic binary, with both components clearly detected throughout the orbit. The primary star is most probably of spectral type O8V, while the secondary is likely an O9V. We obtain the first orbital solution for this system, characterized by a period of 8.5660.004 days. The minimum masses of the primary and secondary stars are 22.20.6 M⊙ and 17.00.4 M⊙ respectively. These values are quite large, suggesting a high inclination of the orbit.
The second object, HD 93161B, displays an O6.5V((f)) spectral type and is thus slightly hotter than its neighbour. This star is at first sight single but presents radial velocity variations.
We finally study HD 93161 in the X-ray domain. No significant variability is detected. The X-ray spectrum is well described by a 2T model with k keV and k keV. The X-ray luminosity is rather moderate, without any large emission excess imputable to a wind interaction.
keywords:
stars: individual: HD 93161 (A,B) – stars: binaries: spectroscopic – stars: early-type – stars: fundamental parameters – X-rays: stars – X-rays: individual: HD 931611 Introduction
A few years ago began an extensive campaign to study the Carina Nebula, one of the largest concentrations of young and massive stars known in our Galaxy. This campaign was initiated by the X-Mega group (Corcoran et al., 1999) in order to gain a good knowledge of the cluster’s binary population prior to its observation in the X-ray domain by the ROSAT satellite. Such multiwavelength observations of spectroscopic binaries in open stellar clusters enable to constrain the fundamental parameters of the early-type stars and to investigate the interactions between their components in more depth.
The efforts were focused more specifically on the massive stars of the Trumpler 16 (Tr 16) open cluster (Albacete Colombo et al., 2001; Morrell et al., 2001; Rauw et al., 2001; Albacete Colombo et al., 2002, hereafter Papers I-IV). This cluster constitutes one of the best places to complete our objective, since it harbours a large number of binaries: Levato et al. (1991) found at least 5 spectroscopic binaries and several radial velocity variables in Tr 16. The (very) preliminary results of Levato et al. (1991), relying on poor quality and scarce data, were subsequently revised in the first papers of this series.
| Instrument | HJD2 450 000 | RV1 | RV2 | ||||
| (days) | (km s-1) | (km s-1) | |||||
| HD 93161A | |||||||
| B&C | 534.752 | 0.085 | 90.0 | 105.4 | |||
| 535.758a | |||||||
| 536.748 | 0.318 | 111.8 | 167.0 | ||||
| 537.741 | 0.434 | 81.8 | 83.9 | ||||
| 538.733 | 0.550 | 20.1 | 20.1 | ||||
| 539.661 | 0.658 | 151.0 | 100.9 | ||||
| BME | 1328.625 | 0.760 | 178.5 | 194.6 | 0.761 | 156.9 | 173.5 |
| 1329.556 | 0.869 | 112.2 | 127.7 | 0.870 | 117.3 | 125.8 | |
| 1330.590 | 0.990 | 6.7 | 6.7 | 0.991 | 5.5 | 4.4 | |
| 1331.674 | 0.116 | 81.1 | 141.9 | 0.117 | 91.3 | 130.2 | |
| 1332.560 | 0.220 | 149.6 | 195.4 | 0.221 | 153.3 | 192.6 | |
| FEROS | 1299.554 | 0.367 | 102.8 | 144.2 | 0.368 | 111.1 | 150.4 |
| 1300.563 | 0.484 | 4.0 | 4.0 | 0.485 | 5.9 | 5.0 | |
| 1301.670 | 0.614 | 100.9 | 131.6 | 0.615 | 102.1 | 130.8 | |
| 1302.662 | 0.729 | 157.6 | 204.6 | 0.731 | 150.3 | 198.2 | |
| 1304.560 | 0.951 | 54.7 | 66.6 | 0.952 | 44.7 | 62.5 | |
| 1327.531 | 0.633 | 98.9 | 155.1 | 0.634 | 102.6 | 151.9 | |
| 1669.577 | 0.562 | 55.6 | 81.9 | 0.563 | 58.4 | 79.8 | |
| 1670.539 | 0.675 | 139.7 | 184.2 | 0.675 | 143.3 | 184.2 | |
| 1671.535 | 0.791 | 151.8 | 195.7 | 0.791 | 149.2 | 192.4 | |
| 1672.527 | 0.907 | 92.7 | 121.0 | 0.907 | 95.7 | 109.7 | |
| 1673.526 | 0.023 | 3.6 | 3.6 | 0.024 | 2.0 | 1.1 | |
| 2037.627 | 0.528 | 70.7 | 19.8 | 0.528 | 7.9 | 18.6 | |
| 2038.556 | 0.636 | 126.1 | 107.5 | 0.636 | 120.5 | 112.4 | |
| 2039.628 | 0.761 | 159.8 | 211.4 | 0.761 | 156.5 | 205.7 | |
| 2040.636 | 0.879 | 79.0 | 133.4 | 0.879 | 93.0 | 133.5 | |
| 2335.615 | 0.314 | 112.6 | 192.8 | 0.314 | 118.4 | 191.0 | |
| 2336.617 | 0.431 | 24.7 | 102.4 | 0.431 | 52.7 | 72.6 | |
| 2337.606 | 0.547 | 70.3 | 80.9 | 0.546 | 64.7 | 49.5 | |
| 2338.604 | 0.663 | 111.7 | 173.4 | 0.663 | 114.5 | 167.5 | |
| 2381.573 | 0.679 | 138.5 | 185.4 | 0.679 | 139.4 | 182.4 | |
| 2382.552 | 0.794 | 156.8 | 195.8 | 0.793 | 154.3 | 190.8 | |
| 2383.556 | 0.911 | 75.7 | 105.2 | 0.910 | 79.1 | 103.4 | |
| 2782.527 | 0.486 | 2.2 | 2.2 | 0.485 | 2.4 | 0.9 | |
| 2783.516 | 0.601 | 84.2 | 121.5 | 0.600 | 87.9 | 121.0 | |
| 2784.511 | 0.717 | 157.4 | 205.3 | 0.716 | 154.4 | 200.8 | |
| 3130.515 | 0.109 | 101.2 | 118.2 | 0.108 | 100.7 | 122.4 | |
| 3131.495 | 0.224 | 161.2 | 192.8 | 0.222 | 160.8 | 193.3 | |
| 3132.494 | 0.340 | 141.9 | 170.4 | 0.339 | 141.9 | 170.8 | |
| 3133.575 | 0.466 | 39.9 | 55.3 | 0.465 | 39.7 | 50.0 | |
| 3134.513 | 0.576 | 65.4 | 97.7 | 0.574 | 68.1 | 94.4 | |
| 3135.544 | 0.696 | 146.9 | 195.2 | 0.695 | 147.1 | 193.1 | |
| HD 93161B | |||||||
| BME | 1330.640 | 4.5 | |||||
| FEROS | 2382.563 | 57.8 | |||||
| 3132.506 | 14.0 | ||||||
a. No measurement is available for He i 4471, but the He ii 4686 line shows RVs of 109.2 and 161.2 km s-1 for the primary and secondary, respectively.
In the present paper, we analyse an extensive set of spectra of one of the still poorly studied systems of Tr 16, HD 93161 (= Tr 16-176, CPD2631)111The membership of this system to Tr 14, Tr 16 or Collinder 232 has been subject to controversy throughout the literature. Here we follow Walborn (1973) in considering that it belongs to Tr 16.. The compound formed by HD 93161 and HD 93160 actually harbours five stellar components, noted A–E, some of which were found by speckle observations (Mason et al., 1998): HD 93160 corresponds to the C component, located at 13″ from the AB pair; component D is at 3″ from HD 93160 and component E is at 8″ of the AB pair. The latter two stars, separated by only 2″, have been known for a long time (see e.g. Walborn, 1973) and are generally referred to as HD 93161. Penny (1996) and Howarth et al. (1997) reported radial velocity (RV) variations in the UV spectrum of HD 93161. Unfortunately, the small separation between A and B, together with the low resolution of IUE, have not permitted to attribute these changes confidently to one member of the pair. Howarth et al. (1997) even suggested that both stars could be short-period binaries. Previously, Levato et al. (1991) had provided an SB1 orbital solution for HD 93161, without specifying to which component this solution applied. A thorough study of the system was thus eagerly awaited.
This paper is organized as follows: the observations and the data reduction are presented in Sect. 2 and the spectral features of HD 93161 A and B are discussed in Sections 3 and 4. In Sect. 5, we derive the first full orbital solution for HD 93161A, whereas Sect. 6 deals with the analysis of its X-ray emission. As a next step, we examine the evolutionary status of the stars and we finally conclude in Sect. 8.
2 Observations and data reduction
2.1 Optical spectroscopy
HD 93161 lies in a crowded region of the Carina Nebula, with HD 93160 just 13″ west of the star. As noted in the introduction, HD 93161 itself was found to be a visual double system, composed of two stars with similar brightnesses separated by only 2″. As in Vreux & Andrillat (1974), we define component A as being the one closest to HD 93160.
With such a small separation between A and B, it is difficult to study these stars individually. During some observing nights, a poor seeing and/or the low angular resolution of the pointing camera did not enable us to clearly disentangle the close pair AB. Among our 45 spectra, only 3 can securely be attributed to the sole B component. The main contributor to the remaining 42 spectra is intended to be the A component but these observations are usually contaminated, to a variable degree, by the B companion. This is marked in the spectra by the presence of a third, weak component.
We have observed HD 93161 over a period of 7 years with various instruments.
A first set of 6 medium resolution spectra covering the wavelength range Å was gathered in 1997 with the ESO 1.5 m telescope equipped with a Boller & Chivens (hereafter B&C) Cassegrain spectrograph. The data were obtained with a holographic grating (2400 lines/mm, ESO grating #32) providing a reciprocal dispersion of 32.6 Å/mm. The detector was a thinned, UV flooded Loral-Lesser CCD (ESO #39). The slit width was set to 220 m corresponding to 2″ on the sky. The spectral resolution as measured on the helium-argon calibration spectra is 1.2 Å, corresponding to a resolving power of 3600. Typical exposure times were of the order of 10 minutes and the average signal-to-noise ratio was about 250. Part of the B&C spectra were affected by a fringing pattern (Turatto et al., 1997) that occurred over the wavelength range Å in this instrument configuration. Given the variability of the fringing pattern and in order to avoid amplification of the fringes in the stellar spectra, the data were not flat-fielded. All the reductions were performed using the midas software developed at ESO. Note that only B&C spectra were sky subtracted.
Six high resolution spectra of HD 93161 were taken in May-June 1999 with the Bench-Mounted Echelle spectrograph (BME) fed by the 1.5 m Ritchey-Chrétien telescope at CTIO. These data covered the spectral range Å. The typical S/N ratio was 60 at 5430 Å for exposure times of one hour. The detector used was a Tek CCD with 2048 2048 pixels of m m and the resolving power was 45 000.
The BME data were reduced using the IRAF222IRAF is distributed by the National Optical Astronomy Observatories. package, following the recommendations of the BME User’s Manual. A first rectification of the extracted orders was carried out with the projector flat exposures. The spectra were then normalized by fitting a low-order polynomial to the continuum.
Between 1999 and 2004, we obtained 33 additional high resolution spectra at the La Silla Observatory with the Fiber-fed Extended Range Optical Spectrograph (FEROS, Kaufer et al., 1999). This spectrograph was installed until October 2002 at the ESO 1.5 m telescope, and was subsequently moved to the 2.2 m telescope. The FEROS spectra cover the wavelength range Å with a resolving power of 48 000. The detector was a 2k 4k EEV CCD with pixel size m m. The typical exposure time was 10–15 minutes and the S/N ratio at 5650 Å is about 125–225.
The FEROS spectra were reduced using the appropriate context of the midas environment, together with an improved reduction pipeline (Sana et al., 2003). They were normalized by fitting the continuum with a polynomial of degree ranging from 2 to 6. Most of the unavoidable fringes affecting the red part of the spectra were corrected by flat-fielding, but there are a few residuals, e.g. near 6640 Å.
2.2 X-ray data
The core of the Carina Nebula was observed several times by the XMM-Newton observatory (Jansen et al., 2001). We will focus here on the five datasets acquired in 2000 and 2001. The first two datasets, centered on Carinae, were obtained in July 2000 during satellite revolutions #115 and #116. The three other observations, centered on WR 25, were taken one year later during Revs. #283, #284, and #285. A preliminary study using only the first two observations was presented by Albacete Colombo et al. (2003). A thorough analysis of the field relying on the entire observational dataset has been performed by Antokhin et al. (2005).
HD 93161 was observed serendipitously during all five XMM-Newton pointings (see Table 2). The source was recorded with the three european photon imaging camera (epic) detectors (PN, MOS1 and MOS2; for more details, see Strüder et al., 2001; Turner et al., 2001). The data were processed with the XMM-Newton science analysis software (sas, version 5.4.1). A check on proton flares resulted in the deletion of part of the exposure time. More details on the pipeline processing of these data can be found in Raassen et al. (2003)333In Raassen et al. (2003), note that Column 4 of Table 5 actually gives the Julian dates in the format JD2 450 000, not the MJDs..
| Rev. | JD2 450 000 | Exp. Time (ks) | |||
|---|---|---|---|---|---|
| (days) | MOS1 | MOS2 | PN | ||
| 115 | 1751.92 | 0.18 | 33.8 | 30.6 | 31.7 |
| 116 | 1753.56 | 0.37 | 11.2 | 8.3 | 9.4 |
| 283 | 2086.00 | 0.17 | 36.7 | 36.7 | 34.6 |
| 284 | 2089.05 | 0.53 | 42.1 | 42.1 | 39.6 |
| 285 | 2090.91 | 0.75 | 37.4 | 37.4 | 34.9 |
3 The spectrum of HD 93161A
Up to now, the visible spectrum of HD 93161 was essentially studied through photographic observations. Following Walborn (1973), both stars of HD 93161 have identical spectra and apparent magnitudes. Walborn further attributes an O6.5V((f)) type to each star. The following year, however, Vreux & Andrillat (1974) discovered that HD 93161A was cooler than HD 93161B. Unfortunately, no formal spectral type was assigned to HD 93161A by Vreux & Andrillat (1974).

We have investigated the spectrum of HD 93161A through high resolution echelle spectroscopy. Such a spectrum is shown in Fig. 1: the lines are clearly double, showing that this star is indeed a spectroscopic binary. Beside the lines of the Balmer series, the spectrum reveals many absorption lines of He i, He ii, N iii, Si iii, Si iv, C iv and O iii that are typical of O stars. It also reveals a number of diffuse interstellar bands (DIBs), as well as interstellar absorptions due to He i 3889, Na i, Ca ii, CH and CH+. There are only few emission lines in the spectrum of HD 93161A. Most of them are sharp nebular lines, associated with the Carina Nebula. We may note that the most massive component exhibits C iii 5696 in emission444The fact that only this star exhibits the C iii 5696 line in emission helps for the identification of the primary star. In addition, the presence of a second emission peak in this line clearly indicates pollution by HD 93161B, which also displays this line in its spectrum. It thus enables us to estimate the degree of contamination by HD 93161B in each spectrum of HD 93161A. . Throughout this paper, we will refer to the more massive star as the primary, or HD 93161A1.

Only the least blended and higher quality spectra are suitable for the spectral classification. Following Conti & Alschuler (1971); Conti & Frost (1977) and Mathys (1988, 1989), we adopt the classification criterion to determine the spectral types of the stars. For this purpose, we fitted these lines with a combination of several gaussians. This procedure enables to measure the radial velocities (RVs) rather securely, but the presence of small additional components (due to the contamination by the neighbouring HD 93161B) renders the determination of accurate equivalent widths (EWs) rather awkward. The measured ratios are thus rather dispersed, resulting in an approximate O7-7.5 type for the primary and an O7-8.5 type for the secondary at 1- dispersion. To refine this classification further, we have compared their spectrum to the OB star atlas of Walborn & Fitzpatrick (1990). For the primary star, He i 4471 (resp. 4026) appears only slightly stronger than He ii 4542 (resp. 4200). The reverse situation occurs for the He i 4143, 4388 lines, which are weaker than the He ii 4200, 4542 lines. The spectrum of HD 93161A1 is thus similar to that of HD 48279 (Walborn & Fitzpatrick, 1990), indicating an O8 type for this star. On the other hand, the secondary seems cooler: He i 4471 (resp. 4026) is much stronger than He ii 4542 (resp. 4200), while He i 4143 is weaker than He i 4388 but has a strength similar to those of He ii 4200, 4542. HD 93161A2 thus resembles HD 46202, an O9 star. These spectral types are slightly later than those derived from Conti’s criterion. This difference is probably due to the contamination by the B component but we can not totally exclude that the stars might be one subtype earlier.
For the luminosity classification, we rely on the criterion introduced by Conti & Alschuler (1971). For the same reason as before, the measured values of this ratio are rather scattered but they clearly indicate a main sequence classification. Note that the luminosity criterion introduced by Mathys (1988, 1989) was not used here: it relies on absolute EWs, which are difficult to determine because of the variable contamination by HD 93161B. The main sequence classification is further supported by the comparison of our spectra with the atlas of standards since, for both stars, Si iv 4089 is quite faint whereas the He ii 4686 line appears rather strongly in absorption. We thus conclude that HD 93161A is most probably an O8V+O9V binary.
| Lines | rms | ||||||
|---|---|---|---|---|---|---|---|
| (days) | (km s-1) | (km s-1) | (km s-1) | (km s-1) | (km s-1) | ||
| He i 4026 | 0.8 | 8.5665 | 149.73.4 | 201.24.6 | 5.14.0 | 13.05.0 | 14.8 |
| He i 4471 | 1.0 | 8.5662 | 151.52.4 | 202.23.2 | 1.42.5 | 2.23.1 | 12.4 |
| He ii 4542 | 1.4 | 8.5664 | 150.84.8 | 198.16.4 | 4.77.7 | 2.99.6 | 20.1 |
| He ii 4686 | 1.1 | 8.5663 | 150.82.4 | 201.13.2 | 9.12.5 | 3.03.0 | 12.4 |
| He i 4921 | 0.8 | 8.5662 | 148.92.3 | 202.33.1 | 1.12.1 | 1.52.4 | 9.4 |
| He i 5016 | 0.8 | 8.5662 | 155.31.6 | 201.02.1 | 0.61.3 | 0.21.4 | 6.6 |
| He ii 5412 | 1.3 | 8.5666 | 150.84.1 | 192.95.2 | 9.07.5 | 0.29.5 | 20.8 |
| O iii 5592 | 1.2 | 8.5664 | 155.22.3 | 201.33.0 | 0.72.3 | 4.22.7 | 10.4 |
| C iv 5801 | 1.2 | 8.5663 | 153.02.7 | 198.33.5 | 2.52.9 | 5.43.5 | 11.3 |
| C iv 5812 | 1.4 | 8.5663 | 155.12.4 | 197.93.1 | 5.12.5 | 2.83.0 | 10.0 |
| He i 5876 | 0.9 | 8.5663 | 152.52.4 | 202.23.2 | 3.92.4 | 3.12.8 | 9.8 |
| He i 7065 | 0.9 | 8.5663 | 155.82.2 | 201.42.9 | 2.92.0 | 4.12.2 | 8.4 |
4 The spectrum of HD 93161B
A FEROS spectrum of HD 93161B is shown in Fig. 2. This spectrum is similar, but not identical to that of HD 93161A. HD 93161B actually exhibits a few more emission lines, e.g. the weak S iv 4485, N iii 4634, 4641 lines. As already remarked by Vreux & Andrillat (1974), the star appears slightly hotter than its A neighbours, since the He i 4471 line is weaker than the He ii 4542 line.
Among the available spectra of HD 93161B, we again rely only on the high-quality FEROS data for the spectral classification. We used the same classification criteria as above: we determined , suggesting an O6.5 spectral type, while , corresponding to a main sequence classification. We have also compared the spectrum of HD 93161B with those of the spectral atlas of OB standards (Walborn & Fitzpatrick, 1990). In the spectrum of HD 93161B, the He ii 4200, 4542 lines are much stronger than the He i 4143, 4388 lines whereas He i 4026 is stronger than He ii 4200. This confirms the O6.5 type for this star. The relative weakness of the Si iv 4089 line indicates a main sequence classification, again in agreement with Conti’s criterion (which in principle does not apply to stars hotter than O7). Moreover, the N iii 4634, 4641 lines exhibit only a weak emission while the He ii 4686 line is in absorption (with a lower intensity than that of the He ii 4542 line), as is typically seen in some main sequence stars (Walborn & Fitzpatrick, 1990). The presence of these latter lines require the addition of an ((f)) tag to the classification: HD 93161B is thus an O6.5V((f)) star, in agreement with the classification of Walborn (1973).
The bottom part of Table 1 gives the measured RVs of the He i 4471 line on our 3 spectra of HD 93161B. While we find no obvious evidence for a companion in the spectrum, the observed RVs of all lines of HD 93161B are clearly variable. Except perhaps for the lower quality BME data, this is most likely not due to contamination by the A neighbour. Indeed, the contemporaneous spectra of the A star show two widely separated components, which are not (even slightly) detected in the B spectrum and could thus not hamper the RV determination. These RV variations might actually be caused by orbital motion in a binary. Unfortunately, the small number of B spectra does not enable us to further analyse the variability of this star, and especially to determine if these variations are periodic. Additional uncontaminated, high S/N data of HD 93161B would certainly allow to investigate the multiplicity of this star.
5 Orbital solution for HD 93161A
As mentioned before, we have determined the RVs of the lines by fitting them with a sum of gaussian profiles. In order to get a reliable orbital solution, we considered 12 different lines: He i 4026, 4471, 4921, 5016, 5876, 7065; He ii 4542, 4686, 5412; O iii 5592 and C iv 5801, 5812. We present in Table 1 the RVs measured for the He i 4471 line. Note that we have also measured the RVs of the most prominent interstellar lines: for our FEROS observations, the average RV of the CH+ 4232 line is km s-1, whereas for the B&C data, the mean RV of the Ca ii 3933 line is km s-1 and for the BME data, the mean RV of the red component of the Ca ii 3933 line is km s-1. We thus emphasize the very good temporal stability of the FEROS spectrograph, whose spectra constitute the majority of our sample.
Up to now, two orbital solutions for HD 93161 have been published in the literature. Levato et al. (1991) have calculated an SB1 solution for HD 93161, but without specifying to which component (either A or B) it refers. Luna et al. (2003) failed to provide any improvement to the results of Levato et al. (1991)555Note that in Luna et al. (2003), the figure showing the ‘new solution’ for HD 93161 is most probably erroneous. Moreover, in the same bulletin, the authors also provide an SB1 solution for Tr 16-104 and claim to detect no RV variations for Tr 16-110, although both stars were already known as triple systems prior to this publication (Rauw et al., 2001; Albacete Colombo et al., 2002). This may legitimately cast some doubt on the quality of their data.. If these authors measured the RVs on combined spectra of HD 93161, as can be guessed from their description, it seems rather strange that they detected only one component (thus deriving an SB1 solution) since the presence of multiple components is easily spotted even in our medium resolution B&C spectra. In the rest of this paper, we will not discuss these analyses further.
| 8.56630.0040 days | |
| (HJD | 3001.098 |
| 2 450 000) | 0.011 |
| 0.9 | |
| 1.310.02 | |
| 152.91.7 km s-1 | |
| 200.62.2 km s-1 | |
| (after sub.) | 0.021.4 km s-1 |
| (after sub.) | 0.051.6 km s-1 |
| 25.90.2 R⊙ | |
| 33.90.4 R⊙ | |
| 22.20.6 M⊙ | |
| 17.00.4 M⊙ | |
| 0.40260.0015 | |
| 0.35570.0014 | |
| rms | 7.7 km s-1 |
5.1 Period determination
Once the RVs are measured, the next step is to determine the period of the orbital motion. To this aim, we have applied the method of Lafler & Kinman (1965, hereafter LK) as well as a Fourier-type analysis (method of Heck et al. 1985, hereafter HMM, see also the comments by Gosset et al. 2001). Since confusion could be a possible issue, these period search algorithms were first applied to the time series of the absolute RV differences : for each of the lines quoted above, a period of about 4.3 days was then detected. Using this preliminary period and the RVs of the C iii 5696 line, we then identified the primary and secondary, and applied the period search on the actual differences . Both the Fourier analysis and the LK algorithm agree on a value of days for all lines.
Our dataset consists of 42 spectra spread over 2600 days for the He i 4471 and He ii 4686 lines (where there exist B&C data in addition to the FEROS and BME observations) and of 36 spectra spread over 1836 days for the other lines. These observational time bases correspond respectively to natural peak widths of 0.00038 d-1 and 0.00054 d-1. The full width at half maximum of the actual peaks in the periodogram is in agreement with these theoretical values. We adopt an uncertainty of one tenth of the peak’s width, i.e. or 0.004 days, the uncertainty depending on whether or not the B&C data are considered.
5.2 Orbital elements
To derive the orbital elements, we used a modified version of the Wolfe et al. (1967) method. The algorithm, presented by Sana et al. (2003), allows a weighting that differs for the secondary and primary RVs. In the present paper, we have adopted a period value and a relative (primary vs secondary) weight that yield the lower residuals. In addition, we accounted for the quality of the measurements by attributing lower weights to the observations where the components are blended (i.e. only one measurement is available for both stars), noisy (e.g. BME and B&C data), or heavily contaminated by HD 93161B.

At first, we fitted the RVs from each line with a general, eccentric solution. However, the computed eccentricity turned out to be very small (), with a null eccentricity within less than two sigma. Therefore, a circular orbit was assumed for HD 93161A. The results of these non-eccentric fits are displayed in Table 3 for each line. They are compatible with each other, within the errors.
Finally, we tried to get more accurate results by averaging the RVs from different lines. This was done after subtracting the apparent systemic velocities derived for each line from the individual fits. Note that the lines yielding the largest residuals (i.e. He ii 4542, 5412 and He i 4026) were not considered. The lower resolution B&C data were also discarded in order to have a more homogeneous set of RVs. Averaging all other observations allows to obtain an rms residual of 8 km s-1. This best solution, including a reappraisal of the period ( days), is presented in Table 4 and is shown in Fig. 3; it will be adopted throughout the rest of the paper.
The minimum masses derived for the primary and secondary are 22.2 M⊙ and 17.0 M⊙, respectively (see Table 4). Comparing these values to typical masses of O8V and O9V stars allows to estimate the inclination of the system. However, one must be careful when doing so, since the analysis of the binaries in the Tr 16 cluster (HD 93205, Paper II and Tr 16-104, Paper III) has shown that the typical masses presented by well-known references like e.g. Howarth & Prinja (1989) are generally too large compared to the masses derived from the study of binary systems. We therefore decide to adopt the values determined for detached eclipsing systems (Gies, 2003): 22 M⊙ for O8V stars and 18 M⊙ for O9V stars. Such values are very close to the minimum values found for HD 93161A 1 and 2, indicating a large inclination, most probably . With such an inclination, the system should undergo eclipses. Unfortunately, no photometric study of HD 93161 has been conducted up to now: additional observations are thus needed. They will help to constrain further the physical parameters of HD 93161A.
6 XMM-Newton observations of HD 93161
6.1 Spectral analysis
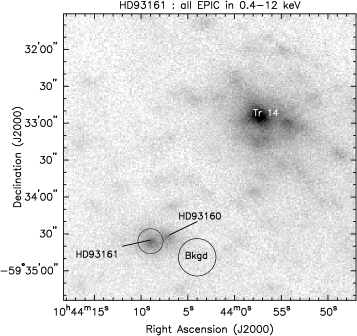
Due to the proximity of HD 93160, the spectrum of HD 93161 was extracted from a circular region with a radius limited to 10″, as is shown in Fig. 4. Due to a poor calibration of the Point Spread Function of the epic instruments (especially PN) at large off-axis angles, we extracted MOS and PN spectra in the extended source mode, i.e. without any EEF (encircled energy fraction) correction. For the chosen region, we estimate that this correction amounts to a factor . The background spectrum was obtained by selecting events from a circular region spatially offset from the source (see Fig. 4).
| Rev. | k | k | (dof) | ||||
|---|---|---|---|---|---|---|---|
| keV | cm-2 | keV | ( erg cm-2 s-1) | ||||
| 115 | 0.17 | 1.14 (132) | 0.85 | 4.91 | |||
| 116 | 0.37 | 1.26 (37) | 0.77 | 4.46 | |||
| 283 | 0.17 | 0.87 (106) | 0.92 | 4.67 | |||
| 284 | 0.53 | 0.89 (122) | 0.96 | 4.72 | |||
| 285 | 0.73 | 1.18 (139) | 0.89 | 4.57 | |||

The X-ray data were then analysed with the xspec software (version 11.2.0). For each observation, the epic spectra were fitted simultaneously by a two-temperature thermal plasma mekal model (Mewe et al., 1985; Kaastra, 1992) of the form wabsint*(mekal1+wabs*mekal2) where wabsint was fixed to the interstellar absorption determined by Diplas & Savage (1994, cm-2). The second wabs model is included to account for the possibility of additional absorption for the hard component of the spectrum. The abundances were set to solar. The best-fitting model parameters are presented in Table 5 and the spectra from Rev. #284 are shown in Fig. 5 along with their best-fitting model. The spectral parameters and the fluxes are fairly stable throughout the five datasets. The parameters are quite typical for a single O-type star, with k keV along with a slightly higher temperature component. Our results are in agreement with the preliminary conclusions of Albacete Colombo et al. (2003) concerning the first two datasets.
6.2 Variability in the X-ray domain
We also investigated the variations of the X-ray emission of HD 93161, first on a short time scale (within each pointing) and then on the long-term range (between the different pointings). For each dataset, the source and background events were extracted using the same regions as those defined for the spectrum analysis. After taking into account the flaring intervals (see Sect. 2.2), these event lists were used to construct background-subtracted lightcurves that were analysed by various methods (Sana et al., 2004). No significant short-term variability was consistently detected in the three instruments.
As a next step, we searched for variations between the different pointings. To this aim, we compared the mean count rates as well as the fluxes determined by spectral fitting (see Table 5): no significant long-term changes from one pointing to another were detected.
6.3 Wind interactions in HD 93161?
We found no clear evidence that the components of HD 93161 are interacting in any manner. The visible spectrum presents only few emission lines and, in particular, no H emission is seen that might arise in a wind collision zone (Thaller, 1997; Sana et al., 2001). Moreover, the minimum Roche lobe radii, , determined for the primary and secondary of HD 93161A are 24.10.2 and 21.30.2, respectively (see Table 4). These large values contrast with the small typical radii (10 R⊙) of O8-9V stars (Howarth & Prinja, 1989; Morrell et al., 2001; Rauw et al., 2001; Gies, 2003; Sana et al., 2005b), indicating that this object is a well detached binary system without any ongoing Roche lobe overflow. In addition, HD 93161 is not a particularly bright X-ray source, since its unabsorbed luminosity amounts only to erg s-1 (after EEF correction and for a distance of 2.5 kpc, see next section), or (using the determined in the next section).
We can compare this observed X-ray luminosity to the emission expected for a wind collision in HD 93161A. First, we determine the mass-loss rates and terminal velocities using the recipes of Vink et al. (2000, 2001) and the probable radii, masses, temperatures, and bolometric luminosities of the stars (see Sects. 5.2 and 7). Using the formalism of Pittard & Stevens (2002), we then find that, in the case of HD 93161A, a radiative wind collision would lead to an X-ray emission with erg s-1. However, the physical parameters of HD 93161A (strengths of the winds, separation between the stars) should rather lead to a slightly adiabatic shock: the X-ray emission associated with such a collision could thus be significantly lower than in the radiative case. In fact, the total luminosity derived after applying the ‘canonical’ – relation (see Berghöfer et al., 1997, and Sana et al. 2005a) to the three massive stars of HD 93161 is erg s-1, indicating that the observed X-ray emission does not display a large excess attributable to a wind interaction. This conclusion is further supported by the lack of hard X-ray photons and the constancy of the X-ray emission. We might note however that our X-ray observations do not sample the whole orbital cycle: as was the case for CPD (Sana et al., 2005b), the signature of a wind collision could be limited to a few crucial phases.
Finally, Benaglia & Koribalski (2004) observed the Carina nebula with ATCA at 3 and 6 cm aiming at the detection of non-thermal radio emission but HD 93161 was not detected in this survey, contrary to what would be expected if there was a wind collision between HD 93161A and HD 93161B. Therefore, from the available data, we conclude that there is probably no strong wind interaction in HD 93161.
7 Fundamental parameters
Using the temperature scale of Martins et al. (2002), we can convert the spectral types derived above into effective temperatures of K, K and K for HD 93161B, HD 93161A1 and HD 93161A2 respectively. The quoted uncertainties correspond to half a subclass for the components of HD 93161A and to the range of temperatures for the O6.5 V class according to Martins et al.
In order to derive the luminosities, we need the observed magnitude, the reddening, the brightness ratios between the different components, the bolometric corrections and an estimate of the distance. The WEBDA666available at the url http://obswww.unige.ch/webda/ (Mermilliod, 1988, 1992) database lists the results of several photometric studies that provide the apparent magnitude of HD 93161 (Walborn, 1973; Feinstein et al., 1973; Kaltcheva & Georgiev, 1993; Forte, 1978; Massey & Johnson, 1993). On average, we find for the entire HD 93161 system. On the other hand, Vázquez et al. (1996) quote and for HD 93161A and HD 93161B respectively. These magnitudes yield for the entire system (components A + B) in good agreement with the mean value hereabove. Mason et al. (1998) found for HD 93161A and for HD 93161B. If these values were correct, the total magnitude of HD 93161 should be 8.3 in contradiction with the other observations. In the following, we therefore adopt apparent magnitudes of and for HD 93161A and B respectively.
The colour indices of HD 93161A and HD 93161B were found to be 0.20 and 0.23 respectively (Vázquez et al., 1996). Comparing with typical colour indices of O stars (Schmidt-Kaler, 1982), we hence adopt and for HD 93161A and HD 93161B.
To estimate the relative brightness of the components of HD 93161A in the visible spectral range, we evaluate the ratio of the EWs of the primary and secondary components for a number of lines in our 2004 FEROS spectra (the least contaminated by the B component). We use the He i 4471, 5876, He ii 4542 and O iii 5592 lines and we compare the EW ratios to the values for typical EWs evaluated from the compilation provided by Conti & Alschuler (1971) and Conti (1974). In this way, we estimate a brightness ratio of between the primary and secondary of HD 93161A. This results in apparent magnitudes of and for the primary and secondary components respectively.
The distances to the clusters Trumpler 14, Trumpler 16, Collinder 228 and Collinder 232 are still poorly known. How controversial the issue of the distances and even the actual existence of these clusters is, can be illustrated by a brief overview of the literature. Walborn (1995) summarised the situation as follows: Tr 14 is younger than Tr 16, but both clusters lie at the same distance; neither Collinder 228 nor 232 are genuine clusters, the former is part of Tr 16, whereas the latter contains stars of Tr 14 and Tr 16. The ambiguities on the distances of Tr 14 and Tr 16 are at least partly due to the uncertainties on the extinction towards these clusters. Using UBV photometry, Massey & Johnson (1993) inferred a distance of 3.2 kpc for Tr 14 and Tr 16. Assuming a normal extinction law and based on Strömgren and H photometry, Kaltcheva & Georgiev (1993) derived distances of individual stars in Tr 16. These authors reached a radically different conclusion: since our line of sight towards Tr 16 is almost parallel to the molecular cloud ridge in the Carina spiral arm, the stars might not belong to an actual cluster but could instead lie along an extended star formation region which is projected on a small area on the sky. Recently, Carraro et al. (2004) presented a study of Tr 14, Tr 16 and Collinder 232 based on photometry. These authors argued that a unique reddening law is not appropriate to study the whole region and they estimated different values of the selective extinction for each cluster. By comparing their observations with empirical main-sequences, they derived distances of about 2.5 kpc for Tr 14 and Collinder 232, but a much larger distance of about 4 kpc for Tr 16. The latter result is clearly at odds with previous distance determinations. In particular, the studies of two eclipsing binaries in Tr 16 (Tr 16-1, Freyhammer et al., 2001, and Tr 16-104, Rauw et al. 2001) allowed to obtain absolute luminosities of these stars. Adopting bolometric corrections from Humphreys & Mac Elroy (1984) and assuming , a distance of about 2.5 kpc is inferred for these binaries, in excellent agreement with the Tr 16 distance found by Tapia et al. (2003). In the following, we shall therefore adopt a distance of 2.5 kpc for HD 93161.
For Collinder 232, Carraro et al. (2004) infer , whereas they estimate for HD 93161 and for its close neighbour on the sky HD 93160. Adopting an average value of , we obtain absolute magnitudes of , and for HD 93161A1, A2 and B respectively. Finally, adopting the bolometric corrections from Humphreys & Mac Elroy (1984), we obtain bolometric luminosities of , and .
Using these values, we have plotted in Fig. 6, the components of HD 93161 in the Hertzsprung-Russell diagram along with the evolutionary tracks from Schaller et al. (1992) for solar metallicity. This diagram suggests that the stars have an age of 3-4 Myr and are thus slightly evolved off the zero age main sequence (ZAMS), unlike other stars of the Tr 16 cluster, e.g. the components of Tr 16-104 which were found to lie very close to the ZAMS (Rauw et al., 2001). A crude interpolation between the evolutionary tracks yields evolutionary masses of 30.11.1 M⊙ and 22.40.8 M⊙ for the primary and secondary, respectively. This corresponds to a mass ratio of 1.340.07, in excellent agreement with the observed ratio of 1.310.02. The orbital inclination corresponding to these evolutionary masses would be 652∘, and this lower value of the inclination would prohibit eclipses. A photometric study of HD 93161 is thus necessary in order to assess the masses but we might already note that in the case of the binary HD 93205 (Paper II), evolutionary masses are larger than the true masses. Finally, we caution that the luminosity of HD 93161B might be overestimated if the star turned out to be another binary system.

8 Conclusions
We have presented a thorough spectroscopic investigation of HD 93161, based on medium and high resolution data obtained over a period of 7 years. Although the small separation between the two components of HD 93161 did not enable us to get totally uncontaminated spectra, we have shown that HD 93161 actually harbours a detached SB2 system (HD 93161A) and a star displaying RV variations (HD 93161B).
The primary (resp. secondary) star of HD 93161A is most probably of spectral type O8V (resp. O9V). Using the RVs measured for each component of HD 93161A, we provide the first orbital solution for this system. The orbital period is 8.5660.004 days and the minimum masses for the primary and secondary stars are 22.20.6 M⊙ and 17.00.4 M⊙, respectively. Such large minimum values, compared to typical masses for O8V and O9V stars, suggest a high inclination of the orbit. It is therefore possible that HD 93161A undergoes eclipses. A follow-up study should be undertaken to check the photometric behaviour of HD 93161A.
The visual companion of HD 93161A, HD 93161B, is of type O6.5V((f)) and is thus slightly hotter than its neighbours. HD 93161B presents radial velocity variations, but no fully obvious signature of a companion could be found in its spectrum. The small number of our observations of this star did not enable us to investigate the periodicity of the velocity changes. Additional observations are required to check the binary status of HD 93161B.
Considering that HD 93161 lies at a distance of 2.5 kpc, we found that all three components of HD 93161 are slightly evolved off the ZAMS. In the X-ray domain, HD 93161 appears as a moderately bright X-ray source displaying a two-temperature spectrum and no significant variability, suggesting an X-ray emission predominantly intrinsic to the stellar winds of the individual components.
Acknowledgments
The Liège team acknowledges support from the Fonds National de la Recherche Scientifique (Belgium) and through the PRODEX XMM-OM and Integral projects. This research is also partly supported by contracts P5/36 “Pôle d’Attraction Interuniversitaire” (Belgian Federal Science Policy Office). IIA acknowledges support from the Russian Foundation for Basic Research (project No 02-02-17524) and the Russian LSS (project No Nsh-388.2003.2).
References
- Albacete Colombo et al. (2001) Albacete Colombo J.F., Morrell N.I., Niemela V.S., Corcoran M.F., 2001, MNRAS, 326, 78 (Paper I)
- Albacete Colombo et al. (2002) Albacete Colombo J.F., Morrell N.I., Rauw G., Corcoran M.F., Niemela V.S., Sana H., 2002, MNRAS, 336, 1099 (Paper IV)
- Albacete Colombo et al. (2003) Albacete Colombo J.F., Méndez M., Morrell N.I., 2003, MNRAS, 346, 704
- Antokhin et al. (2005) Antokhin I.I, et al., 2005, submitted
- Benaglia & Koribalski (2004) Benaglia P., Koribalski B., 2004, A&A, 416, 171
- Berghöfer et al. (1997) Berghöfer T.W., Schmitt J.H.M.M., Danner R., Cassinelli J.P., 1997, A&A, 322, 167
- Carraro et al. (2004) Carraro G., Romaniello M., Ventura P., Patat F., 2004, A&A, 418, 525
- Conti (1974) Conti P.S., 1974, ApJ, 187, 539
- Conti & Alschuler (1971) Conti P.S., Alschuler W.R., 1971, ApJ, 170, 325
- Conti & Frost (1977) Conti P.S., Frost S.A., 1977, ApJ, 212, 728
- Corcoran et al. (1999) Corcoran M.F., Pittard J.M., Marchenko S.V., The XMega Group, 1999, in van der Hucht K.A., Koenigsberger G., and Eenens P.R.J., eds, Proc. IAU Symp. 193, Wolf-Rayet Phenomena in Massive Stars and Starburst Galaxies, Astron. Soc. Pac., San Francisco, p.772
- Diplas & Savage (1994) Diplas A., Savage B.D., 1994, ApJS, 93, 211
- Feinstein et al. (1973) Feinstein A., Marraco H.G., Muzzio J.C., 1973, A&AS, 12, 331
- Forte (1978) Forte J.C., 1978, AJ, 83, 1199
- Freyhammer et al. (2001) Freyhammer L.M., Clausen J.V., Arentoft J., Sterken C., 2001, A&A, 369, 561
- Gies (2003) Gies D.R., 2003, in van der Hucht K.A., Herrero A., and Esteban C., eds, Proc. IAU Symp. 212, A Massive Star Odyssey: From Main Sequence to Supernova, Astron. Soc. Pac., San Francisco, p.91
- Gosset et al. (2001) Gosset E., Royer P., Rauw G., Manfroid J., Vreux J.-M., 2001, MNRAS, 327, 435
- Heck et al. (1985) Heck A., Manfroid J., Mersch G., 1985, A&AS, 59, 63
- Howarth & Prinja (1989) Howarth I.D., Prinja R.K., 1989, ApJS, 69, 527
- Howarth et al. (1997) Howarth I.D., Siebert K.W., Hussain G.A.J., Prinja R.K., 1997, MNRAS, 284, 265
- Humphreys & Mac Elroy (1984) Humphreys R.M., Mac Elroy D.B., 1984, ApJ, 284, 565
- Jansen et al. (2001) Jansen F., et al., 2001, A&A, 365, L1
- Kaastra (1992) Kaastra J.S., 1992, An X-ray Spectral Code for Optically Thin Plasmas, SRON-Leiden Internal Report
- Kaltcheva & Georgiev (1993) Kaltcheva N.T., Georgiev L.N., 1993, MNRAS, 261, 847
- Kaufer et al. (1999) Kaufer A., Stahl O., Tubbesing S., Norregaard P., Avila G., François P., Pasquini L., Pizzella A., 1999, The Messenger, 95, 8
- Lafler & Kinman (1965) Lafler J., Kinman T.D., 1965, ApJS, 11, 216
- Levato et al. (1991) Levato H., Malaroda S., Morrell N., Garcia B., Hernandez C., 1991, ApJS, 75, 869
- Luna et al. (2003) Luna G.J., Levato H., Malaroda S., Grosso M., 2003, Information Bulletin on Variable Stars, 5375, 1
- Martins et al. (2002) Martins F., Schaerer D., Hillier D.J., 2002, A&A, 382, 999
- Mason et al. (1998) Mason B.D., Gies D.R., Hartkopf W.I., Bagnuolo W.G.Jr., ten Brummelaar T., McAlister H.A., 1998, AJ, 115, 821
- Massey & Johnson (1993) Massey P., Johnson J., 1993, AJ, 105, 980
- Mathys (1988) Mathys G., 1988, A&AS, 76, 427
- Mathys (1989) Mathys G., 1989, A&AS, 81, 237
- Mermilliod (1988) Mermilliod J.-C., 1988, Bulletin d’Information du Centre de Données Stellaires (CDS), 35, 77
- Mermilliod (1992) Mermilliod J.-C., 1992, Bulletin d’Information du Centre de Données Stellaires (CDS), 40, 115
- Mewe et al. (1985) Mewe R., Gronenschild E.H.B.M., van den Oord G.H.J., 1985, A&AS, 62, 197
- Morrell et al. (2001) Morrell N.I., et al., 2001, MNRAS, 326, 85 (Paper II)
- Penny (1996) Penny L.R., 1996, ApJ, 463, 737
- Pittard & Stevens (2002) Pittard J.M., Stevens I.R., 2002, A&A, 388, L20
- Raassen et al. (2003) Raassen A.J.J., van der Hucht K.A., Mewe R., Antokhin I. I., Rauw G., Vreux J.-M., Schmutz W., Güdel M., 2003, A&A, 402, 653
- Rauw et al. (2001) Rauw G., Sana H., Antokhin I.I., Morrell N.I., Niemela V.S., Albacete Colombo J.F., Gosset E., Vreux J.-M., 2001, MNRAS, 326, 1149 (Paper III)
- Sana et al. (2001) Sana H., Rauw G., Gosset E., 2001, A&A, 370, 121
- Sana et al. (2003) Sana H., Hensberge H., Rauw G., Gosset E., 2003, A&A, 405, 1063
- Sana et al. (2004) Sana H., Stevens I.R., Gosset E., Rauw G., Vreux J.-M., 2004, MNRAS, 350, 809
- Sana et al. (2005a) Sana H., Nazé Y., Gosset E., Rauw G., Sung H., Vreux J.-M., 2005a, in Moffat A.F.J., St Louis N., eds, ASP Conf. Series, Massive Stars in Interacting Binaries, Astron. Soc. Pac., San Francisco, in press
- Sana et al. (2005b) Sana H., Antokhina E., Royer P., Manfroid J., Gosset E., Rauw G., Vreux J.-M., A&A, 2005b, submitted
- Schaller et al. (1992) Schaller G., Schaerer D., Meynet G., Maeder A., 1992, A&AS, 96, 269
- Schmidt-Kaler (1982) Schmidt-Kaler T., 1982, Landölt-Bornstein Catalogue VI/2b
- Strüder et al. (2001) Strüder L., et al., 2001, A&A, 365, L18
- Tapia et al. (2003) Tapia M., Roth M., Vázquez R.A., Feinstein A., 2003, MNRAS, 339, 44
- Thaller (1997) Thaller M.L., 1997, ApJ, 487, 380
- Turatto et al. (1997) Turatto M., Tighe R., Castillo R., 1997, ESO Technical Report, n∘E15-TRE-ESO-22201-00001
- Turner et al. (2001) Turner M.J.L., et al., 2001, A&A, 365, L27
- Vázquez et al. (1996) Vázquez R.A., Baume G., Feinstein A., Prado P., 1996, A&AS, 116, 75
- Vink et al. (2000) Vink J.S., de Koter A., Lamers H.J.G.L.M., 2000, A&A, 362, 295
- Vink et al. (2001) Vink J.S., de Koter A., Lamers H.J.G.L.M., 2001, A&A, 369, 574
- Vreux & Andrillat (1974) Vreux J.-M., Andrillat Y., 1974, A&A, 34, 313
- Walborn (1973) Walborn N.R., 1973, ApJ, 179, 517
- Walborn (1995) Walborn N.R., 1995, RevMexAA Serie de Conferencias, 2, 51
- Walborn & Fitzpatrick (1990) Walborn N.R., Fitzpatrick E.L., 1990, PASP, 102, 379
- Wolfe et al. (1967) Wolfe R.H.Jr, Horak H.G., Storer N.W., 1967, in Modern Astrophysics, ed. M. Hack, Gordon & Breach (New York), 251