Five Years of Observations with the Chandra X-Ray Observatory
Abstract
The Chandra X-ray Observatory is the X-ray component of NASA’s Great Observatory Program and has been operating successfully for over five years. We present here brief overview of the technical performance and some of the remarkable discoveries.
NASA/MSFC, SD50, MSFC AL 35812
1. Technical Performance
1.1. The Spacecraft
The Observatory was launched on July 23, 1999 using the Space Shuttle Columbia. Placement in its highly elliptical orbit was completed 15 days after launch. The orbit has a nominal apogee of 140,000 km and a nominal perigee of 10,000 km. With this orbit, the satellite is above the radiation belts for more than about 75% of the 63.5-hour orbital period and uninterrupted observations lasting more than 2 days are possible. The observing efficiency, which also depends on solar activity, has varied from 65% to more than 70%.
The spacecraft has been functioning superbly since launch. The specified design life of the mission was 5 years; however, the only perishable is gas for maneuvering and is sized to allow operation for much more than 10 years. The orbit will be stable for decades.
One of the most important functions of the Observatory subsytems is to provide the absolute accuracy of Chandra X-ray source locations. Based on observations of 225 point sources detected within 2′ of the boresight and having accurately known coordinates, the 90% source location error circle has a radius of 0.64′′ and fewer than 1% of sources are outside a 1′′ radius.
There is also an effective blurring of the X-ray point spread function (PSF) due to uncertainties in determining the aspect solution. An indirect method of estimating aspect blurring uses the aspect solution to “de-dither” the aspect camera’s star images and measure the residual jitter. Based on a sample of 350 observations one finds that 99% of the time the effective blurring is less than 0.20′′ (FWHM).
1.2. The Optics
The heart of the Observatory is the X-ray telescope made of four concentric, precision-figured, superpolished Wolter-1 telescopes, similar to those used for both the Einstein and Rosat observatories, but of much higher quality, larger diameter, and longer focal length.
The telescope’s on-axis PSF, as measured during ground calibration, had a full-width at half-maximum less than 0.5 arcsec and a half-power diameter less than 1 arcsec. The pre-launch prediction for the on-orbit encircled-energy fraction was that a 1-arcsec-diameter circle would enclose at least half the flux from a point source. A relatively mild dependence on energy, resulting from diffractive scattering by surface microroughness, attests to the better than 3-angstroms-rms surface roughness measured with optical metrology during fabrication and confirmed by the ground X-ray testing. The on-orbit performance met expectations.
1.3. The Focal Plane Cameras
The Pennsylvania State University (PSU, University Park, Pennsylvania) and MIT designed and fabricated the Advanced CCD Imaging Spectrometer (ACIS) with CCDs produced by MIT’s Lincoln Laboratory. Made of a 2-by-2 array of large-format, front-illuminated (FI), 2.5-cm-square CCDs, ACIS-I provides high-resolution spectrometric imaging over a 17-arcmin-square field of view. ACIS-S, a 6-by-1 array of 4 FI CCDs and two back-illuminated (BI) CCDs mounted along the Chandra transmission grating dispersion direction, serves both as the primary read-out detector for the High Energy Transmission Grating (HETG), and, using the one BI CCD which can be placed at the aimpoint of the telescope, also provides high-resolution spectrometric imaging extending to lower energies but over a smaller (8-arcmin-square) field than ACIS-I. Both ACIS detectors are covered with aluminized-polyimide filters, designed to block visible light. The spatial resolution for imaging with ACIS is limited by the physical size of the CCD pixels (24.0 m square 0.492 arcsec).
The ACIS FI CCDs originally approached the theoretical limit for energy resolution at almost all energies, while the BI were of somewhat lesser quality due to imperfections induced in the manufacturing process (Bautz et al. 1998). Subsequent to launch and orbital activation, the FI CCDs have developed much larger charge transfer inefficiency (CTI) and the energy resolution has become a function of the row number, being nearer pre-launch values close to the frame store region and progressively degraded toward the farthest row (Prigozhin et al.2000). Note that a post-facto software correction has been developed which recovers much of the energy resolution lost (Townsley et al. 2002).
The damage to the FI CCDs was caused by low energy protons which Rutherford-scattered from the X-ray telescope onto the focal plane. Subsequent to the discovery of the degradation, operational procedures were changed so that the ACIS instrument is not left at the focal position during radiation belt passages where the proton flux is the highest. Since then, degradation in performance has been limited to the small, gradual increase due to cosmic rays that was predicted before launch. The BI CCDs were not impacted as it is far more difficult for low energy protons to deposit their energy in the buried channels where damage is most detrimental to performance. These channels are near the CCD gates and the BI gates face in the direction opposite to the telescope.
The ACIS instrument has the coldest surfaces on the Observatory. Thus, naturally, there has been a gradual accumulation of a contaminating layer which decreases the low energy detection efficiency and introduces distinctive absorption edges. The contaminant appears to be deposited on the optical blocking filters and not on the CCDs themselves. These filters are nominally at a temperature of -60 degrees C.
An obvious response to contaminant deposition is to temporarily raise the temperature of the focal plane. This procedure has not been immediately undertaken because of the experience, early in the mission, in which a bakeout further degraded the CTI of the already radiation-damaged FI CCDs. Currently the risks and benefits of different bakeout scenarios are under study.
The Smithsonian Astrophysical Observatory (SAO, Cambridge MA), designed and fabricated the other focal plane camera the High Resolution Imager (HRC) (Murray et al. 2000). Made of a single 10-cm-square microchannel plate (MCP), the HRC-I provides high-resolution imaging over a 30-arcmin-square field of view. A second detector made of 3 rectangular MCP segments (3-cm 10-cm each) mounted end-to-end along the grating dispersion direction, the HRC-S, serves as the primary read-out detector for the Low Energy Transmission Grating (LETG). Both detectors have cesium-iodide-coated photocathodes and are covered with aluminized-polyimide UV/ion shields. There has been no noticeable buildup of contamination on these filters which are much warmer than the ACIS filters.
The HRC time resolution of 16 sec offers the highest precision timing of the two imaging cameras. However, the HRC was mis-wired so that the time of the event associated with the j-th trigger is that of the previous (j-th -1) trigger. If the all the data were routinely telemetered, the times could be simply corrected by reassigning the time tag. Since the problem has been discovered, new operating modes have been defined which allow one to telemeter all data whenever the total counting rate is moderate to low. For very bright sources the counting rate is so high that information associated with certain triggers are never telemetered. In this case, the principal reason for dropping events is that the on-board, first-in-first-out (FIFO) buffer fills as the source is introducing events at a rate faster than the telemetry readout. Events are dropped until readout commences freeing one or more slots in the FIFO. This situation can also be dealt with (Tennant et al. 2001) at the price of reduced detection efficiency and time resolution of the order of a millisecond can be achieved.
1.4. The Gratings
Aft of the X-ray telescope are 2 objective transmission gratings (OTGs) - the Low-Energy Transmission Grating (LETG) and the High-Energy Transmission Grating (HETG). Positioning mechanisms are used to insert either OTG into the converging beam where they disperse the x-radiation onto the focal plane.
The Space Research Institute of the Netherlands and the Max-Planck-Institüt für extraterrestrische Physik designed and fabricated the LETG. When in position, the 540 grating facets, mounted 3 per module, lie tangent to the Rowland toroid which includes the focal plane. With free-standing gold bars of about 991-nm period, the LETG provides high-resolution spectroscopy ( ) between 80 and 175 Å (0.07 – 0.15 keV) and moderate resolving power at shorter wavelengths. The nominal LETG wavelength range accessible with the HRC-S as the detector is 1.2 – 175 Å (0.07 – 10 keV); ACIS-S coverage is 1.2 – 65 Å (0.20 – 10 keV). The on-orbit performance of the LETG is similar to pre-flight predictions (e.g. Brinkman et al. 1997; Predehl et al. 1997; Dewey et al. 1998),
The dominant contribution to the LETG line response function (LRF) and instrument resolving power is the telescope PSF, which is m FWHM, depending on energy. When the LETG is used with the HRC-S, the intrinsic uncertainty in photon position determination adds another small contribution of order 15-m. Uncertainties in correcting photon event positions and for the observatory aspect also introduces an additional blurring of order a few m. For spectral lines with counts, the FWHM of the combined LETG+HRC LRF can is m, or Å.
The Massachusetts Institute of Technology (MIT, Cambridge, Massachusetts) designed and fabricated the HETG. The HETG employs 2 types of grating facets — the Medium-Energy Gratings (MEG), which, when swung into position appear behind the X-ray telescope’s 2 outermost shells, and the High-Energy Gratings (HEG), which appear behind the X-ray telescope’s 2 innermost shells. With polyimide-supported gold bars of 400-nm and 200-nm periods, respectively, the HETG provides high-resolution spectroscopy from 0.4 to 4 keV (MEG, 30 to 3 Å) and from 0.8 to 8 keV (HEG, 15 to 1.5 Å).
The HETGS LRF has a Gaussian-like core with extended wings. The model of the HETG LRF is comprised of two Gaussians and two Lorentzians with the narrow Gaussian dominating. The LRFs derived from the fits match in-flight data extremely well (Marshall, Dewey, & Ishibashi, 2004). The spectral resolution is the FWHM of the LRF and is, for all practical purposes, independent of wavelength being 0.012Å for the HEG and 0.023Å for the MEG.
2. Observations and Discoveries
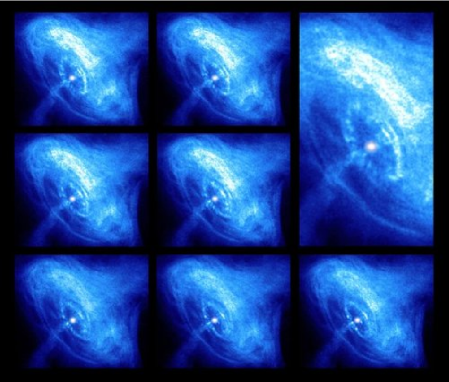
The first X-rays focused by the telescope were observed on August 12, 1999. Figure 1111Pictures that are publicly available at the Chandra web site at http://chandra.harvard.edu have credits labeled ”Courtesy … NASA/”. The acronyms may be found at this site. is a later example of one of the early images. The image of the Crab Nebula and its pulsar included a major new discovery (Weisskopf et al. 2000) - the bright inner elliptical ring showing the first direct observation of the shock front where the wind of particles from the pulsar begins to radiate in X-rays via the synchrotron process.
The Observatory’s capability for high-resolution imaging has enabled detailed studies of the structure of extended X-ray sources, including supernova remnants, astrophysical jets, and hot gas in galaxies and clusters of galaxies. Equally important have been Chandra’s unique contributions to high-resolution dispersive spectroscopy. The high spectral resolution of the Chandra gratings isolates individual lines from the myriad of spectral lines, which would overlap at lower resolution. The additional capability for spectrometric imaging allows studies of structure, not only in X-ray intensity, but also in temperature and in chemical composition. Through these observations, users have addressed and are continuing to address the most exciting topics in contemporary astrophysics.
In addition to mapping the structure of extended sources, the high angular resolution permits studies of discrete sources, which would otherwise be impossible. From planetary systems to deep surveys of the faintest and most distant sources, the scientific results from the first five years of Chandra operations have been outstanding. We cannot possibly review all of the results, so in what follows we simply highlight a few.
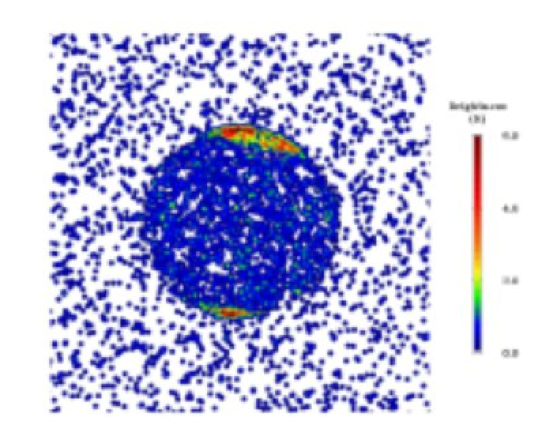
Figure 2 shows hot spots at high (and unexpected) latitudes of the X-ray emission from the planet Jupiter that appear to pulsate at approximately a 45-minute period (Gladstone et al. 2002). The X-rays are thought to be produced by particles bombarding the Jovian atmosphere after precipitating along magnetic field lines. Several other planets have been shown to emit X-rays, albeit with different emission mechanisms. In the case of Mars, e.g. (Dennerl, 2002) fluorescent scattering of solar X-rays in the upper atmosphere produces the X-rays and the spectrum is dominated by a single narrow emission line, most likely caused by oxygen K-shell fluorescence.
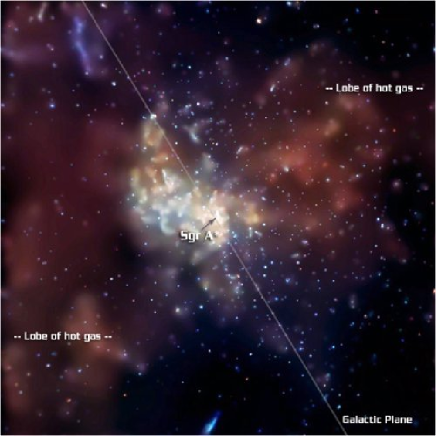
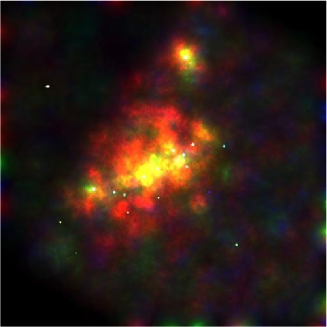
One of the most spectacular Chandra images is the one of the center of our own galaxy (Baganoff et al. 2003) shown in Figure 3 where one clearly sees both point-like discrete sources (over 1000) and diffuse extended emission. The large amount of hot, X-ray-emitting gas has been heated and chemically enriched by numerous stellar explosions.
The final legacy of Chandra may ultimately be led by the spectroscopic data. The energy resolution, enabled by the quality of the optics and gratings, is providing new and extremely complex results. The broad bandpass of the grating spectrometers, combined with high resolution, has proven equally important for astrophysical insights in situations where spectral features are not present. For example, the remarkable line-free smoothness of the continuum of the isolated neutron star RXJ 1856-3754 was a spectacular surprise when revealed in detail using a 500 ks observation. This object is the nearest and brightest isolated neutron star candidate (Walter, Wolk & Neuhäuser 1996), and it had been hoped that metal lines formed in its outer atmosphere would provide a direct measurement of gravitational redshift and insights into the equation of state of ultra-dense matter. An early 55 ks exposure lacked the sensitivity to detect weak absorption features (Burwitz et al. 2001), but the 500 ks LETG spectrum placed stringent limits on the strengths of any absorption features (Drake et al. 2002). The unexpected result has stimulated a number of theoretical investigations (e.g. Braje and Romani 2002, Trümper et al. 2003, Mori and Ruderman 2003, Turolla et al. 2004) including speculations that the absence of features are due to the strong magnetic field or that its outer layers might lack an atmosphere and reside in a solid state or that the object is a slowly spinning magnetar.
Observations with the gratings are not only providing new astrophysical results, they also provide a challenge to atomic physicists. The heart of the LETG+HRC-S bandpass covers the historically relatively uncharted part of the soft X-ray spectrum from 25-70 Å. Prior to Chandra, only a small handful of astrophysical observations had been made at anything approaching high spectral resolution in this range: these were of the solar corona using photographic spectrometers (Widing & Sandlin 1986; Freeman & Jones 1970; Schweizer & Schmidtke 1971; Behring, Cohen, & Feldman 1972; Manson 1972; Acton et al. 1985). In comparison, LETG spectra of similar X-ray sources – the coronae of the solar-like stars Centuri A (G2 V) and B (K1 V) and of Procyon (Raassen et al. 2002, 2003) – in this range are at the same time both daunting and revealing. This spectral range contains a superposition of “L-shell” emission of abundant elements such as Mg, Si, S and Ar, providing a challenge to spectroscopists hoping to understand this region in terms of individual atomic transitions. Drake et al. (2005) have shown that current radiative loss models in common usage by X-ray astronomers underestimate the line flux in the 25-70 Å range by factors of up to 5. Laboratory efforts prompted by Chandra spectra, and the need for a better theoretical description of plasma radiative emission in this spectral region, are just beginning to unravel the tangle of lines into their parent ions (e.g. Lepson et al. 2003 and references therein).
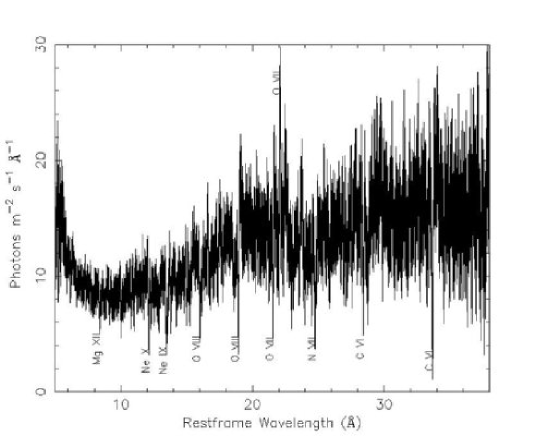
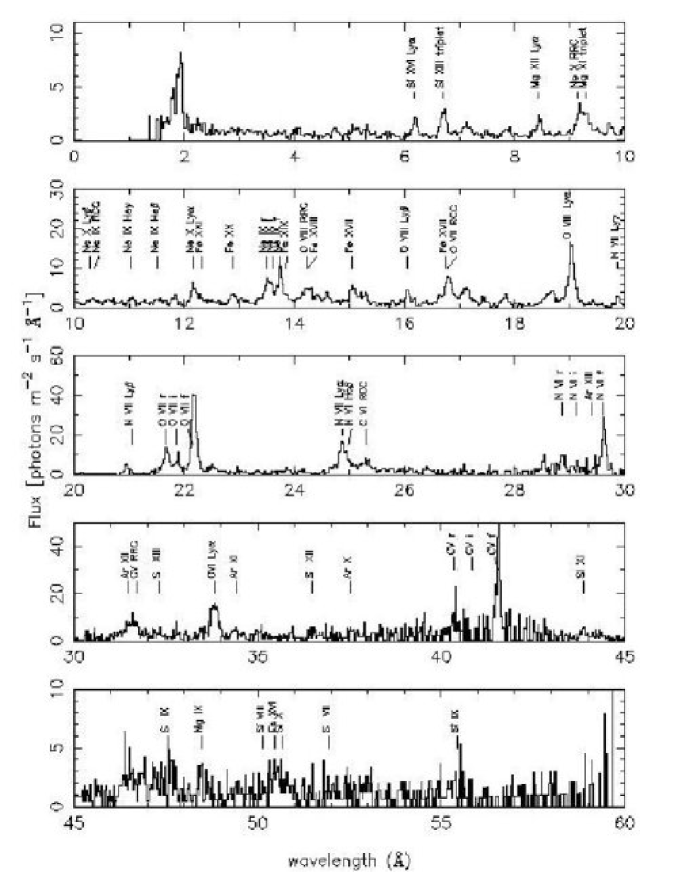
High-resolution spectra of Seyfert galaxies are now providing new details about the physical and dynamical properties of material surrounding the active nucleus. For example, the Seyfert 1 active galaxy Mkn 478 was expected to exhibit absorption lines at shorter wavelengths from a warm absorber that has often been seen in the spectra of other Seyfert 1 galaxies, and emission lines at wavelengths of Å based on an analysis of EUVE spectra by Hwang & Bowyer (1997). Mkn 478 lies in a direction out of the galaxy that has a particularly low neutral hydrogen column density, and so remains a strong source at these longer wavelengths. Furthermore, for Seyfert-1s, whose signal is dominated by a bright X-ray continuum from the central engine, the partially ionized circum-source material introduces prominent patterns of absorption lines and edges. Figure 4, e.g. shows a LETG/HRC-S spectrum of NGC 5548. This spectrum has dozens of absorption lines (Kaastra et al. 2000). For Seyfert 2’s the strong continuum from the central engine is not seen directly, so the surrounding regions are seen in emission. Figure 5 provides an example of a LETG/HRC observation of the Seyfert 2, NGC 1068 (Brinkman et al. 2002).
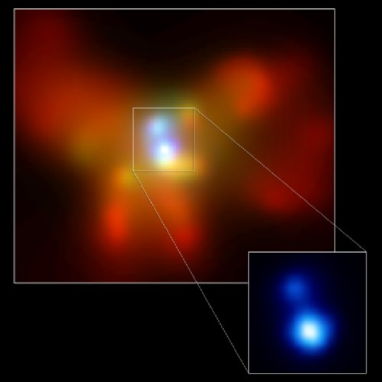
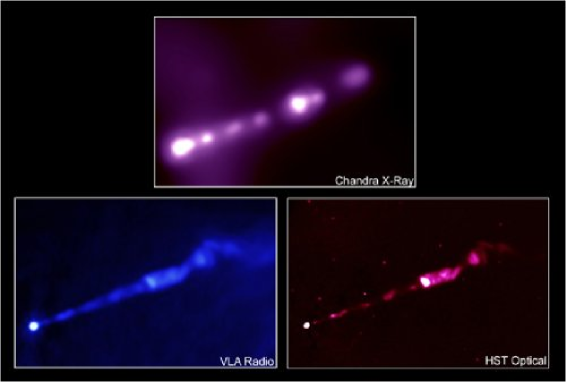
The study of active galaxies is one of the centerpieces of studies with the Observatory. Figure 6 of NGC 6240 illustrates a recent spectacular result — the first image of a double quasar nucleus (Komossa et al. 2003). Figure 7 of M87 illustrates multiwavelength observations of the jets from active galaxies. The Chandra X-ray image (Marshall et al. 2002) shows an irregular, knotty structure similar to that seen at radio and optical (Perlman et al. 2001) wavelengths. However, the knots near the central core are much brighter in X-rays. The jet phenomenon now appears to be ubiquitous in astronomical settings, especially with regards to X-ray emission as e.g. the series of observations of the outer jet of the Vela pulsar (Pavlov et al. 2003).
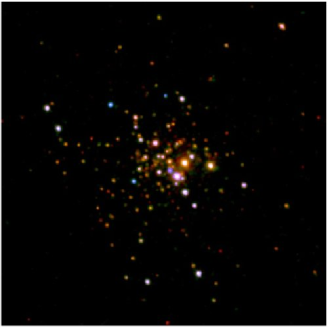
One of the more important triumphs of the Observatory has been to use the angular resolution and high sensitivity to perform detailed surveys of extended objects such as globular clusters, galaxies, and clusters of galaxies. Figure 8 shows one of the spectacular Chandra images of globular clusters (Grindlay et al. 2001). A survey of two interacting galaxies is illustrated in Figure 9 where one sees emission from diffuse gas and bright point sources.
A major triumph of Chandra (and XMM-Newton) high-resolution spectroscopic observations has been the discovery that the gas in the clusters is typically not cooling to below about 1-2 keV (see for example the discussion in Fabian (2002) which indicates the presence of one (or more) heating mechanisms).
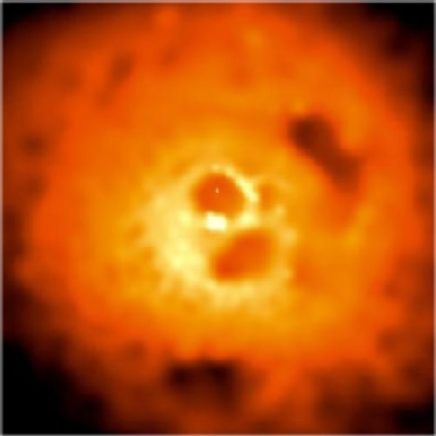
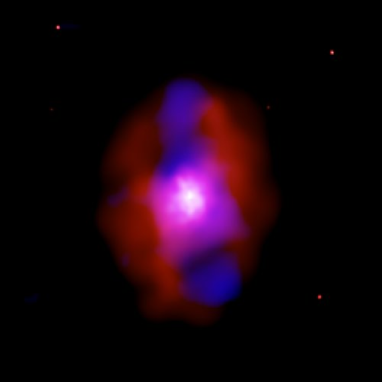
Chandra observations of clusters of galaxies frequently exhibit previously undetected structures with characteristic angular scales as small as a few arc seconds. These structures include ”bubbles” where there is strong radio emission, bow shocks, and cold fronts. Figure 10 of the Perseus cluster (Fabian et al. 2000) is an example of bubbles produced in regions where there is strong radio emission. Figure 12 is a spectacular recent example of giant cavities and shock fronts in an optically poor cluster, MS0735.6+7421, studied by McNamara et al. (2005). Radio lobes fill the X-ray faint cavities indicating that the hot gas is displaced and compressed by the expanding radio source. These authors find that the work required to inflate the cavity against the surrounding pressure is about ergs! Further consequences of this observation include the suggestion that the event was powered by accretion onto a central supermassive black hole. If so, the amount of material accreted in the last years was about solar masses, about one third the total mass of the central black hole.
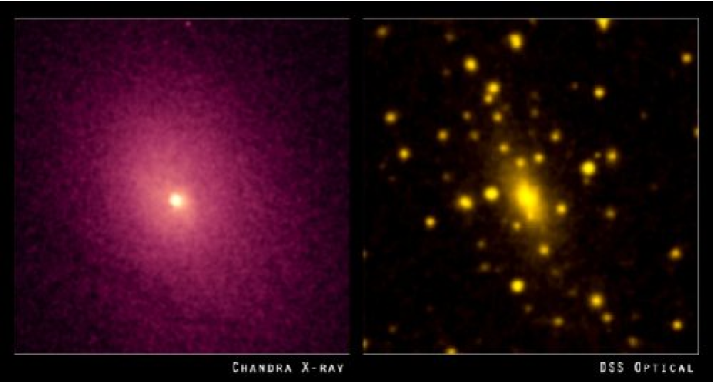
Some clusters, such as Abell 2029 shown in Figure 11, do exhibit a smoother relaxed structure. Measurements of the temperature and density profiles of the gas, inwards toward the central, dominant galaxy, provides a map of the gravitational potential, and hence the location of the dark matter in the cluster. The observers, Lewis, Buote, and Stocke (2003), showed that the dark matter density increased toward the center in a manner consistent with cold dark matter models.
No discussion of data taken with the Observatory is complete without a mention of the deep surveys. This work is an outgrowth of the study of the diffuse X-ray background, the nature of which had been a puzzle for decades, although the lack of distortion of the spectrum of the Cosmic Microwave Background placed a strong upper limit to the possibility of a diffuse component (Mather et al. 1990). Observations with ROSAT at energies below 2 keV made a major step in resolving a significant fraction (70-80%) into discrete objects (Hasinger et al. 1998). Currently two long exposures have been accomplished - the Chandra Deep Field North (e.g. Alexander et al. 2003) with 2-Ms of exposure, and the Chandra deep field south (e.g. Giacconi et al. 2001) with 1-Msec. These surveys have extended the study of the background to flux levels more than an order of magnitude fainter in the 0.5-2.0 keV band and have resolved over 90% of the background into a variety of discrete sources.
Finally, we note Chandra’s contributions to the study of dark energy. Studying the gas mass fraction in clusters of galaxies such as A2029, and assuming that this fraction is independent of redshift, Allen et al. (2004) detected the effects of dark energy on the distances to clusters of galaxies, independent of, but in confirmation of, previous such studies using Type 1a supernovae.
3. Conclusions and Acknowledgments
Designed for a minimum of three years of operation, the Chandra X-ray Observatory has now been operating successfully for more than five years. The number of new discoveries has been legion and the Observatory has more than lived up to its promise.
This paper is in part a synopsis of a review paper ”An Overview of the Performance of the Chandra X-Ray Observatory” that appeared in Experimental Astronomy, volume 16, pages 1-68 in 2003 by myself, T. Aldcroft, M. Bautz, R. Cameron, D. Dewey, J. Drake, C. Grant, H. Marshall, and S. Murray. I am indebted to my co-authors’ contributions to that paper. I also acknowledge the major contributions to the success of the Observatory by the scientists and engineers associated with the instrument teams, the NASA Project at MSFC, the many contractors, and the CXC, with special thanks to its Director, Dr. H. Tananbaum. Finally, I wish to acknowledge the tremendous contributions of Leon Van Speybroeck to the Chandra Project.
References
Acton, L. W., Bruner, M. E., Brown, W. A., Fawcett, B. C., Schweizer, W., & Speer, R. J. 1985, ApJ, 291, 865
Alexander, D. M., Bauer, F. E., Brandt, W. N., Hornschemeier, A. E., Vignali, C., Garmire, G. P., Schneider, D. P., Chartas, G., & Gallagher, S. C. 2003, AJ, 125, 383
Allen, S. W., Schmidt, R. W., Ebeling, H., Fabian, A. C.& van Speybroeck, L. 2004, MNRAS, 353, 457
Baganoff, F.K., Maeda, Y., Morris, M., Bautz, M.W., Brandt, W.N., Cui, W., Doty, J.P., Feigelson, E.D., Garmire, G P., Pravdo, S.H., Ricker, G.R.,& Townsley, L.K. 2003, ApJ, 591, 891
Bautz, M. W., Pivovaroff, M., Baganoff, F., Isobe, T., Jones, S. E., Kissel, S. E., LaMarr, B., Manning, H. L., Prigozhin, G. Y., Ricker, G. R., Nousek, J. A., Grant, C. E., Nishikida, K., Scholze, F., Thornagel, R., & Ulm, G. 1998, SPIE, 3444, 210
Behring, W. E., Cohen, L., & Feldman, U. 1972, ApJ, 175, 493
Brinkman, A. C. et al. 1997, SPIE, 3113, 181
Brinkman, A.C., Kaastra, J. S., van der Meer, R.L.J., Kinkhabwala, A., Behar, E., Paerels, F., Kahn, S.M. & Sako, M. 2002, A&A, 396, 761
Braje, T.M. & Romani, R.W. 2002, ApJ, 580, 1043
Burwitz, V., Zavlin, V. E., Neuhäuser, R., Predehl, P., Trümper, J., & Brinkman, A. C. 2001, A&A, 379, L35
Dennerl, K. 2002, A&A, 394, 1119.
Dewey, D., Drake, J. J., Edgar, R. J., Michaud, K., & Ratzlaff, P. 1998, SPIE, 3444, 48
Drake, J. J. et al. 2002, ApJ, 572, 996
Drake, J.J., Laming, J.M., Raffauf, E., Kashyap, V. 2005, in preparation
Fabian, A.C., Sanders, J.S., Ettori, S., Taylor, G.B., Allen, S.W., Crawford, C.S., Iwasawa, K., Johnstone, R.M., & Ogle, P.M. 2000, MNRAS, 318, L65.
Fabian, A.C. 2002, ”Cooling Flows in Clusters of Galaxies” in ”Lighthouses of the Universe: The Most Luminous Celestial Objects and Their Use for Cosmology”, Proceedings of the MPA/ESO/, 24.
Freeman, F. F. & Jones, B. B. 1970, Solar Phys., 15, 288
Giacconi, R., Rosati, P., Tozzi, P., Nonino, M., Hasinger, G., Norman, C., Bergeron, J., Borgani, S., Gilli, R., Gilmozzi, R., & Zheng, W. 2001, ApJ, 551, 642
Gladstone, R. et al. 2002, Nature, 415, 1000
Grindlay, J. E., Heinke, C., Edmonds, P. D., & Murray, S. S. 2001, Science, 290, 2292
Hasinger, G. et al. 1998, A&A, 329, 482.
Hester, J. et al. 2002, ApJ, 577, L49
Hwang, C-Y, & Bowyer, S. 1997, ApJ, 475, 552
Kaastra, J.S., Mewe, R., Liedahl, D.A., Komossa, S., & Brinkman, A.C. 2000, Astronomy and Astrophysics, 354, L83.
Komossa, S., Burwitz, V., Hasinger, G., Predehl, P., Kaastra, J. S., & Ikebe, Y. 2003, The Astrophysical Journal, 582, pp. L15-L19.
Lepson, J. K., Beiersdorfer, P., Behar, E., & Kahn, S. M. 2003, ApJ, 590, 604
Lewis, A.D., Buote, D.A., & Stocke J.T. 2003, Astrophysical Journal, 586, pp. 135-142.
Manson, J. E. 1972, Solar Phys., 27, 107
Marshall, H.L., Miller, B.P., Davis, D.S., Perlman, E.S., Wise, M., Canizares, C.R., & Harris, D.E. 2002, The Astrophysical Journal, 564, pp. 683-687.22
Marshall, H. L., Dewey, D., and Ishibashi, K., 2004, SPIE, bf 5165, 457
Mather, J. C. et al. 1990, The Astrophysical Journal, 354, L4.
McNamara, B.R., Nulsen, P.E.J., Wise, M.W., Rafferty, D.A., Carilli, C., Sarazin, C.L., & Blanton, E.L. 2005, Nature, 433, 35
Mori, K. & Ruderman, M.A. 2003, ApJ, 592 L75
Murray, S. S., Austin, G.K., Chappell, J. H., Gomes, J. J., Kenter, A. T., Kraft, R. P., Meehan, G. R., Zombeck, M. V., Fraser, G. W., & Serio, S. 2000, SPIE,4012, 68
Pavlov, G. G., Teter, M. A., Kargaltsev, O., & Sanwal, D. 2003, The Astrophysical Journal, 591, 1157
Perlman, E. S. et al. 2001, The Astrophysical Journal, 561, pp. L51-L54.
Predehl, P. et al. 1997, SPIE, 3113, 172
Prigozhin, G., Kissel, S., Bautz, M., Grant, C., LaMarr, B., Foster, R., & Ricker, G. 2000, SPIE, 4140, 123
Raassen, A. J. J. et al. 2002, A&A, 389, 228
Raassen, A. J. J., Ness, J.-U., Mewe, R., van der Meer, R. L. J., Burwitz, V., & Kaastra, J. S. 2003, A&A, 400, 671
Schweizer, W. & Schmidtke, G. 1971, ApJ, 169, L27
Tennant, A. F., Becker, W., Juda, M., Elsner, R. F., Kolodziejczak, J. J., Murray, S. S., O’Dell, S. L., Paerels, F., Swartz, D. A., Shibazaki, N., & Weisskopf, M. C. 2001 , ApJ,554, 173
Townsley, L. K., Broos, P. S., Nousek, J. A., & Garmire, G. P. 2002, NIM-A, 486, 716
Trümper, J.E., Burwitz, V., Haberl, F., & Zavlin, V.E. 2003, in ”The Restless High-Energy Universe” The proceedings of the symposium dedicated to six years of successful BeppoSax operations, Amsterdam, May 5-8, 2003.
Turolla, R., Zane, S., Drake, J.J. 2004, ApJ, 603, 265
Walter, F. M., Wolk, S. J., & Neuhaüser, R. 1996, Nature, 379, 233
Weisskopf, M. C., Hester, J. J., Tennant, A. F., Elsner, R. F., Schulz, N. S., Marshall, H. L., Karovska, M., Nichols, J. S., Swartz, D. A., Kolodziejczak, J. J., & O’Dell, S. L. 2000, ApJ, 536, L81
Widing, K. G. & Sandlin, G. D. 1968, ApJ, 152, 545