Evidence for Companion-Induced Secular Changes in the Turbulent Disk of a Be Star in the LMC MACHO Database
Abstract
The light curve of a blue variable in the MACHO LMC database (FTS ID 78.5979.72) appeared nearly unvarying for about 4 years (the quasi-flat segment) but then rapidly changed to become periodic with noisy minima for the remaining 4 years (the periodic segment); there are no antecedent indications of a gradual approach to this change. Lomb Periodogram analyses indicate the presence of two distinct periods of days and 8 days in both the quasi-flat and the periodic segments. Minima of the periodic segment cover at least 50% of the orbital period and contain spikes of light with the 8-day period; maxima do not show this short period. The system typically shows maxima to be redder than minima. The most recent OGLE-III light curve shows only a 30-day periodicity. The variable’s and magnitudes and color are those of a Be star, and recent sets of near infrared spectra four days apart, secured during the time of the OGLE-III data, show H emission near and at a maximum, confirming its Be star characteristics.
The model that best fits the photometric behavior consists of a thin ring-like circumstellar disk of low mass with four obscuring sectors orbiting the central B star in unison at the 61-day period. The central star peers through the three equi-spaced separations between the four sectors producing the 8-day period. These sectors could be dusty vortices comprised of particles larger than typical interstellar dust grains that dim but selectively scatter the central star’s light, while the remainder of the disk contains hydrogen in emission making maxima appear redder.
A companion star of lower mass in an inclined and highly eccentric orbit produces an impulsive perturbation near its periastron to change the disk’s orientation, changing eclipses from partial to complete within days. The most recent change to a 30 day period observed in the OGLE-III data may be caused by obscuring sectors that have coalesced into larger ones and spread out along the disk.
1 Introduction
The MACHO111http://www.macho.mcmaster.ca/ database contains nearly continuous photometric coverage of variable stars over an 8-year time span (Cook et al., 1995). The LMC variable star FTS (Field, Tile, Sequence) ID 78.5979.72 in the MACHO database is located at (, , J2000)=(5h 17m 27.958s, ). We used transformations from MACHO instrumental magnitudes to standard Kron-Cousins and magnitudes given by K. Cook :
| (1) |
The variable has a mean apparent blue magnitude of 15.877 mag, a mean apparent red magnitude of 15.839 mag, and a mean color of 0.038 mag. Note that these mean apparent magnitudes differ from those in Keller et al. (2002) and from the calibrated magnitudes in the plots from the MACHO website since we used the transformations given by Eq. (1). For the LMC, these apparent magnitudes and color are those of a star slightly to the right of the main sequence where Be stars reside. Assuming a distance modulus for the LMC of 18.5 (Benedict et al., 2002), and (uncorrected for reddening); these are consistent with a B2-B3 star (, , , Lyubimkov et al. (2002)).
The OGLE-II 222http://sirius.astrouw.edu.pl/{̃}ogle/ ID is 051728.14-693431.7, its mean band magnitude (DIA photometry, (Udalski, Kubiak & Szymanski, 1997; Zebruń et al., 2001)), and the time span of the light curve overlaps the last half of the MACHO data, with day extension past its end, with gaps in coverage. Observations in the and bands are much sparser over that same time span with mean magnitudes and (DoPHOT photometry). The GSC Catalog 2.2 ID is S013203120987; band and band magnitudes are 16.07 and 15.73 respectively (at approximately JD 2450364, which is just past the middle of the MACHO data, at a maximum). In the 2MASS survey it is less resolved than the OGLE image, and is among the fainter images on the , , and band images. We estimate an upper limit 2MASS band magnitude to be 16 and band magnitude to be even fainter from the available images; its image is indistinguishable from noise in the band. The object is listed in neither the 2MASS nor DENIS catalogs.
The object is present in the AGAPEROS survey fields (i.e., the EROS 1 CCD dataset of 1991, (Melchior, Hughes & Guibert, 2000)) of red variables in the LMC bar (in the field of variables AGPRS051723.55-693420.6 and AGPRS051733.23-693420.2) but is not cataloged as a variable star, presumably because it was too blue and its amplitude too small at this time and so did not meet the selection criterion for variability. The object is present on both and prints, at and mag respectively (estimated from a comparison with cataloged variables nearby), of the Hodge-Wright Atlas of the LMC (Hodge & Wright, 1967). It is not cataloged as a variable star, presumably because its amplitude was too small at this time and so did not meet the selection criterion for variability. With an epoch of 1968 of the original plates, we estimate an upper limit to its proper motion of arcsec yr-1.
The object has been classified as a blue variable in the LMC MACHO database and is assigned a variability ”mode” of 1, characterized as a ”bumper” variable. The majority of MACHO blue variables are typically reddest at maximum, and, for those examined spectroscopically (about 8% of the sample), 91% exhibit variable Balmer emission characteristic of Be stars; the emission occurs at or near maxima of the light curves (Keller et al., 2002), typical of Be stars (Dachs, Engels & Kiehling, 1988), including those in the LMC and SMC (Grebel, 1997; Keller, Wood & Bessel, 1998).
2 Light Curves, Lomb Periodogram Analysis, and Near-IR Spectra
Figure 1 shows the variable’s MACHO light curve for a continuous time span of about 7.4 years (save for a 60-day interval between November 1993 and January 1994, due to telescope problems) derived from the MACHO database. The MACHO instrumental photometry has been calibrated to the standard Kron-Cousins system (K. Cook, private communication).
The light curve exhibits several features, which, so far, are unique among LMC variables, particularly among its ”bumper” variables, and galactic variables as well.
We discuss several features of the light curves in turn.
-
1.
For approximately the first half of the time span there is no obvious periodic variability, while for the remaining half there is a periodic variability suggestive of an eclipsing phenomenon; we will refer to these as the quasi-flat segments and periodic segments respectively; Fig. 2 shows the light curves for each of these segments separately. Errors in are the quadrature sum of errors in and .
Ironically, because planning strategies for some MACHO fields changed about midway, the quasi-flat segment has about 950 observations per filter (about one per 1.5 nights) while for most of the periodic segment only about half as many were secured. The AGAPEROS data of 1991 overlaps a small portion the quasi-flat MACHO segment, and OGLE II data covers only the periodic segment and none of the quasi-flat segment.
The MACHO and total light curves, and the quasi-flat and periodic segments of the light curve, were separately subjected to a power spectrum analysis using the Lomb Periodogram technique, which is ideal for unevenly sampled data; notably, it is insensitive to gaps, periodic or random, in data (Press, Flannery, Teukolsky & Vetterling, 1992). Table 1 lists the most significant periods in the power spectrum (i.e. those with the largest amplitudes) for the total light curve, the quasi-flat segment, and the periodic segment. Uncertainties in these periods were estimated from the weighted dispersion of the derived frequencies in the power spectrum (Rice 2004, private communication). Two consistent significant periods of about 61 days and 8 days appeared in all of the data, except in the quasi-flat segment of the light curve where only the 8-day period was significant. As expected, the power spectra also show significant periods related to observational cycles of 0.5 and 1 day, and those related to the total observational time span (and some sub-multiples of it).
The OGLE II ,, and band data for the variable, which cover much of the same time span as the periodic segment of the MACHO data, were subjected to a Lomb Periodogram analysis; the results are also listed in Table 1. The only significant mean period in the band light curves (separately for DIA and DoPHOT photometry), is consistent with the 61-day period found in the MACHO data. For both the OGLE and band light curves no significant periods were present. The object is not included in the OGLE catalog of eclipsing binaries in the LMC (Wyrzykowski et al., 2003) presumably because of its peculiar light curve (i.e., it is not ”clean”) due to the superposition of the two periods. The total temporal coverage between MACHO and OGLE data is 11.8 years and the object is still monitored by the OGLE team (Udalski 2004, private communication).
-
2.
The quasi-flat segment MACHO magnitude increases linearly at about 0.01 mag yr-1 while the magnitude increases linearly at about 0.005 mag yr-1, i.e., the system becomes secularly redder (= 0.013 mag yr-1, cf. Fig. 2) as it brightens in the quasi-flat segments.
-
3.
The envelopes of the maxima of the periodic segments are not constant, but become slightly fainter by mag at the onset of the variability in both and ; data sampling is unlikely to have caused this behavior in the MACHO data. The envelope of the maxima of the OGLE II band light curve is also not constant, showing the same peaks as the MACHO data. The light curve of the periodic segment shows that the object is redder at maxima and bluer at minima; the scatter of points with just past the middle of the data (JD 2451000), which begins about 850 days after the onset of complete eclipses and lasts for some 200 days, are associated with deeper minima over this interval.
-
4.
The envelopes of the minima of the MACHO periodic segments also are not constant; data sampling is unlikely to have caused this behavior in the MACHO data; by comparison, the envelope of the minima of the OGLE II band light curve is fairly flat.
-
5.
The onset of the periodic segment approximately midway in the total time span, described as a 0.6 mag drop in and a 0.45 mag drop in (0.15 mag, cf. Fig. 2), simply just begins without antecedent indications of a gradual approach, as illustrated in Fig. 3 for the light curve, which is a wider time resolution of this rapid transitional onset and, for clarity, the sequential data points are connected with straight lines. This initial magnitude drop occurs over 10.0 days.
-
6.
The minima of the periodic segment contain three, and occasionally four, spikes of light of short duration (a few days) that appear periodic when viewed at the wider time resolution of Fig. 3, and they appear to be symmetrically placed within the minima; the spikes generally do not become as bright as the quasi-flat segments or the maxima of the periodic segments, although there are occasional very bright spikes of light in the minima, such as that at JD 2451245. These light spikes are associated with the 8-day periodicity.
-
7.
The width of the observed minima of the MACHO light curve, estimated at half depth, widens as time progresses, from about 30-35 days at the beginning (cycles 1-5) to about 40-49 days around JD 2451080 (cycle 15), some 2.5 years later. The overlapping OGLE-II data show the same trend, but after JD 2451140 (cycle 16) the width of minima begin to shorten again to about 28-38 days.
-
8.
The most recent band OGLE-III data (Udalski, 2003) shows another secular change has occurred in the light curve of the object in the 1.2-year interval between end of the OGLE-II data (JD 2451690) and beginning of the OGLE-III data (JD 2452123). Coverage is sparser (between 1 and 18 nights per observation; average is about one observation per 5 nights) and the behavior is different from previous MACHO and OGLE-II data: maxima and minima appear shorter in duration, and without any evidence of short spikes of light (which are only a few days long) present in the periodic segment of the MACHO data. Lomb Periodogram analysis was applied to this data and the results are also listed in Table 1: the only significant period was one of about 30.4 days, consistent with half the 61-day period within the uncertainties. It is unlikely that this short period is caused by sparser data coverage.
The object’s non-variability in the Hodge-Wright study of 1967 indicates its amplitude was 0.1 mag at this time, and so is consistent with the small amplitude during the quasi-flat segments of the MACHO light curves. This suggests either that the quasi-flat segment extends back this far back in time, or that it was imaged during a previous quasi-flat segment. We have not found any images of the object in the interim between 1967 and 1991 (AGAPEROS survey) to assess this latter possibility. The 2MASS images were taken at a maximum in the periodic segment.
Figure 4 illustrates the MACHO color vs. magnitude for the two light curve segments separately. Despite the presence of outlying points, this plot clearly shows that maxima are 0.1 mag redder than minima in both segments of the light curve.


Five low resolution near infrared333Some authors prefer the term “far red” for wavelengths between 0.7m and 1.0m. spectra of the variable were secured with the Cassegrain spectrograph of the CTIO 1.5-meter telescope on two nights: three on Nov. 7, 2003 (JD 2452950.80) which are very noisy, and two on Nov. 11, 2003 (JD 2452954.76) which are much less noisy. Figure 5 shows the reduced spectrum for the second night.

The spectra appear to be those of a B2/3V/IVe star, with H emission of equivalent width of about 10 A at both times; they are comparable to those in the low resolution near infrared spectra in Mennickent & Sterken (1997), and with the higher resolution spectra of Andrillat, Jaschek & Jaschek (1988).
Consistent with expected behavior of this sample of blue variables, the H emission lines appear when the variable ascended toward a maximum on the first night and at that maximum on the second of the recent OGLE-III light curves. The radial velocity of the H line is km s -1 on the first night and km s-1 on the second, and that of the Fe II emission line , the only other obvious emission, is 29020 km s-1 on both nights.444The presence of Fe II without O I also in emission, as in our variable, is rare in some Be star samples (Andrillat, Jaschek & Jaschek, 1988), but there are exceptions, eg. o Cas (HD 4180), a B5IVe star (Andrillat, Jaschek & Jaschek, 1988), and Mon (Polidan & Peters, 1976), a B3Ve star. All radial velocities are consistent with membership in the LMC. Uncertainties in the radial velocities on the two nights are too large to draw any firm conclusions regarding variations between them. There are no clearly detectable stellar absorption lines.
Since the variable’s absolute magnitude, color, and spectra are all consistent with an early Be star, interstellar reddening along its line of sight appears to be low.
3 Phase Diagrams
Phase diagrams of the MACHO data were constructed with period of 61.295 days for both the and quasi-flat segments (even though this period was found only for the data), and with a period of 61.462 days for the periodic segments in both filters. The phased light curve is shown in Fig. 6 for both segments. The phase diagrams exhibit several distinctive features:

-
1.
In the periodic segments the minima occupy % of the phase diagrams in both and , while the maxima occupy only about 30%; the shoulders of the minima occupy the remaining fraction and are not well defined. Such a large and ill-determined fraction can be caused by a variable widening of the minimum and consequent narrowing of the maximum, as well as changing location of the center of the minima, but no periodicities are associated with these possibilities. The phase diagram for in the quasi-flat segment appears constant in color over the entire time span, while the minima of the periodic segment are bluer in the mean than the maxima by mag.
-
2.
In the periodic segments, the approximately flat-bottomed minima are randomly occupied with points partly arising from the incommensurability of the 8-day period with the 61-day period.
-
3.
In the quasi-flat segment, the phase diagram is expected to be noisy due to the secular brightening noted above, and from the incommensurability of the 8-day period with the 61-day period. The phase diagram appears to be effectively U-shaped, dropping by mag and is approximately 0.5 out of phase with respect to the minimum of the periodic segment. The phase diagram in is flat with a dispersion of about 0.05 mag.


A second set of phase diagrams for each segment of the and MACHO data was constructed using the periods of 8.014 days in the quasi-flat segment and 8.010 days in the periodic segment; Fig. 7 shows the behavior of the data. These phase diagrams exhibit a few distinctive features:
-
4.
In the quasi-flat segments the noisy spikes occupy about 30% of the phase (about 2.5 days long) and are asymmetric, having a shorter rise to maximum followed by a more gradual fall to minimum, which seems to be flat within the noise; the incommensurability of the 8-day and 61-day periods certainly contributes to the noisy appearance. The phase diagram shows this spike to be symmetric within the noise and bluer at maximum, contrary to the general behavior of the system to redden when brightening.
-
5.
In the periodic segments the spikes have a similar asymmetric shape discernibly occupying 30% of the phase, despite noise that fills in the minimum arising from the incommensurability of the two periods. The phase diagram is noisy with a non-random pattern and shows no clear correlation with either the or phase plots, save for a tightening of points after the spike.
The minima of both the quasi-flat and periodic segments thus behave similarly: the quasi-flat segment appears to be a lower amplitude version of the periodic segment. We note that they are reminiscent of the behavior of eclipsing binaries, where the former appears similar to partial eclipses, but with low amplitude spikes of light within it, while the latter appears similar to complete eclipses, with the same spikes of light, now of larger amplitude, within it.
The next periodogram analysis was applied only to the maxima of the periodic segments; for and (containing 165 data points) no significant period was present, which seems surprising. The absence of the 8-day period at the maxima thus means it is present only within the minima. This fact infers that a pulsating star cannot cause the 8-day periodicity, for its presence would be observed at maxima when both stars are visible. It is not a Cepheid because the system is both too faint and too blue. The period-luminosity relations derived for LMC Cepheids (Madore & Freedman, 1991) predicts and for an 8-day period; including the 0.25 mag scatter of the data in quadrature does not change this conclusion. The 0.2-0.4 mag amplitude of the imputed pulsation is larger than expected for typical main sequence stars, but is not unexpected for periodic photometric variations observed for Be stars (Kitchin, 1982).
This result suggests we apply a periodogram analysis to the minima of the periodic segments as well to see if a similar finding obtains. We applied the analysis for 16.144 and 16.142 (containing 195 data points); again, no significant period was present. Coupled with the result found in the previous paragraph, this result suggests that the strength of the 61-day period is produced not from the location of the minima or maxima but from the spikes with an 8-day period, i.e., the first, second and third spikes in the first minima are separated by about 61 days from the first, second and third spikes, respectively, in the second minimum, which are in turn separated by about 61-days the first, second and third spikes, respectively, in the third minimum, etc. Since the minima change width, the contribution of both ingress and egress times to this periodicity cannot be discerned. The approximate orbital synchronization of light spikes in the minima places limits their possible origin, and clearly eliminates the possibility of a pulsating star.
Since the same two periods are present in the quasi-flat segment, we infer that this segment is, again, just a lower amplitude version of the phenomenon observed in the periodic segment: the 8-day period arises from lower amplitude “spikes” of light within U-shaped partial minima, and the strength of the 61-day period arises from the light spikes via the same approximate orbital synchronization.
A third set of phase diagrams were constructed for the OGLE-II and OGLE-III band (hereafter referred to as ) and are shown in Fig. 8 (a) and (b) respectively. Both look much the same as Fig. 6 (b) for the MACHO periodic segment with a noisy minimum that extends % of phase, except that the latter uses only a 30.437 day period. The phase of the latter appears to be out of phase with the former.
4 Ansatz
The MACHO data for this system exhibits two significant periodicities, a long one of some 61 days and a shorter one of about 8 days. Orbital motion is one natural possibility responsible for the 61-day periodic variability of this object and is the basis for our models, which are at present largely phenomenological. A time scale of 4 years or longer is needed to account for the rapid transition from a quasi-flat to a periodic light curve.
One main ingredient in our models is a disk surrounding a Be star which produces variations in its light and color. Since Be stars do not follow the standard reddening line, the red colors of the Be stars are not due to absorption by circumstellar dust typical of interstellar dust (Keller, Wood & Bessel, 1998), and so is attributed to emission by ionized hydrogen gas in the disk. The light curve of the object indicates maxima are redder, contributed by H emission, while minima are bluer because of its absence, so we conclude that disk emission contributes to the total luminosity of the system. Disks have been detected interferometrically around seven Be stars; they range in size between 5-10 stellar radii, are relatively thin, are infrared emitters, and their inclinations agree with the projected rotational velocities of their central stars, i.e., they are equatorial structures (Quirrenbach et al., 1997). One kinematic feature of disks around Be stars is the observational deduction that they are in near-Keplerian rotation about them (Cassinelli et al., 2002); Lee, Saio & Osaki (1991) show that matter from the star’s equatorial surface can drift outward subsonically, producing a thin Keplerian disk; it is called the viscous decretion disk model. Disks are also likely to be responsible for modulating the observed luminosity of their parent star via variations in optical depth and irregularities in internal structure, such as spiral waves and warps (Balona, 2000; Baade, 2000). Such disks are generally though to be excretion disks generated by mass loss by one component and less likely an accretion disk produced by mass loss from a companion. Cassinelli et al. (2002) show that both the high density and angular momentum of disks around Be stars can arise from magnetic torquing. The question as to whether Be stars are pre- or post-main sequence objects, or a mixture of both, particularly in the LMC, is unresolved (Keller, Wood & Bessel, 1998).
A second ingredient in our models is a mechanism to account for the rapid change from a quasi-flat to a periodic light curve. Since the transition occurs over a single orbital period of about 10 days without any antecedent indications of a gradual approach, such as a progressive widening and deepening of eclipses, an impulsive change in orbital elements seems a more likely cause than a slow progressive one, such as might be caused by precession of a disk misaligned with a rapidly rotating, polar-flattened, central star. We propose that an additional perturbing object in an elliptical orbit of long period of several years acts as an impulsive force that induces the rapid change from partial to complete eclipses at a close periastron passage.
We first investigated the possibility that that system is an eclipsing binary. There are at least three galactic eclipsing binaries that have either ceased eclipsing (SS Lac, Milone, Stagg & Schiller (1992); Torres & Stefanik (2000)), changed eclipse patterns (AS Mus, Soderhjelm (1974)), or have turned on and off sequentially (V907 Sco, Sandberg-Lacy, Helt & Vaz (1999)). In none of the three cases are observations continuous through the cessation or restart of eclipses as with our object. Further, in all three of these cases a third star in a wider, more eccentric, non-coplanar orbit about the inner close binary is either invoked or observed to be present to account for changes in its orbital elements and eclipse patterns.
Assume the system is a non-eclipsing binary with a disk surrounding the primary star. A dynamical change (i.e., a precession) of either the orbital elements of the secondary, or in the disk surrounding the primary, or more likely a coupling of both, causes the rapid transition to an eclipsing system. The precession is caused by a third star with a much longer orbital period. The main difficulty with the eclipsing hypothesis is producing the % width of the minima. The simplest application of two-body mechanics shows the only way to produce minima lasting 50% of an orbital period is to require the primary companion’s surrounding disk to be hard-edged, and to have a radius equal to the orbiting companion’s circular orbit (i.e., at its periphery). Eclipses are observed when the disk’s line of nodes is orthogonal to the line of sight (i.e. they cannot be observed with a disk canted or edge-on). There is the additional question of the stability of such an imputed disk with a secondary star near its periphery. From the orbital period we attempted to model the variable’s light curve by assuming a disk with appropriately placed annular gaps through which the orbiting secondary peers as it passes behind the disk responsible for the long minima. This would account for the approximately symmetric placement of the 8-day spikes within the minima and the fact that they are approximately synchronized with the 61-day orbital period.
This first model, however, has several failures that may be attributed to the ideal character of the disk we assumed. First, there is no obvious geometric way to produce the 8-day period during the quasi-flat segments since the gaps are not visible. Second, the perturbation by the third star can produce dramatic changes in both the line of nodes and angle of periastron of the secondary companion’s orbit, which induce large changes in the light curve that are not observed. These additional variations led us to abandon further explorations of this model.
The second model to account for the light curve of the variable is simpler and more successful. It assumes, again, that a thin disk surrounds a B star, but with four obscuring sectors that orbit in unison with the 61-day period and are responsible for eclipses; equi-spaced gaps between the four obscuring sectors produce the 8-day period when the central star peers through them. Such a model has two advantages: first, it can easily produce minima exceeding 50% of the fraction of the orbital period by judicious choices of azimuthal sizes of the obscuring sectors, and second, variations in their location, width, height and optical depth can impart a “noisy” appearance to the minima. A second mass with a longer orbital period is required to perturb the disk such that its line of nodes and angle of periastron initially produce partial eclipses and then quickly produces complete eclipses.
Interestingly, there is a variable that exhibits behavior similar to our object. The recently discovered pre-main sequence solar-like star KH 15D showed a single minimum some 3.5 mag deep lasting about 40% of its phase in 2002, which has widened from about 30% since its discovery in 1995; the object is also bluer at minimum than at maximum (Herbst et al., 2002) like our variable. A second interesting parallel of our system with this young object is the presence of extra light in the minima, characterized as a central light reversal that initially reached the same or higher magnitude as the maxima, but has declined in brightness in time as the minimum has widened. Herbst et al. (2002) invoke the presence of a sharp-edged disk around a single star, or around the fainter companion of a binary, to account for both the single eclipse and the light reversal. High-resolution spectra by Hamilton et al. (2003) showed the system to be a weak-lined T-Tauri star surrounded by an accretion disk and possibly with a bipolar jet. Johnson et al. (2004) found the system was a single-lined spectroscopic binary with a period consistent with the photometric one. One detailed model is presented by Barge & Viton (2003), who posit a single, sharp-edged disk with a large-scale gaseous vortex (related to planet formation) that contains swarms of solid particles responsible for the deep eclipses. While this model can reproduce the mild central light reversal observed more recently, it cannot reproduce their initial brightness (Barge 2003, private communication). A third interesting parallel with our object was secured from archival Harvard plate data from the early to mid century. They indicate that the object showed no eclipses over this time span (Winn et al., 2003), although photometric data secured from Asiago Observatory plate material between 1967-1982 showed the system was 0.9 mag brighter with shallower eclipses which were out of phase with more recent ones (Johnson, Asher, & Winn, 2004). Winn et al. (2004) and Chiang & Murray-Clay (2004) modeled the system as a pre-main sequence binary eclipsed by a slowly moving opaque screen, suggested to be a precessing circumbinary disk or ring, which is quite different from our model for the MACHO variable. Typical of some T-Tauri stars, a filamentary emission nebulosity appears to be associated with the object (Tokunaga et al., 2004).
5 Model: Single Star Eclipsed by a Disk with Obscuring Sectors
Our more successful model explaining the light curve of the variable is simpler than that assuming it is an eclipsing binary. It posits a single B star surrounded by a thin gas disk with at least four obscuring sectors orbiting in unison at the 61-day period, which implies they are located at - AU from the central star. These sectors are geometrically portions of a ring; they are all equal in angular size and the gaps between each have the same angular width. The azimuthal location, width, height and optical depth of the sectors govern the 8-day period and the appearance of the central star as it sequentially peers between each of them, producing spikes within the minima; they must be fairly sharp-edged in order to produce relatively steep shape of the spikes which last 1-2 days. These obscuring sectors could be comprised of larger particles that dim but selectively scatter little of the central star’s light. Physically they could be dusty vortices such as that proposed for the deep minima of KH 15D. The formation of dust-trapping vortices has been simulated in 3-dimensional models of protoplanetary disks, and may be the sites of planetesimal formation (Johansen, Andersen & Brandenburg, 2004). The remainder of the disk contains ionized hydrogen responsible for H emission and reddening of the maxima.
A companion star will truncate the disk around its primary (and vice versa) by gravitational interaction over time. Simulations by Artymowicz & Lebow (1994) of the tidal/resonant truncation of circumstellar disks which are coplanar with the eccentric orbit of their parent stars indicate that truncation radii are smaller than for binaries in circular orbits because tidal forces are larger at periastron in an elliptical orbit than in a circular orbit of identical semi-major axis . For a reduced mass of 0.5 and eccentricity of 0.7 their simulations indicate truncation radii are , depending on disk viscosity. Simulations of companions on orbits non-coplanar with a primary’s disk truncate it similarly (Larwood et. al, 1996). For our model the reduced mass is 0.36 and AU, so the truncation radius is AU. This suggests that while the obscuring sectors in the disk are located at a radius of AU, the periphery of the gaseous disk could extend to the truncation radius so that the obscuring sectors would not be at the disk’s periphery; we have no observational constraints on the disk’s extent. Given a disk radius of about 1 AU seen nearly edge-on, the expected maximum velocity width can be estimated from km s-1, corresponding to a spectral line width of Å, which is comparable to the equivalent width of the observed line. The general noisiness of the observations, which we attribute to turbulence in the disk, is not modeled.
While there is no obvious cause for the asymmetric location of the four obscuring sectors on half of the disk, we state simply that this circumstance is needed for our kinematic model over the span of the MACHO and early OGLE data. Since more recent OGLE data indicate the system still shows eclipses, but with a period of only 30 days, then if obscuring sectors do produce eclipses of the central star, their location and/or characteristics have changed. Disks around nearby Herbig Ae/Be stars imaged in near- and mid-infrared and submillimeter bands (Vega, Pictoris, Formalhaut, HR 4796A, and HD 141569) show asymmetric appearances, and some variability, attributed to clumps, possibly caused by perturbing effects of planets (Wyatt et al., 1999; Ozernoy et al., 2000; Mouillet et al., 2001; Holland et al., 2003, cf.). Several theoretical studies (Barge & Sommeria, 1995; Johansen, Andersen & Brandenburg, 2004, and references therein) find that large particles within vortices may lead to clumping and planetesimal formation.
These systems with hotter central stars have some closer similarities to our variable than KH 15D. The extended/asymmetric feature in the disk of HD 141596, a Herbig B9.5Ve star with molecular CO and H emission, has been modeled as a particle-accreting anticyclonic vortex, which could be the progenitor of a gas giant planet. de la Fuente Marcos & de la Fuente Marcos (2003) argue that such vortices are more effective at capturing solid material than equivalent structures around solar like stars, such as KH 15D, making them components of protoplanetary disks. The star appears to be a member of a triple system with M2 and M4 companions (Weinberger et al., 2000), although they would have little or no effect on the imputed vortex in the primary star’s disk (de la Fuente Marcos & de la Fuente Marcos, 2003); however Augereau & Papaloizou (2004) show that a companion in a highly eccentric orbit can account for the disk’s structure.
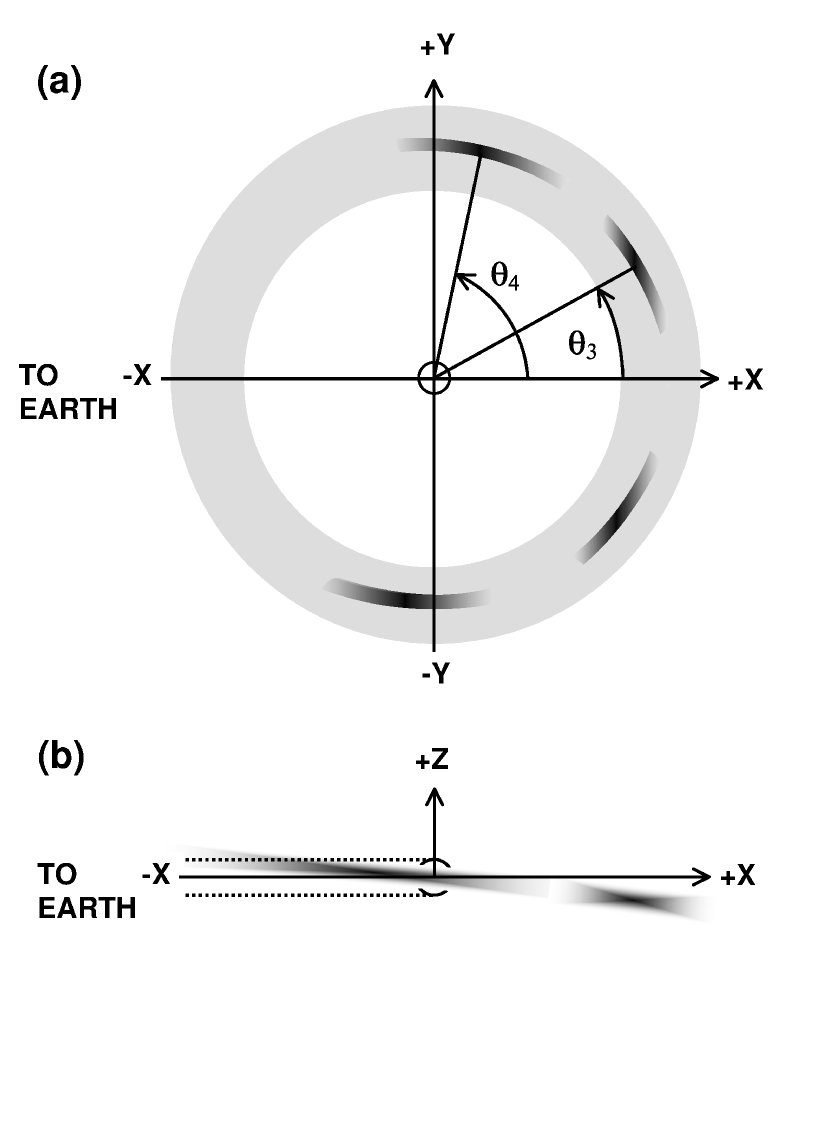
We establish a coordinate system centered on the B star. The x-axis lies along the line of sight with the positive direction away from earth, the y-axis is in the plane of the sky normal to the x-axis, and the z-axis is normal the xy-plane. The azimuthal variable is in the disk plane, measured from the +x-axis. The disk surrounding the B star is tilted with respect to the xy-plane with the line of nodes adjusted to that the central star is initially unobscured by the disk. We represent the optical depth of each of the four obscuring sectors as a sum of four compound exponential power laws representing the optical depth variation in the plane of the disk and perpendicular to it, plus a fifth term representing the optical depth variation of the entire interior of the disk including the gaps between the obscuring sectors, which depends only on the direction normal to the disk plane:
| (2) |
where:
-
are coefficients determining the magnitude of the optical depth for each obscuring sector, and is a constant that is present in the light curve throughout the entire cycle, i.e., it describes the magnitude of the optical depth of the non-obscured gaseous part of the disk, and are coefficients determining the magnitude of the optical depth 180∘ out of phase with respect to the center of the dark sectors, and account for the variation in the quasi-flat segment;
-
are distances normal to the disk plane, and is the normal distance from the central disk plane to an elemental area on the star;
-
is the axis scale height of the entire disk normal to the plane;
-
, are powers of exponential power laws, perpendicular to, and in the plane of the disk, respectively;
-
are the angular separations between the line of sight and the center of each obscuring sector in the disk plane measured from the +x-axis;
-
are azimuthal angular scale factors of each obscuring sector along the disk plane centered at ;
-
is the initial position of the maximum of the density enhancement in the gaseous part of the disk (corresponding to the quasi-flat segment).
Models of disks around B stars that are contiguous with their equatorial surface show that they become isothermal, with midplane temperatures between within stellar radii (Millar & Marlborough, 1999) precluding the formation of grains. Some models of Be stars invoke a gap between the star’s surface and the disk (Kitchin, 1982; Eisner et al., 2004), so we propose that the disk of our star does not extend to the star’s surface, but has a gap of indeterminate width, since our formulation does not depend on any parameter related to its width. Its appearance would be described as a wide ring such as modeled by de la Fuente Marcos & de la Fuente Marcos (2003).
The radial location of dust within a disk is governed by the standard dust sublimation radius of a star, , which is used to estimate the inner radius in a disk where dust will survive at temperature for a star of radius and temperature (Monnier & Millan-Gabet, 2002):
| (3) |
where is the ratio of the dust absorption efficiencies of the incident and reemitted radiation field, i.e., . Each is the dust absorption efficiency for a given grain size and radiation field of color temperature . varies between for large grains (as found for young stellar objects, YSOs) and for small grains (Monnier & Millan-Gabet, 2002). Assuming for silicate dust near sublimation, , and and of the central B3 star given in 1, yields , larger than estimated from the period above.
While Eq. (3) does not account for the presence of dust as close as to the central hot star as needed for our modeling of the light curve, we remark that Monnier & Millan-Gabet (2002) noted a similar inconsistency for YSOs. They find that some YSOs with significant UV luminosity have inner disk radii, measured via infrared interferometry, that are smaller than their computed inner radii using Eq. (3), assuming silicate dust of size, or grey dust, at . They suggest a partial resolution of this discrepancy can be achieved if low-density gas present in the gap between star and disk scatters UV radiation, shielding dust in the disk from destruction and so permit it to survive closer to the parent star. Their admittedly simple evaluation of this mechanism shows it is most effective for hotter stars but does not explain the inconsistency for some stars with luminosity (see their Figure 3). Dullemond, Dominik, & Natta (2001) and Dullemond et al. (2003) have modeled an alternative structural feature of a disk: its inner rim can become inflated, so shadowing its outer parts and permitting dust to survive. For the parameters of our star this self-shadowing model shows that dust will not survive inside about so it does not overcome the inconsistency in our model. Assuming no flaring geometry of the outer disk, this model has the advantage of low infrared emission, as observed for our object.
Figure 9 illustrates some of the disk parameters for our model.
At a given time, the radiant flux is determined by numerically integrating the flux emitted by a unit area in the line of sight over the star’s surface, i.e.:
| (4) |
where is the radiant flux per unit area over the filter pass band, and is a unit area on the star’s surface; the star is assumed to radiate as a black body. Table 2 lists the parameters of the central star and its surrounding disk that produced the best fit to the MACHO and OGLE-II photometric data.
This model has the advantage that the length of minima can be any value simply by adjusting the azimuthal widths of the obscuring sectors. It can also more easily account for the noisiness of the minima: the variation in the location, amplitude and width of the light spikes can be adjusted by varying the width, height and optical depth parameters of the obscuring sectors. The asymmetric shape of the light spikes in the minima (cf., 4 in section 3) could be caused by asymmetries in the optical depths of the leading and trailing edges of the adjacent obscuring sectors (although we do not model this feature). We have assumed ideal obscuring sectors that do not vary spatially or temporally in azimuthal location or width, height, or optical depth. This model also assumes that approximately half of the disk has no obscuring sectors but still can slightly dim the central star, and contributes red light from its H emission. We assume a smaller optical depth for the rest of the disk containing the obscuring sectors via the coefficient in Eq. (2).
We model the cause of the rapid change from partial to complete eclipses as perturbations by a second object in a long period elliptical orbit that is highly inclined with respect to the disk. Orbital elements that are much different from these, eg. short period, and/or circular, and/or coplanar with the disk, will not produce the rapid change required. Perturbations in the Keplerian orbital elements of the obscuring sectors due to an impulsive acceleration as given by the Gaussian perturbation equations (Brouwer & Clemence, 1961; Danby, 1962) were integrated via a third-order Runge-Kutta routine.
The circumstellar disk is inclined with respect to the xy-plane. The line of nodes was adjusted at to the line of sight so that initially no light variations would occur. The second, perturbing mass was assumed to have a very long period and a large orbital eccentricity. The major effect of this arrangement was a rapid rotation of the disk’s line of nodes to a direction close to the line of sight, which enabled the sectors to obscure the B star and initiate the light variations of about 0.5 mag. The angular size of each sector, as seen by the B star, and their azimuthal locations were chosen to fit the width of first deep minimum at JD 50200 days (the Julian Date is given with 2,400,000 subtracted out in all subsequent discussions and figures).
Starting with an initial inclination, eccentricity and period, a large number of trials were carried out with different perturbing masses. The initial argument of periastron, , was always set to zero. For each trial, the longitude of the ascending node, , was adjusted to have the deep minima begin to close to the observed times. If the results were deemed not good enough, then the inclination was changed and the calculations repeated, for eccentricities ranging from 0.5 to 0.8 and then for periods ranging between 1500 and 3000 days. While a large number of trials were attempted, a definitive solution was not found. The mass of the perturbing body was adjusted to produce a rate of change of such that minor light variations occurred for a four-year span and then deeper minima ensued for the following four-year span; Table 2 gives the orbital parameters for the perturbing mass that best fit the photometric data. The best results were achieved with a mass of 3 M⊙; a main sequence star of this mass contributes only a few percent to the total luminosity of the system. Using a larger perturbing mass produced a slower turn-on of the periodic segment, which disagrees with the observations. A minimum inclination of , i.e., retrograde motion with respect to the disk, is needed to produce a rapid change from partial to complete eclipses caused by precession of the disk’s line of nodes. Figure 10 shows the time evolution of the disk’s line of nodes over this time period due to perturbation by this companion.
The Gaussian perturbation equation for a test particle orbiting the central star of mass , having semi-major axis , eccentricity , inclination , distance , and mean motion , can be used to analytically estimate the precession rate of induced by a perturbing mass (Danby, 1962):
| (5) |
where is the perturbing acceleration due to normal to the disk’s orbit, taken to be , and is its distance at periastron; is the test particle’s true anomaly, and is a combination of sines and cosines of the angles between the orbits of the test particle and , and is . Eqn. (5) yields a maximum instantaneous nodal precession -rate of deg day-1, roughly consistent with our kinematic model results of deg day-1, given the approximate values of the parameters used.

We have treated the obscuring sectors as rigid portions of a ring, and the variation of other orbital elements give a variable rate of change of as Fig. 10 shows; the mean rate of change agrees with the formulation in Larwood (1998). However, the gaseous disk precesses at a much slower rate than the dust particles; for comparable primary and secondary masses, Papaloizou & Terquem (1995) show , which yields a precession smaller for our model parameters. If the total mass of dust particles is assumed negligible, our result based on the precession of the dust sectors may provide only an upper limit to the perturber’s semi-major axis and/or a lower limit to its mass.
Perturbation by the companion mass was assumed to effect all sectors equally so the calculated widths of the deep minima do not change during the entire timespan of the calculations. The calculated amplitude of the light spikes was found to be sensitive to the distances between the central plane of the disk and the center of the B star as seen in projection along the line of sight. Other disk orbital parameters also change ( varies between 0.01 and 0.15, and varies between and ) with smaller effects on the light curve
Figure 11 illustrates the fit of our model with the observed light curve for a portion of the quasi-flat segment and around the transition time from a quasi-flat to a periodic light curve. Inspection of the computed light curve vs. the data in Fig. 11 (b) informs us about the type of random variations in the obscuring sectors. For example, we do not fit the timing of the light spikes in the minima very well; changes in location, width and optical depths of the obscuring sectors are likely responsible, but are not modeled. The egress times from deep eclipse are fit reasonably well, indicating that the assumed period of 61.462 days is quite good and, in fact, contributes to the strength of this periodicity. This behavior implies that the fourth obscuring sector is fairly fixed in position with respect to the central star. The same cannot be said of ingress times to deep eclipses: they vary considerably, usually occurring earlier than observed, indicating that the first sector has intrinsic random and secular changes we have not modeled. There are variations in actual times of ingress compared to the model: starting at JD 50450 ingress occurs earlier, reaching a maximum separation at JD 51050, then approximately agreeing at JD 51175. Relative to the model, the leading sector changes in size, location, and optical depth, while the last sector remains relatively unchanging. The changing width of the observed minima of the light curve noted above suggests that the obscuring sectors are secularly changing: they appear to have become larger and so cover a larger portion of the disk for about 15 cycles (about 920 days), but then may have decreased in size again as indicated by the recent OGLE III data.


Our fit replicates the observational feature 3 of section 2: the envelope of the maxima becomes slightly fainter after the onset of the periodic segment; this is caused by the vertical structure of the disk modeled by the assumed exponential density falloff (of scale height ) as the precession of the line of nodes of the disk progresses.
In order to fit our model to an observed light curve with a higher density of data points in the periodic segment, we combined the MACHO and OGLE II data as follows. Using Cousins (1980) , , photometry of the 23 galactic Be stars in his sample we derived the following color transformation:
| (6) |
We transformed the MACHO and magnitudes into magnitudes with Eq. (5) and adjusted them to the zero point of the OGLE II band data via the following transformation:
| (7) |
We then time ordered the derived band MACHO data and band OGLE II data to produce a combined light curve. Figure 12 compares the model with this combined light curve over a time interval in the periodic segment where the data points were most dense. The widths of the minima and times of egress agree fairly well but the 8-day light spikes fit poorly. The fit to the band data requires the through terms of Eq. (2) to be slightly larger than the fit to band data, suggesting that the dust particles comprising the obscuring sectors are large, consistent with the discussion implied by Eq. (3).

We have only attempted to model the general features of the light curve and the nominal behavior of the disk and the obscuring sectors. We do not model random variations in the sectors, which could be caused by turbulence, but they could be incorporated. For example, the occasional fainter (and bluer) excursions near the middle of the periodic segment (cf., 3 in section 2, around JD 51000), could be caused by structure within the obscuring sectors. The occasional very bright spikes of light (as at approximately JD 50820 and JD 51100) could occur if an occasional transparency in the disk occurs, permitting the central star to appear nearly unobscured.
The recent OGLE-III (unpublished) data show only a 30 day periodicity is evident. Although data are sparser, maxima are shorter and the three spikes of light are not present within the minima, but are replaced by a single, wider maximum. Figure 13 shows a portion of the OGLE-II and III data. This new behavior, which occurred within years, could arise by assuming that the four obscuring sectors have coalesced into two larger, but unequal ones which have spread around the disk, such that gaps between each are now apart, permitting the central star to peer through each at approximately half the disk’s assumed period of days. Merging of vortices are seen in two dimensional models of compressible, viscous disks (Godon & Livio, 1999, 2000). The newly coalesced obscuring sectors may also have moved radially inward slightly shortening their orbital period, perhaps due to turbulent motions. Assuming OGLE III magnitudes are directly comparable to OGLE II magnitudes, then both maxima and minima of the former are about 0.1 mag brighter as Fig. 13 shows. This behavior is predicted by our model light curve when the next periastron occurs, as Fig. 14 indicates. But a caveat attends our assumption regarding direct comparison of OGLE II and OGLE III data: the latter are not as well calibrated as the former and the mean magnitude could be the same, vitiating our claim of a mean magnitude increase. We have not modeled any of the detailed behavior seen in the OGLE-III data.


We have inferred that much of the noisiness in the light curve could be related to the turbulent dissipation in the disk. The time of a few years for the imputed disk of our object to secularly change its obscuring character is similar to that observed in KH 15D, and so may represent a relevant time scale for this process in stellar disks. The decay of anti-cyclonic vortices in two dimensional models of viscous disks is 10-100 orbital periods (Godon & Livio, 1999, 2000). Naturally, differences between our variable and KH 15D arise from differences in the mass, luminosity and temperature of the central star, as well as in parameters of their surrounding disks.
6 Discussion
Our model of light curve of the MACHO LMC blue variable FTS 78.5979.72 consists of a B star eclipsed by four obscuring sectors in a surrounding H emitting ring-like disk. A companion star in a retrograde long period eccentric orbit, inclined to the disk, is invoked to perturb the disk such that its line of nodes quickly changes the disk’s orientation, and partial eclipses become complete ones. We would hope that this Be variable is sufficiently interesting to impel disk theorists to employ hydrodynamical simulations, perhaps incorporating the main features of our simple kinematic model, which could represent more realistic physics of multiple vortices appearing asymmetrically on half a disk, as well as secular changes in a disk induced by the close passage of a companion star.
The type of model we favor to explain the variability of this object, secular changes in a disk containing obscuring sectors which surrounds a parent B star, could be extended to explain some of the light curves of other variables in this sample and to those of Be stars in general. While the line emission in Be star spectra is believed to arise from their circumstellar disks (Cassinelli et al., 2002), with the appearance of emission lines at or near maxima (Dachs, Engels & Kiehling, 1988; Grebel, 1997; Keller, Wood & Bessel, 1998), the additional feature of this class of LMC variables noted by Keller et al. (2002), the redder maxima than minima, are additional inputs for models of circumstellar disks.
As to the predicted future of this system, two comments are relevant:
-
1.
The lifetime of disks with fully-formed planets is short because they more easily dissipate them, and is estimated to be orbital periods; lifetimes are longer if planets are still forming within the imputed dusty vortices (Barge & Sommeria, 1995; Bryden et al., 2000). No such planetary masses are included in our model.
-
2.
The period of the companion in our model is unknown, but if it is shorter than the disk dissipation time scale, it could return to its periastron, again exert perturbing impulses and further change the orientation of the disk. We have run the eclipsing program for the model for longer times and find the following. The disk’s line of nodes could be moved some and the system would return to partial eclipses; if the obscuring sectors secularly change, the light spikes within the minima would change as well, as the recent OGLE data suggests has occurred. It is possible that the perturbing object is not bound to the system but has bypassed it at the time of the transition from the quasi-flat segment to the periodic, so the only future changes would be caused by the dissipation of the disk. One prediction of our simple model with the parameters listed in Table 2 is that its velocity curve would be that of an elliptical orbit, with an unprojected velocity at periastron of km s-1 with respect to its centroid velocity.
Further spectroscopic data would clearly be of high value in refining the basic stellar and orbital parameters of this variable as well as confirming or denying the fundamental model we have investigated. Were spectral coverage sufficient to cover a few minima and maxima, which are likely to be more similar to those in the recent OGLE data than those in the MACHO data, further details of the disk’s structure and short-term secular evolution could be obtained.
| MACHO datasets | -band P(days) | -band P(days) |
|---|---|---|
| All Data (JD 2448825-2451544) | 60.9620.693 | 61.5140.584 |
| 8.0160.006 | 8.0160.006 | |
| Quasi-flat Segment (JD 2448825-2450185) | 61.2950.550 | |
| 8.0140.010 | 8.0140.020 | |
| Periodic Segment (JD 2450185-2451544) | 61.4620.787 | 61.4620.796 |
| 8.0100.010 | 8.0140.020 | |
| OGLE datasets | -band P(days) | -band P(days) |
| OGLE II (JD 2450457-2451690) | 61.6420.778 | 61.5720.680 |
| OGLE III (JD 2452123-2453140)11Kindly provided by Andrzej Udalski | 30.4370.216 |
| Central Star Parameter | Value |
|---|---|
| mass | |
| radius | |
| Circumstellar Disk Parameter | Value |
| Period | |
| initial radius | |
| initial eccentricity | |
| initial inclination | |
| , , , , | |
| (for band) | |
| (for band) | |
| (for band) | |
| (for all bands) | |
| (for all bands) | |
| (for all bands) | |
| , | (for all bands) |
| Perturbing Object Parameter | Value |
| mass | |
| Period | |
| inclination | |
| ascending node | |
| argument of periastron | |
| eccentricity | |
| Time of periastron | JD2450168.3 |
References
- Andrillat, Jaschek & Jaschek (1988) Andrillat, Y., Jaschek, M., & Jaschek, C., 1988, A&AS, 72, 129
- Artymowicz & Lebow (1994) Artymowicz, P., & Lebow, S. H., 1994, ApJ, 421, 651
- Augereau & Papaloizou (2004) Augereau, J. C, & Papaloizou, J. C. B., 2004, A&A, 414, 1153
- Baade (2000) Baade, D., 2000, in ASP Conf. Ser. 214, The Be Phenomena in Early-Type Stars, IAU Colloquium 175, eds. H.A. Smith, F.F. Henrichs, & J. Fabregat, (San Francisco: ASP), 178
- Balona (2000) Balona, L.A., 2000, in ASP Conf. Ser. 214, The Be Phenomena in Early-Type Stars, IAU Colloquium 175, eds. H.A. Smith, F.F. Henrichs, & J. Fabregat, (San Francisco: ASP), 1
- Barge & Sommeria (1995) Barge, P., & Sommeria, J., 1995, A&A, 295, L1
- Barge & Viton (2003) Barge, P., & Viton, M. 2003, ApJ, 593, L117
- Benedict et al. (2002) Benedict, G.F., et al. 2002, AJ, 123, 473
- Brouwer & Clemence (1961) Brouwer, D., & Clemence, G.M., 1961, Methods of Celestial Mechanics, (New York: Academic Press)
- Bryden et al. (2000) Bryden, G., Rozyczka, M., Lin, D.N.C., & Bodenheimer, P., 2000, ApJ, 540, 1091
- Cassinelli et al. (2002) Cassinelli, J.P., Brown, J.C., Maheswaran, M., Miller, N.A., Telfer, D.C., 2002, ApJ, 578, 951
- Chiang & Murray-Clay (2004) Chiang, E., & Murray-Clay, R.A., 2004, ApJ, 607, 913
- Cook et al. (1995) Cook, K. H. et al. 1995, in ASP Conf. Ser. 83, Astrophysical Applications of Stellar Pulsation, IAU Colloquium 155, ed. R. S. Stobie & P.A. Whitelock (San Francisco: ASP), 221
- Cousins (1980) Cousins, A. W. J., 1980, South African Astron. Obs. Circ., 1, 234
- Dachs, Engels & Kiehling (1988) Dachs, J., Engels, D., & Kiehling, R., 1988, A&A, 194, 167
- de la Fuente Marcos & de la Fuente Marcos (2003) de la Fuente Marcos, C., & de la Fuente Marcos, R., 2003, NewA, 8, 401
- Danby (1962) Danby, H.M.A., 1962, An Introduction to Celestial Mechanics, (New York: Macmillan)
- Dullemond, Dominik, & Natta (2001) Dullemond, C. P., Dominik, C., & Natta, A., 2001, ApJ, 560, 957
- Dullemond et al. (2003) Dullemond, C. P., van den Ancker, M. E., Acke, B., & van Boekel, R., 2003, ApJ, 594, L47
- Eisner et al. (2004) Eisner, J. A., Lane, B. F., Hillenbrand, L. A., Akeson, R. L., & Sargent, A. I., 2004, ApJ, 613, 1049
- Godon & Livio (1999) Godon, P. & Livio, M., 1999, ApJ, 523, 350
- Godon & Livio (2000) Godon, P. & Livio, M., 2000, ApJ, 537, 396
- Grebel (1997) Grebel, E.K., 1997, A&A, 317, 448
- Hamilton et al. (2003) Hamilton, C.M., Herbst, W., Mundt, R., Bailer-Jones, C.A., & Johns-Krull, C.M. 2003, ApJ, 529, L45
- Herbst et al. (2002) Herbst, W., et al., 2002, PASP, 114, 1167
- Hodge & Wright (1967) Hodge, P.W. & Wright, F. W. 1967, The Large Magellanic Cloud, (Washington: Smithsonian Press)
- Holland et al. (2003) Holland, W. S., et al, 2003, ApJ, 582, 1141
- Johansen, Andersen & Brandenburg (2004) Johansen, A., Andersen, A.C., & Brandenburg, A., 2004, A&A, 417, 361
- Johnson, Asher, & Winn (2004) Johnson, J.A., Asher, J., & Winn, J.N., 2004, AJ, 127, 2344
- Johnson et al. (2004) Johnson, J.A., Marcy, J.W., Hamilton, C.M., Herbst, W., & Johns-Krull, C.M., 2004, AJ, 128, 1265
- Keller, Wood & Bessel (1998) Keller, S.C., Wood, P.R., & Bessell, M.S., 1998, A&AS, 134, 481
- Keller et al. (2002) Keller, S.C., Bessell, M.S., Cook, K.H., Geha, M., & Syphers, D., 2002, AJ, 124, 2039
- Kitchin (1982) Kitchin, C.R., 1982, Early Emission Line Stars, (Bristol: Adam Hilger Ltd.)
- Larwood et. al (1996) Larwood, J. D., Nelson, R. P., Papaloizou, J. C. B., & Torquem, C., 1996, MNRAS, 282, 597
- Larwood (1998) Larwood, J. D., 1998, MNRAS, 299, L32
- Lee, Saio & Osaki (1991) Lee, U., Saio, H., & Osaki, V., 1991, MNRAS, 250, 432
- Lyubimkov et al. (2002) Lyubimkov, L. S., Rachkovskaya, T. M., Rostopchin, S. I., & Lambert, D. L., 2002, MNRAS, 333, 9
- Madore & Freedman (1991) Madore, B., & Freedman, W., 1991, PASP, 103, 667
- Melchior, Hughes & Guibert (2000) Melchior, A. L., Hughes, S. M. G., Guibert, J., 2000, A&AS, 145, 11
- Mennickent & Sterken (1997) Mennickent, R.E., & Sterken, C., 1997, A&A, 121, 113
- Millar & Marlborough (1999) Millar, C. E., & Marlborough, J. M., 1999, ApJ, 526, 400
- Milone, Stagg & Schiller (1992) Milone, E. F., Stagg, C. R., & Schiller, S. J., 1992, in Evolutionary Processes in Interacting Binary Stars, ed. Kondo, Y. (Dordrecht; Boston: Kluwer), 479
- Monnier & Millan-Gabet (2002) Monnier, J.D., & Millan-Gabet, R., 2002, ApJ, 579, 694
- Mouillet et al. (2001) Mouillet, D., Lagrange, A. M., Augereau, J. C., & Mnard, F., 2001, A&A, 372, L61
- Ozernoy et al. (2000) Ozernoy, L. M., Gorkavyi, N. N., Mather, J. C., & Taidakova, T. A., 2000, ApJ, 537, L147
- Papaloizou & Terquem (1995) Papaloizou, J. C. B., & Terquem, C., 1995, MNRAS, 274, 987
- Polidan & Peters (1976) Polidan, R. S., & Peters, G. J., 1976, in IAU Sym. 70, Be and Shell Stars, ed. Slettebak, A., (Boston: D. Reidel), 59
- Press, Flannery, Teukolsky & Vetterling (1992) Press, W., Flannery, B., Teukolsky, S., & Vetterling, W., 1992, Numerical Recipies in C, (Cambridge: Cambridge U. Press)
- Quirrenbach et al. (1997) Quirrenbach, A., et al., 1997, ApJ, 479, 477
- Sandberg-Lacy, Helt & Vaz (1999) Sandberg Lacy, C.H., Helt, B.E., & Vaz, L.P.R., 1999, AJ, 117, 541
- Soderhjelm (1974) Soderhjelm, S., 1974, Informational Bulletin on Variable Stars # 885
- Tokunaga et al. (2004) Tokunaga, A.T., et al. 2004, ApJ, 601, L91
- Torres & Stefanik (2000) Torres, G., & Stefanik, R.P., 2000, AJ, 119, 1914
- Udalski, Kubiak & Szymanski (1997) Udalski, A., Kubiak, M.,& Szymanski, M., 1997, Acta Astron.47, 319 (OGLE-II)
- Udalski (2003) Udalski, A., 2003, Acta Astron.53, 291 (OGLE-III)
- Weinberger et al. (2000) Weinberger, A. J., Rich, R. M., Becklin, E. E., Zuckerman, B., & Matthews, K, 2000, ApJ, 544, 937
- Winn et al. (2003) Winn, J.N., Garnavich, P.M., Stanek, K.Z., & Sasselov, D.D., 2003, ApJ, 593, L121
- Winn et al. (2004) Winn, J.N., Holman, M.J., Johnson J.A., Stanek, K.Z., & Garnavich, P.M., 2004, ApJ, 603, L45
- Wyatt et al. (1999) Wyatt, M. C., Dermott, S. F., Telesco, C. M., Fisher, R. S., Grogan, K., Holmes, E. K., & Pi, R. K., 1999, ApJ, 527, 918
- Wyrzykowski et al. (2003) Wyrzykowski, Ł., et al. 2003, Acta Astron., 53, 1
- Zebruń et al. (2001) Żebruń, K., et al. 2001, Acta Astron., 51, 317