Spatially Resolved Spectroscopy of the E+A Galaxies in the Cluster AC 114
Abstract
We present spatially resolved intermediate resolution spectroscopy of a sample of twelve E+A galaxies in the rich galaxy cluster AC 114, obtained with the FLAMES multi-integral field unit system on the European Southern Observatory’s VLT. Previous integrated spectroscopy of all these galaxies by Couch & Sharples (1987) had shown them to have strong Balmer line absorption and an absence of [OII]3727 emission – the defining characteristics of the“E+A” spectral signature, indicative of an abrupt halt to a recent episode of quite vigorous star formation. We have used our spectral data to determine the radial variation in the strength of H absorption in these galaxies and hence map out the distribution of this recently formed stellar population. Such information provides important clues as to what physical event might have been responsible for this quite dramatic change in star formation activity in these galaxies’ recent past. We find a diversity of behaviour amongst these galaxies in terms of the radial variation in H absorption: Four galaxies show little H absorption across their entire extent; it would appear they were misidentified as E+A galaxies in the earlier integrated spectroscopic studies. The remainder show strong H absorption, with a gradient that is either negative (H equivalent width decreasing with radius), flat, or positive. By comparing with numerical simulations we suggest that the first of these different types of radial behaviour provides evidence for a merger/interaction origin, whereas the latter two types of behaviour are more consistent with the truncation of star formation in normal disk galaxies with the H gradient becoming increasingly positive with time after truncation. It would seem therefore that more than one physical mechanism is responsible for E+A formation in the same environment.
keywords:
galaxies: clusters: individual (AC114) — galaxies: evolution — galaxies: formation1 Introduction
“E+A” galaxies exhibit strong Balmer absorption lines superimposed upon an elliptical galaxy type spectrum (Dressler & Gunn 1983) and represent a population of galaxies that have undergone a significant change in their star formation rate. The lack of optical emission lines, for example [OII]3727, indicates that star formation has ceased. However, the strong Balmer absorption line signature implies the existence of a substantial population of young A stars which must have formed no more than 1 Gyr ago. This spectral signature is usually interpreted as the recent truncation of a starburst (Dressler & Gunn 1983; Couch & Sharples 1987, hereafter CS87; Barger et al. 1996; Poggianti et al. 1999) or the abrupt truncation of more normal star formation activity in a disk galaxy (CS87; Balogh et al. 1999).
The numbers of E+A galaxies seen in different environments evolves strongly with redshift. E+A’s are rare in nearby clusters, making up only about 1% of the total galaxy population in the clusters (Fabricant et al. 1991), and are even less common in the low-redshift field, comprising roughly 0.03%-0.2% of the overall galaxy population depending on the selection criteria (Zabludoff et al. 1996, hereafter Z96; Blake et al. 2004). In contrast, these galaxies represent a significant fraction of the galaxy population in intermediate redshift clusters, where they were initially discovered by Dressler & Gunn (1983). Estimates of the fraction of E+A galaxies in such (0.2z0.6) clusters generally range from 10%-20% (Dressler & Gunn 1992; Couch et al. 1998; Dressler et al. 1999), although this high fraction may not be a universal property of all clusters at these redshifts (Balogh et al. 1999).
The physical processes involved in the formation of these galaxies remain unclear; however, it is unlikely that such a dramatic change in star formation activity could be due to internal factors and hence external ‘environmental’ influences would seem to be the cause. In this regard, a plethora of possible mechanisms have been suggested including major mergers (Mihos & Hernquist 1996), minor mergers and galaxy-galaxy interactions or, in the case of E+A galaxies residing in clusters, interaction with the strongly varying cluster tidal field (Bekki 1999), galaxy harassment (Moore et al. 1998) or interaction with the hot intracluster medium (Gunn & Gott 1972). There is mounting evidence that E+A galaxies in the low redshift field are the result of mergers or tidal interactions. Z96 inspected ground based imaging of a sample of 21 E+A galaxies drawn from the Las Campanas Redshift Survey (LCRS), and found a high incidence of tidal features in these galaxies implying mergers or galaxy-galaxy interactions in the formation process. This conclusion was later verified using high resolution HST imaging (Yang et al. 2004). Blake et al. (2004) arrived at a similar conclusion using a larger sample drawn from the Two Degree Field Galaxy Redshift Survey (2dFGRS; Colless et al. 2001). Goto (2005) using a sample of 266 E+A galaxies from the Sloan Digital Sky Survey (Abazajian et al. 2004) claimed to observe an excess in the projected local galaxy density on scales of kpc surrounding the E+A galaxies - indicating dynamical interactions as a likely formation mechanism.
Norton et al. (2001) obtained long slit spectroscopy of the Z96 sample in order to probe the spatial and kinematic distribution of the stellar populations. In most cases they found the young stellar population to be pressure supported, consistent with a merger origin. The study of 2dFGRS E+A galaxies by Blake et al. (2004) supported this picture by demonstrating that these galaxies are preferentially spheroidal systems, as evidenced by their morphologies, group environments and luminosity function.
In contrast to the field E+A galaxies the picture for E+A galaxies that reside in the dense cluster environment is less clear. The HST studies of Couch et al. (1994, 1998) and Dressler et al. (1999) revealed that the majority of E+As in intermediate redshift clusters are undisturbed elliptical or early type disk systems. The very existence of such disk systems rules out equal mass mergers that would disrupt the disk (Dressler et al. 1999), although minor mergers with a gas rich dwarf remains a plausible formation mechanism (Bekki et al. 2001). In the one example of spatially resolved spectroscopy of a high redshift () cluster E+A, Franx (1993) found evidence for strong rotation in the young stellar population.
Knowledge of how this population of recently formed stars in E+A galaxies is distributed spatially is critical information for differentiating between the proposed formation mechanisms. Mergers and tidal interactions lead to a centrally concentrated burst of star formation (Mihos & Hernquist 1996; Bekki et al. 2005) with the starburst contained within the central 1-2 kiloparsecs. In contrast, ram pressure stripping should lead to a roughly uniform truncation of star formation across the disk (Rose et al. 2001). Using a combination of long slit spectroscopy and broadband imaging Rose et al. (2001) studied the spatial distribution of recent star formation in early type galaxies in three low redshift clusters and found that the star formation was centralised in comparison to the distributions observed in similar galaxies in the field. Bartholomew et al. (2001) measured the colour gradients of early-type galaxies in a cluster and found that the E+A galaxies tended to have bluer nuclei than the overall galaxy population, implying systematically more centralised star formation.
In this paper we present new data on the spatial distribution of H absorption – one of the key tracers of the young stellar population – for a sizable sample of E+A galaxies in a rich intermediate redshift cluster. In contrast to previous studies, ours is the first to obtain such information via integrated field unit (IFU) spectroscopy on an 8m telescope (the VLT). If mergers and tidal interactions are responsible for the E+A galaxy signature, then a strong negative radial gradient in H equivalent width is expected, in the sense that the H equivalent width decreases with galacto-centric radius (Bekki et al. 2005). However, if the E+A signature is the product of the truncation of normal star formation, a more uniform distribution of H equivalent width across the galaxy is expected. Our target sample comprises 12 E+A galaxies that are members of the rich cluster AC 114 (also known as Abell S1077; Abell et al. 1989), which has been the subject of many previous studies as a result of its significant population of blue ‘Butcher-Oemler’ galaxies (CS87). It has a high velocity dispersion (Mahdavi & Geller 2001) and an irregular X-ray morphology (De Filippis et al. 2004).
The layout of this paper is as follows: In Section 2 we provide all the details relevant to the observational data used in our study, describing how our E+A sample was selected, giving details of our IFU spectroscopic observations, outlining how the data were reduced, and discussing difficulties encountered with the position of the IFU’s on our target galaxies. In Section 3 we first examine our spectra in their integrated form (i.e., summed over the entire galaxy), comparing them with the original integrated spectroscopy obtained by CS87 and thus verifying these galaxies’ classification as E+A types based on this previous lower resolution and signal-to-noise spectral data. In section 4 we then exploit the spatially resolved nature of our spectroscopy to map out the location of the young stars within our E+A galaxies, using the equivalent width of the H absorption line, as defined by the H index (Worthey & Ottaviani 1997), as our tracer. In particular, we determine how H varies with radius across each galaxy, taking into account the convolving effects of astronomical seeing. We discuss and interpret our results in section 5, using model predictions for the radial gradients in metallicity and H strength under different formation scenarios as our main tool. Our main conclusions are summarised in section 6. Throughout this paper we adopt an and cosmology, which places AC 114 at a comoving distance of 1231 Mpc, with projecting to 4.6 kpc.
2 Data
2.1 Sample Selection
We targeted the members of AC 114 which had been previously identified as E+A galaxies in the spectroscopic study of this cluster conducted by CS87. We chose the brightest () galaxies from the CS87 sample, and paid no attention to their colour in our selection. This meant we included both the reddest E+A galaxies – which CS87 referred to as “red H-strong” (HDS) galaxies and have enhanced Balmer line absorption even though their colours are as red as passive E/S0 galaxies – as well as those with bluer colours – which CS87 referred to as “post-starburst” (PSG) galaxies, since they are presumably seen much sooner after the cessation of star formation. All of these galaxies have no detectable [OII]3727 emission. Also included in our sample was the blue galaxy CN667, for which the CS87 study was able to confirm its membership of AC 114 but not its spectral type. This gave us a sample of 12 galaxies.
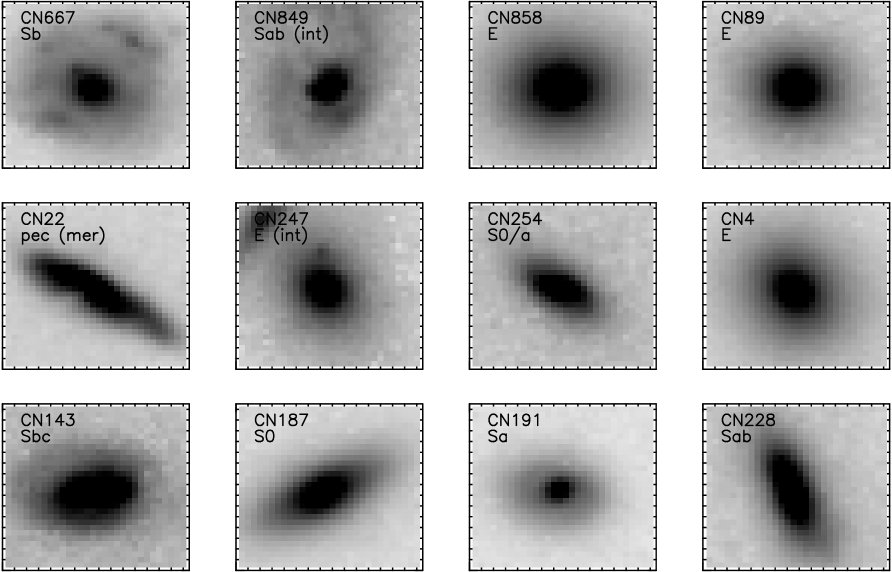
In Table 1 we list the photometric, spectroscopic, and morphological properties of this sample: column (1) gives the galaxy’s identity number from the original Couch & Newell (1984) catalogue, column (2) gives the -band magnitude, column (3) gives the -based Hubble types determined by Couch et al. (1994, 1998), column (4) gives the PSG/HDS spectral sub-type assigned by CS87, column (5) gives the colours, and column (6) gives the rest frame H equivalent width values (Å) measured by CS87. Postage stamp images of all the galaxies taken in the F702W passband with , are displayed in Fig. 1. As can be seen, the galaxies generally have an early-type (E, S0, Sa-b) morphology, the exception being CN22 which has a peculiar morphology and was classified by Couch et al. (1998) as an advanced merger.
2.2 Spectroscopic Observations
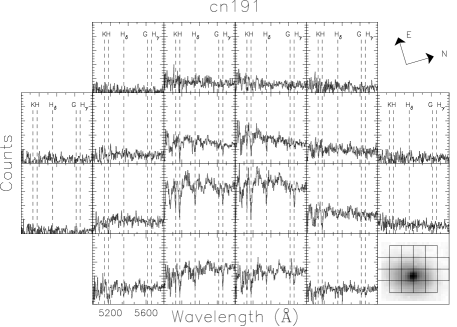
We obtained intermediate resolution IFU spectroscopy of our sample with the VLT-Kueyen telescope. We used the FLAMES system in the mode where it couples the OzPos multi-object fibre positioner to the GIRAFFE spectrograph. OzPos is able to deploy 130 single“Medusa” fibres or 15 individual IFUs over a 25 arcminute field at the Nasmyth focus of the telescope. We utilised the latter to observe the twelve galaxies in our sample simultaneously; the remaining three IFUs were used to observe blank sky regions in order to facilitate accurate sky subtraction. Each IFU has a ( kpc) field of view which is sampled spatially by 20 square lenslets; its geometry is shown in Fig. 2.
The observations were obtained during the nights of 2003 September 23, 26, and 27, being taken when the seeing conditions were at their best. A total of 17 exposures, mostly of 1800 s duration, were obtained over these 3 nights, in seeing which ranged from to . They gave a combined exposure time of 29,119 s, during which the time-weighted mean seeing was (corresponding to a physical scale of 3.5 kpc at the redshift of the cluster). The GIRAFFE spectrograph was used in its ‘low resolution’ R=6000 mode and in the “LR4” wavelength setting. This configuration allowed us to observe over the wavelength interval ( at ) at a dispersion of 0.2Å per pixel.
| CN# | Hubble type | Spec class | H (CS87) | ||
|---|---|---|---|---|---|
| 143 | 20.31 | Sbc | PSG | 1.67 | 7.7 |
| 187 | 19.31 | S0 | HDS | 2.29 | 3.4 |
| 191 | 19.69 | Sa | PSG | 1.61 | 5.6 |
| 228 | 19.90 | Sab | PSG | 1.38 | 5.1 |
| 22 | 19.73 | pec | PSG | 1.47 | 8.1 |
| 247 | 19.12 | E | HDS | 2.44 | 2.8 |
| 254 | 20.09 | S0/a | PSG | 1.99 | 6.5 |
| 4 | 18.44 | E | HDS | 2.29 | 4.7 |
| 667 | 19.37 | Sb | ? | 1.67 | ? |
| 849 | 19.71 | Sab | PSG | 1.82 | 4.6 |
| 858 | 19.12 | E | HDS | 2.35 | 3.8 |
| 89 | 19.61 | E | HDS | 2.23 | 5.6 |
2.3 Data reduction
The data were reduced using standard IRAF routines. In brief, each frame was first bias-subtracted and then its overscan region removed. All science frames from a given night were then median combined, after having been scaled to allow for the different exposure times. Cosmic ray rejection was performed as part of this process using the crreject algorithm. The flat fields were used to identify the position of the spectra on the CCD. A smoothed scattered light signal was removed from the flat field and science frames by fitting a Chebyshev function to the pixels between the fibres. Following this, the spectra were extracted and wavelength calibrated using arc lamp exposures. The flat field spectra were used to calculate and correct for the variations in throughput from fibre to fibre; this was based on the total signal contained within each spectrum over the entire wavelength interval covered by our observations. Finally, all the spectra recorded through the three ‘blank sky’ IFUs were summed and averaged to form a mean ‘sky’ spectrum, which was then used to subtract the sky from the spectra recorded in the remaining 12 ‘target’ IFU’s. The spectra were corrected to a relative flux scale using an ARGUS-IFU observation of a flux standard star.
Systematic errors in the sky-subtraction will lead to incorrect continuum levels in the spectra and hence to biased equivalent width measurements. In order to evaluate the accuracy of the sky subtraction we used the residuals of the individual ‘sky’ spectra after subtraction of the ‘mean sky’ signal. Using the residual in the atmospheric emission line we calculated the fractional error in the sky subtraction to be 3.6%, this compares with 1.1% expected from Poisson statistics. More importantly, we checked for any systematic errors in the sky subtraction using the residual continuum. We calculated the RMS of the mean value of the residuals in each lenslet and the mean RMS of the residuals averaged over all lenslets, the ratio of these gives the size of any systematic errors in the sky subtraction with respect to the size of purely random errors. The resulting ratio is 0.14 implying that any systematic sky subtraction error is roughly an order of magnitude smaller than the random errors.
2.4 IFU-Object placement
At this point of having derived accurately sky-subtracted spectra for the 20 lenslets in each IFU, it became apparent that most of our target galaxies were not perfectly centred in each IFU. An example is shown in Fig. 2 where we plot the spectra obtained in each of the IFU ‘pixels’ for the galaxy CN191. Note that the normalisation of each spectrum is identical, so the continuum level of the twenty spectra can be directly compared. We see quite clearly in this case that the signal is at a maximum in the two spectra immediately below the centre of the IFU, indicating that the galaxy is off-centre in this direction by .
In Fig. 3 we display the centroid positions of each galaxy within the IFU field, estimated from the total galaxy signal observed in each IFU pixel (see Section 4.2). The centroid positions of each galaxy in the coordinate system of Fig. 3 are listed in columns (5) and (6) of Table 2. It can be seen from Fig. 3 that the galaxies are generally off-centre by at least half an IFU pixel (), with quite a number being off-centre by as much as 1-2 IFU pixels (). This could be due to one or more of the following factors: (i) errors in the astrometric positions used for our galaxies, (ii) IFU positioning errors, and (iii) errors in the determination of the galaxy centroids from our IFU data.
Since the placement of the IFU’s on target objects involves bringing them in approximately radially from their parked locations around the perimeter of the field, the IFU’s will generally all be at different position angles with respect to the sky. Hence Fig. 3 gives no sense as to whether the three possible sources of error above are random or systematic. In Fig. 4, therefore, we plot the observed positional offsets in terms of their magnitude and direction on the sky. The vectors point in the direction of the calculated centre of the galaxy from the geometric centre of the IFU, and their lengths have been scaled up by a factor of 100 for display purposes. It would appear from this diagram that the positional errors are systematic on the sky, with perhaps marginal evidence that their magnitude increases with distance from the centre of the field. This implies there is some systematic problem with the IFU positioning across the field, either with the OzPos positioner or, more likely, in there being a systematic positional offset between the astrometric zero points for our guide stars (which are not plotted in Fig. 4) and that of our target galaxies. As disappointing as it may be, we are left to conclude that this problem is most likely due to a combination of all three of the different types of error mentioned above, although we note that repeated tests of the OzPos positioner have indicated it is capable of placing the IFU’s to a RMS precision of better than . How we deal with this problem in our subsequent analysis is further detailed in section 4.2.


| CN no. | z | H(CS87) | H | H | Slope (H) | corr slope | |||||
|---|---|---|---|---|---|---|---|---|---|---|---|
| arcsec | arcsec | kpc | Å | Å | Å | ||||||
| 143 | 0.3103 | 1.67 | 0.64 | 1.08 | 1.12 | 3.2 | 7.7 | 1.6 | |||
| 187 | 0.3074 | 2.29 | 1.03 | 1.33 | 0.34 | 2.6 | 3.4 | -1.8 | |||
| 191 | 0.3045 | 1.61 | 0.60 | 1.55 | 0.69 | 1.9 | 5.6 | -6.4 | |||
| 228 | 0.3161 | 1.38 | 0.46 | 1.66 | 1.12 | 3.4 | 5.1 | 5.8 | |||
| 22 | 0.3356 | 1.47 | 0.53 | 1.59 | 0.74 | 3.4 | 8.1 | NA | -5.8 | ||
| 247 | 0.3191 | 2.44 | 1.15 | 1.53 | 0.98 | 1.9 | 2.8 | -0.2 | |||
| 254 | 0.3192 | 1.99 | 0.86 | 1.65 | 1.57 | 2.7 | 6.5 | -4.3 | |||
| 4 | 0.3083 | 2.29 | 1.04 | 1.28 | 1.13 | 5.2 | 4.7 | 2.6 | |||
| 667 | 0.3122 | 1.67 | 0.64 | 1.44 | 1.56 | 4.4 | ? | 1.3 | |||
| 849 | 0.3235 | 1.82 | 0.75 | 1.56 | 1.87 | 2.6 | 4.6 | 2.1 | |||
| 858 | 0.3118 | 2.35 | 1.00 | 1.73 | 0.92 | 3.8 | 3.8 | 6.1 | |||
| 89 | 0.3173 | 2.23 | 1.01 | 1.88 | 0.91 | 2.8 | 5.6 | 0.9 |
3 Spatially integrated spectra
3.1 Construction and measurement
Before utilising the spatially resolved spectroscopic information provided by our observations, it is instructive to first examine it in its ‘integrated’ form and see how our spectra compare with those previously obtained by CS87. For each galaxy, we combined the 20 individual spectra obtained with each IFU into a single spatially integrated spectrum. Each spectrum was weighted according to its variance to maximise the signal-to-noise ratio of the final integrated spectrum. The spectra for the 12 galaxies are presented in Fig. 5, having been smoothed with a Gaussian of FWHM 1.2Å. It can be seen that these integrated spectra are of reasonably high quality with ranging from 5[Å-1] for CN254 to 20[Å-1] for CN849, measured in a 100-Å-wide interval (rest frame) just redwards of the H feature. Their signal-to-noise ratios are certainly higher than those of the original spectra obtained by CS87. As such, the key spectral lines within our observed wavelength range (indicated by the vertical dashed lines in Fig. 5) are easily identifiable, in particular the Balmer absorption lines H and H. However, these two Balmer lines are conspicuous by their weakness or even absence in several of the galaxies (CN858, 667, 4, 187), bringing into question their classification as E+A types.
These visual impressions were properly quantified by conducting redshift and spectral line index measurements. Redshifts were measured for each spectrum using the IRAF task FXCOR, which performs a Fourier cross-correlation (Tonry & Davis 1979) of the object spectrum with a set of template spectra taken from Vazdekis (1999). The resulting redshifts for our 12 target galaxies are given in column (2) of Table 2. These redshifts are in good agreement with those originally derived by CS87 with the RMS difference between the two sets of redshifts being .

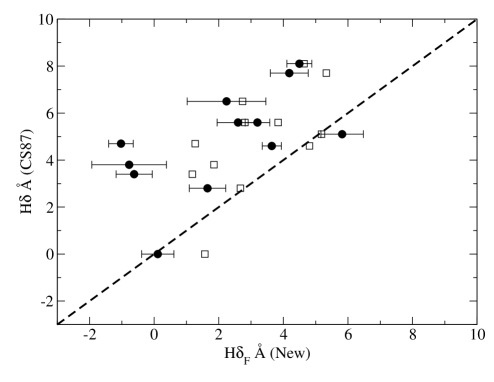
These redshifts were then used to precisely locate spectral lines within each spectrum and measure their equivalent width. Of primary importance here is the H line, given its use in defining an E+A galaxy (CS87; Dressler et al. 1999). To measure the equivalent width of this line we adopted the H index definition of Worthey & Ottaviani (1997), whereby the signal within the line is evaluated over the rest-wavelength interval 4091.00-4112.25 Å, and the neighbouring continuum levels are determined within the intervals 4057.25-4088.50 Å and 4114.75-4137.25 Å. The error in this index was calculated directly from the spectrum’s variance array (see Cardiel et al. 1998). The H values derived in this way are plotted in Fig. 6 (filled circles) and listed in column (9) of Table 2, for comparison the H index values are given in column (10) of Table 2 and generally scale well with H.
3.2 Comparison with CS87
It is worthwhile comparing our line index measurements with those of CS87, and re-examining their E+A status. In Fig. 6 we plot CS87’s H equivalent width values against our own. The first comparison we make is with our H index values; this is shown by the filled circles. A low value of H (H) is detected in galaxies CN858, CN667, CN4 and CN187, confirming the visual impressions mentioned above. As noted earlier, CN667’s spectral classification was previously uncertain (CS87), and we can now confirm it to be “passive” or, in the nomenclature of Dressler et al. (1999), a “k” type. Note since no CS87 H equivalent width index is available for CN667, it is arbitrarily assigned an ordinate value of zero in Fig. 6. The other three galaxies were, however, all classified as E+A’s; our better quality and higher spectral resolution data clearly show these classifications to be incorrect. It can be seen, in Fig. 6, that our measured H indices are generally smaller than the CS87 values, the average difference being 2.7 Å. However, we caution that CS87 used a different method for measuring the equivalent widths of lines in their spectra, and their integrated spectra were measured through a aperture fibre, the exact positioning of which on each galaxy cannot be determined.
While we are unable to determine what, if any, aperture effect the latter might introduce into our comparison, we can at least address the issue of different line measuring techniques. To do so, we re-measured the H equivalent width values of our spatially integrated spectra using the same ‘interactive’ routine that CS87 used (the routine ABLINE in the Starlink software package). Here, the line and neighbouring continuum regions are identified interactively, an iterative polynomial fit is performed to determine the continuum level across the line, and the line itself is fitted by a Gaussian function within the wavelength interval identified. Since spectral resolution can affect the measured equivalent width values, we were careful to first smooth our spectra to the resolution of the original CS87 spectroscopy. The comparison with the H equivalent width values measured using this technique is shown in Fig. 6 by the open squares. It can be seen that while our measurements are still systematically smaller than those of CS87, the difference is nowhere near as great (cf. the H measurements), the mean difference being 1.7 Å. Nonetheless, our comparison points to the fact that systematic differences in line index measurements can exist between different studies and data sets, and some caution needs to be exercised accordingly. One obvious cause of such differences, particularly for multi-object fibre-based studies, is a systematic error in sky-subtraction. This would lead to incorrect continuum levels within the spectra, and hence an over- or under-estimation of the equivalent widths.
Hereafter, we only consider the eight galaxies in our sample where we have detected significant (HÅ) Balmer absorption.
3.3 Spectrophotometric models revisited
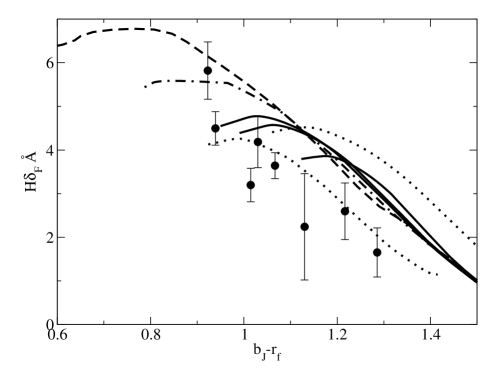
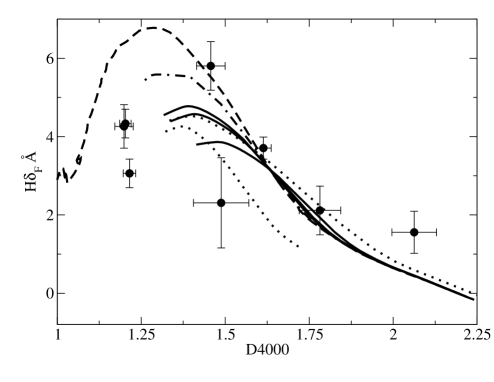
With there having been some revisions to the measured strengths of the key Balmer absorption lines within our E+A sample, a reexamination of their evolutionary status is warranted. This is best done using the H–colour diagnostic diagram (CS87), where we compare the data for our galaxies with spectrophotometric models. This is shown in the top panel of Fig. 7, where we plot the H values measured for our galaxies against their colours (the reddening-corrected values taken from CS87). The spectra were smoothed to a resolution of prior to measuring the H indices in order to facilitate a consistent comparison with model spectra. We have K-corrected the colours using the formulae given by Wild et al. (2004), which calculate a K-correction based on redshift and colour:
| (1) |
| (2) |
where and . The magnitude of the K-correction for each galaxy is given in column (4) of Table 2.
Also plotted in the top panel of Fig. 7 are the evolutionary tracks for galaxies with different star formation histories; these were calculated using the stellar population synthesis models of Bruzual & Charlot (2003). The Bruzual & Charlot code returns line index measurements and colours at a series of time steps for the chosen star formation history computed directly from synthetic model spectra at resolution. It is important to note that the line index measurements here were made using the same H definition (at the same spectral resolution) that was applied to our observed spectra, thereby ensuring complete consistency in comparing our observations with the models. As far as the model colours were concerned, they were transformed into values using the conversion of Couch (1981):
| (3) |
In all cases we assumed a Salpeter (Salpeter 1955) initial mass function and an exponentially decaying star formation rate. The solid curves in the top panel of Fig. 7 trace the evolution in the H-colour plane for solar metallicity models in which this exponentially-decaying star formation is abruptly (instantaneously) truncated after 10 Gyrs. The model curves are shown from the time the star formation is truncated to a time 10 Gyrs after the end of star formation. The models displayed have exponentially-decaying star formation rates with e-folding times 5, 10 and 15 Gyrs. The 15 Gyr model has the highest value of H and bluest colour at the time the star formation is truncated (since it has the highest star formation rate at this time). The 5 and 10 Gyr models have progressively lower H index values and redder colours. The dashed curve represents a =5 Gyr model in which a -function burst of star formation occurs after 10 Gyrs, converting 10% of the total galaxy mass into new stars. The dot-dashed curve is a variation of the starburst model in which the starburst, converting 10% of the galaxy mass into stars, takes place over a period of 1 Gyr. In order to investigate the effect of metallicity on these evolutionary tracks in the H–colour plane, we also plot the tracks of the =10 Gyr model for sub-solar (Fe/H) and super-solar (Fe/H) metallicities. These are shown as the dotted lines in the top panel of Fig. 7. The lower metallicity model track is shifted to have bluer colours than in the case of solar metallicity and the high metallicity track is shifted redward. Note the almost monotonic increase of observed H with increasing blueness. This is consistent with the general trends seen in all the model tracks. However, apart from the low metallicity models, the data points in the top panel of Fig. 7 all lie blueward and/or beneath the model curves. This may be a result of errors in, any or all of, the reddening correction, colour conversion and K-correction causing the data to have colours which are too blue. Emission line filling from residual star formation present in the data but not in the models resulting in lower values of the measured H index could also explain the discrepancy. In the bottom panel of Fig. 7 we show the galaxies in the H–D4000 plane. We use the D4000 index definition of Balogh et al. (1999) which measures the ratio of the flux in a band just redward of the 4000Å break (4050-4150Å) to the flux in a band just blueward of the 4000Å break (3850-3950Å). This index is less affected by dust than broadband colours and does not rely on uncertain colour conversions and K-corrections. The same set of models described above are superimposed on the data and, in this case, there is no systematic offset in the D4000 index value between the model tracks and observational data.
It is apparent from the tracks in Fig. 7 that it is difficult to distinguish between the truncation of a starburst episode and the abrupt truncation of normal star formation, unless the galaxy is observed shortly after the starburst when it will display bluer colours and stronger Balmer line absorption than can be reproduced by the truncation of normal star formation (upper left region of Fig. 7).We are unable to differentiate between the truncation of exponentially-decaying star formation and the sudden cessation of a starburst, on the basis of the ‘integrated’ H equivalent widths and broadband colours alone. It is worth noting that the duration over which these models can be distinguished is very short. For the starburst models presented in Fig. 7, the interval between the time star formation ceases and the model galaxy evolves redwards of , is approximately 600 Myrs. The short lifetime of this very blue H-strong phase implies that very few galaxies should be observed in this part of parameter space.
4 Spatially resolved spectra
4.1 Defining the galaxy centre
Due to our target galaxies being off-centre within the IFU’s (see section 2.4), our first step prior to analysing our spatially revolved spectral data was to find where each galaxy was centred within the IFU. This was done by summing the flux in each IFU element over the full wavelength range of the spectra to create an image in the IFU of each galaxy. It is insufficient to simply calculate a flux-weighted mean position for the centre of the galaxy, because the small spatial extent of the IFU will cause us to underestimate the offset of the galaxy centre from the centre of the IFU. Instead we fitted a surface to the IFU image:
| (4) |
and required the coefficients and to both be negative. The galaxy centre is then defined by the maximum of the function :
| (5) |
Our choice of function is motivated only by the requirement that it has a well-defined maximum; the precise choice of functional form has little effect on the derived position of the maximum. In Fig. 3 we show the positions of the centre of the galaxies as determined from the maxima of the fitted paraboloids.
4.2 Radial profiles
The signal-to-noise ratio of the spectra obtained in each individual IFU lenslet is insufficient to accurately map the spectral line features at an individual IFU pixel scale (). Hence we spatially binned the IFU spectra in annuli around the galaxy centres, focusing our attention on radial variations in the spectral properties.
In binning the data in this way, the weight assigned to the ith lenslet was taken to be:
| (6) |
where is the total flux observed through the lenslet, and is the area of the lenslet which falls within the annular bin (the value for which was calculated numerically). The spectra were binned into three concentric annuli, which were partitioned at and . The outermost annulus contained all of the IFU spectra at radii greater than , and its effective radius was taken as the midpoint between the ring and the smallest ring which contained the entire IFU field of view. This results in a of 2-3[Å-1] for the outer bins of the faintest galaxies to a of 16[Å-1] for the central bin of CN849. The H equivalent width measurements were then repeated on the binned spectra obtained in each of the three annuli.
The radial variation in H observed in each of our galaxies can be seen in Fig. 8, where we plot the values measured in the three annular bins. Radial gradients are seen in most galaxies, and for the purposes of our subsequent analysis (in particular, deconvolution; see below) we represent these via a linear fit to the data points:
| (7) |
where is the effective radius of the galaxies measured from the HST imaging and are given in column (7) of Table 2 and the slopes, , being listed in column (11) of Table 2.

4.3 Deconvolving the seeing disk
The galaxy flux distributions that we observe across the IFU lenslets are convolved with a seeing disk which has a time-averaged FWHM () which exceeds the side length of a lenslet (). We therefore expect the ‘true’ deconvolved radial equivalent width profile to differ significantly from that which is observed. Qualitatively, any observed equivalent width gradient will be more pronounced before convolution. In detail, we denote and as, respectively, the equivalent width and flux maps after convolution with the seeing disk. Let and be the deconvolved maps of these quantities. The equations governing the convolution (which is denoted by the overline symbol) are:
| (8) |
In light of the inherent difficulties in performing numerical deconvolutions of general functions, we adopted the following method to determine the ‘true’ equivalent width profile , which we assume is a linear function of radius . Firstly, we fitted an elliptical Gaussian to the pixelised map of , and deconvolved this function analytically using the observed seeing FWHM to obtain . We then looped over a grid of profiles for . For each grid point we deduced the resultant convolved map , which we binned radially for comparison with the linear fits to the observed [H, ] data points (Table 2). The best-fitting values of form our best model for the deconvolved radial equivalent width profile of each galaxy.
The revised slopes are listed for each galaxy in the final column of Table 2. We note that the corrections involved are substantial (a modification of the slope by a factor ), and always serve to increase the significance of the slope detection. This can be seen visually in Fig. 8 where we have plotted (as dotted lines) the ‘deconvolved’ linear relations; it is important to stress here that their behaviour is not simply determined by the radial variation seen in the observed H values, but also the galaxy’s radial flux distribution!
5 Discussion
5.1 General trends
Inspection of Fig. 8 (or Table 2), whether it be the observed data points or the more accentuated ‘deconvolved’ linear profiles, indicates three distinct types of behaviour in terms of the variation of H with galacto-centric radius: (i) A negative slope, with H absorption being strongest at the centre of the galaxy and decreasing roughly monotonically with increasing radius – the E+A galaxies in our sample which show this type of behaviour are CN254, CN22, and CN191. (ii) A flat slope, with H being uniform across the entire face of the galaxy – Three galaxies show this type of behaviour, and they are CN143, CN89 and CN247 (although arguably this latter galaxy is not an E+A type, due to its H absorption being too weak [H Å]). (iii) A positive slope, with H absorption being at its weakest at the centre of the galaxy and increasing roughly monotonically with increasing radius – the galaxies in this category are CN849 and CN228.
Curiously, however, there appears to be little correlation between H profile slope and overall morphology. Two of the three negative slope galaxies are early-type disk galaxies (CN254 - S0a, CN191 - Sa), and the two positive slope galaxies have this morphology as well (CN849 & CN228 - both Sab’s). The other negative slope galaxy, CN22, has a peculiar morphology and is clearly a merging system (which at least is consistent with its negative H slope; see below). Two of the three flat-sloped galaxies, CN89 & CN247, are both ellipticals. The only other flat-sloped galaxy, CN143, has an Sbc morphology, which we note is the latest Hubble type in our E+A sample. Finally, it should also be noted that merger/interaction activity appears to be prevalent amongst the positive and flat slope galaxies, with the -based imaging of Couch et al. (1998) providing quite clear evidence that CN849 is interacting with its close, bright neighbour (with the two being connected by a tidal bridge), and somewhat more tentative evidence that CN247 is involved in a similar interaction with its neighbour. Although CN849 is an interacting galaxy (It is clearly not in the late stage of a merger) this does not rule out that this galaxy has had its star formation recently truncated - producing its E+A spectral signature.
5.2 Metallicity gradients
Before we interpret these different radial H slopes further, it is important that we first check whether some of this variation could be due to metallicity gradients which are well known in galaxies. The strength of the hydrogen Balmer lines depends on the main-sequence turnoff temperature. Young main-sequence stars are hot and have strong hydrogen absorption. Metal-poor stars also have relatively hot main-sequence stars and stronger hydrogen absorption. However the effect is small compared with the effect of age (Worthey & Ottaviani 1997). Metal absorption lines within the index continuum bands will also affect the derived value of the index. Unfortunately, we cannot attempt a rigorous treatment of metallicity effects for these specific galaxies, because this would require further observation with a broader spectral range and higher signal-to-noise ratios. We can only discuss general trends. The expectation here is that the metallicity decreases with increasing distance from the galactic centre (Searle 1971). There have been various suggestions for the origin of the metallicity gradients in galaxies. The models of Larson (1974); Carlberg (1984) predict that in the process of galaxy formation, the transfer and enrichment of gas toward the galactic centre leads to more metal enriched stars forming in the central regions and hence the development of a metallicity gradient. Martinelli et al. (1998) reproduced the observed metallicity gradients in galaxies using a model in which supernova-driven galactic winds develop first in the outskirts of a galaxy and then successively progress toward the centre.
Since the equivalent width of the H line depends on metallicity as well as age, we need to evaluate the effect of a metallicity gradient on the H profiles in Fig. 8. We cannot measure the metallicity gradients directly from our spectra because the observed wavelength range does not include a suitable metallicity index. Instead we used the models of Thomas et al. (2004) to compute the effect of metallicity on our measured H values. By assuming [/Fe]=0 and a single age population, a linear fit to these models yields the slope:
| (9) |
which is essentially independent of the age of the stellar population. Typical metallicity gradients in early-type galaxies are:
| (10) |
(Davies et al. 1993). We can combine equations (9) and (10) to estimate the radial variation in H which would result solely from a gradient in metallicity:
| (11) |
Therefore, typical metallicity gradients in galaxies (in which the metallicity decreases with radius) result in an H signature that increases with radius. The radial profiles in Fig. 8 span a range in galacto-centric radii of approximately 1 to 5 kpc; from Equation (11), a fractional increase of 31% in H over this range would be expected from the metallicity gradient in Equation (10), or an average linear slope of . In general this is small compared with the size of the observational errors for the E+A’s with flat or positive slopes (see Table 2). Of course for those E+A galaxies with negative slopes, a metallicity gradient only serves to diminish this type of radial behaviour; correcting for it would therefore just further steepen the increase in H absorption towards their centres.
5.3 Comparison with numerical models
In order to derive physical meaning from the observed radial gradients of H in E+As, we perform a set of numerical simulations of E+A galaxy formation. We investigate two possible scenarios of E+A galaxy formation: (1) Galaxy merging producing strong starbursts (e.g., Z96; Bekki 1998; Bekki et al. 2001) and (2) abrupt truncation of star formation in disk galaxies (e.g., Poggianti & Barbaro 1996; Shioya et al. 2004).
5.3.1 Numerical simulations of H gradients
Since the numerical methods and techniques we employ for modelling the chemodynamical and photometric evolution of galaxy mergers and truncated spirals have already been described in detail elsewhere (Bekki & Shioya 1998; Bekki et al. 2001, 2002), we give only a brief review here.
The progenitor disk galaxies that take part in a merger are taken to have a dark halo, a bulge, and a thin exponential disk with a total disk mass () of 6.0 and size () = 17.5 kpc. We adopt the density distribution of the NFW halo (Navarro et al. 1996) suggested from CDM simulations and the radial () and vertical () density profiles of the disk are assumed to be proportional to with scale length = 0.2, and to with scale length = 0.04, respectively. The disk is composed both of gas and stars with a gas mass fraction () of 0.1. The gas is represented by a collection of discrete gas clouds that follow the observed mass-size relationship. Field star formation is modelled by converting the collisional gas particles into collision-less new stellar particles. We adopt the Schmidt law (Schmidt 1959) with exponent = 1.5 (1.0 2.0, Kennicutt 1998) as the controlling parameter of the rate of star formation. We determined the radial gradient of H equivalent width for a remnant of a merger scenario (with a prograde-retrograde orbital configuration) at the post-starburst phase (more than 0.2 Gyr after the peak of the starburst).
For the truncation disk model, to be self-consistent we use the same disk parameters as outlined above. The bulge to disk ratio is 0.5. Star formation is simultaneously and uniformly truncated throughout the entire disk after 2 Gyr of isolated evolution (i.e., no tidal interaction/merging and no triggered starbursts). The resulting disk can contain a large fraction of young stars (i.e., A-type stars). Although our assumption of uniform truncation may be oversimplified, particularly in the case of truncation resulting from cluster-related processes such as ram-pressure stripping of disk gas and halo gas stripping, it is adequate for the present study, and serves to illustrate the remarkable differences in the time evolution of H equivalent width radial gradients between the two E+A models (i.e., merger-induced starburst vs truncation).
5.3.2 Comparison with observed H gradients
The simulated H radial profiles for the galaxy merger and instantaneous truncation models are shown in Fig. 9 and Fig. 10 respectively. For the galaxy merger model in Fig. 9 we over-plot the H measurements for our three negative-gradient galaxies: CN254, CN22 and CN191 (top panel, centre panel and lower panel, respectively). For the instantaneous truncation model we over-plot the observed H values of three of our galaxies with positive and flat gradients: CN849, CN247 and CN228. In both cases we have displayed the H values corrected for convolution with the seeing disk as described in Section 4.3. The errors in the equivalent width measurements after deconvolution were approximated by separately deconvolving the fits to the convolved radial equivalent width profile and comparing the results with the best fit. The observed H measurements are plotted as filled squares and the numerical model profiles as solid lines. For the merger model (Fig. 9) we show the radial H gradient of the merger remnant at times of 0.2, 0.75 and 1.5 Gyrs since the maximal starburst. In the case of the instantaneous truncation model displayed in Fig. 10 we show the H profiles at times 0.2, 0.5 and 1.5 Gyrs after the truncation of star formation.
It is interesting to compare the differences in the radial behaviour of the H absorption line between the merger and truncation models. In the merger model a centralised burst of star formation is produced, when the starburst ends the galaxy is left with a central population of young stars and hence a radial distribution of H equivalent width which is highest in the centre and decreases rapidly with galacto-centric radius (see Gyr profile in Fig. 9). As time progresses after the cessation of star formation the contribution to the integrated light from the youngest stars is diminished, resulting in a decrease in the H equivalent width which causes the radial profile to flatten. At a time Gyr after the maximal starburst the radial H profile has evolved to be flat and uniformly low across the entire extent of the galaxy – the E+A galaxy signature is no longer present. The H profiles shown in Fig. 9 are for a major merger model with a specific orbital configuration. However, it is expected that all tidally induced starbursts will exhibit qualitatively similar behaviour, with the star formation concentrated in the galactic centre, producing a post-starburst galaxy spectrum with a radial H equivalent width profile which decreases with galacto-centric radius. In contrast, the radial behaviour of the H absorption line in the instantaneous truncation model is quite different. Immediately after the truncation of star formation the galaxy has a flat uniformly high H equivalent width profile (see Gyr H equivalent width profile in Fig. 10). The galaxy CN143 exhibits such a profile (compare the radial profile for CN143 in Fig. 8 and Gyr profile in Fig. 10). As the system evolves and the age of the youngest stellar population increases the contribution of the light from this young population of stars decreases. The decrease is most prominent in the centre of the galaxy where there exists a larger fraction of old stars; this results in the H equivalent width decreasing most rapidly in the central regions of the galaxy, leading to a positive H equivalent width gradient which steepens with time.
Given the very different expectations for the behaviour and time evolution of the H equivalent width radial profile in E+A galaxies for the two formation mechanisms discussed (i.e. merger induced starbursts and abrupt truncation of star formation) we propose that the radial distribution of H absorption in E+A’s provides a useful tool in differentiating between these two formation mechanisms. In the sample of eight E+A galaxies examined here we find three galaxies (CN254, CN22 and CN191) which have a negative H gradient. We suggest that this radial behaviour provides evidence that the E+A spectral signature in these galaxies has its origin in a merger or tidal interaction. The remaining five E+A galaxies (CN143, CN89, CN849, CN228 and CN247) have either flat or radially increasing H profiles, these profiles are more consistent with the recent truncation of star formation in normal disk galaxies.
6 Summary
We have obtained IFU spectra for 12 galaxies in AC114 originally classified as E+A systems by CS87, permitting the first investigation of the spatial distribution of H absorption in such galaxies. We summarise our findings as follows:
-
We find global H equivalent width values lower than in the original CS87 sample from which our targets were selected. This is especially the case for the five galaxies which were original assigned an HDS classification by CS87. We attribute this to differences in aperture placement and/or systematic errors in the sky subtraction of the original CS87 sample. Some galaxies appear to have been misclassified based on the original CS87 spectroscopy.
-
Three galaxies in our sample exhibit negative H gradients implying a strong central concentration of young stars. The E+A galaxies in our sample which exhibit this property are CN254, CN22 and CN191. Normal metallicity gradients in galaxies, in which metallicity decreases with galactic radius, would imply an even more significant central concentration, as does correction for the smearing of the galaxy light due to seeing. The distribution of young star light in these galaxies is consistent with the origin of the global E+A signature being the result of a merger or tidal interaction.
-
Three galaxies in the sample, CN143, CN89 & CN247 (which has globally low H ) have a H profile which is statistically consistent with being flat. This profile is consistent with a galaxy observed shortly after the global truncation of its star formation.
-
Two galaxies in the sample show a positive H gradient with H absorption being at its weakest at the centre of the galaxy. The galaxies in this category are CN89 & CN228. These H profiles are consistent with a galaxy which has undergone a global truncation of its star formation within the last 2 Gyrs.
Acknowledgements
M.B.P. was supported by an Australian Postgraduate Award. W.J.C., C.B., and K.B. acknowledge the financial support of the Australian Research Council throughout the course of this work. We wish to thank the referee, Tomotsugu Goto, for a helpful and thorough report which has greatly improved this paper. This research has made use of the NASA/IPAC Extragalactic Database (NED) which is operated by the Jet Propulsion Laboratory, California Institute of Technology, under contract with the National Aeronautics and Space Administration.
References
- Abazajian et al. (2004) Abazajian K., Adelman-McCarthy J. K., Agüeros M. A., Allam S. S., Anderson K. S. J., Anderson S. F., Annis J., Bahcall N. A., Baldry I. K., Bastian S., and 143 coauthors, 2004, AJ, 128, 502
- Abell et al. (1989) Abell G. O., Corwin H. G., Olowin R. P., 1989, ApJS, 70, 1
- Balogh et al. (1999) Balogh M. L., Morris S. L., Yee H. K. C., Carlberg R. G., Ellingson E., 1999, ApJ, 527, 54
- Barger et al. (1996) Barger A. J., Aragon-Salamanca A., Ellis R. S., Couch W. J., Smail I., Sharples R. M., 1996, MNRAS, 279, 1
- Bartholomew et al. (2001) Bartholomew L. J., Rose J. A., Gaba A. E., Caldwell N., 2001, AJ, 122, 2913
- Bekki (1998) Bekki K., 1998, ApJ, 502, L133+
- Bekki (1999) Bekki K., 1999, ApJ, 510, L15
- Bekki et al. (2002) Bekki K., Couch W. J., Shioya Y., 2002, ApJ, 577, 651
- Bekki et al. (2005) Bekki K., Couch W. J., Shioya Y., Vazdekis A., 2005, MNRAS, in preparation
- Bekki & Shioya (1998) Bekki K., Shioya Y., 1998, ApJ, 497, 108
- Bekki et al. (2001) Bekki K., Shioya Y., Couch W. J., 2001, ApJ, 547, L17
- Blake et al. (2004) Blake C., Pracy M. B., Couch W. J., Bekki K., Lewis I., Glazebrook K., 24 coauthors, 2004, MNRAS, in press
- Bruzual & Charlot (2003) Bruzual G., Charlot S., 2003, MNRAS, 344, 1000
- Cardiel et al. (1998) Cardiel N., Gorgas J., Cenarro J., Gonzalez J. J., 1998, A&AS, 127, 597
- Carlberg (1984) Carlberg R. G., 1984, ApJ, 286, 403
- Colless et al. (2001) Colless M., Dalton G., Maddox S., Sutherland W., Norberg P., Cole S., Bland-Hawthorn J., Bridges T., Cannon R., Collins C., and 19 coauthors, 2001, MNRAS, 328, 1039
- Couch (1981) Couch W. J., 1981, Ph.D. Thesis
- Couch et al. (1998) Couch W. J., Barger A. J., Smail I., Ellis R. S., Sharples R. M., 1998, ApJ, 497, 188
- Couch et al. (1994) Couch W. J., Ellis R. S., Sharples R. M., Smail I., 1994, ApJ, 430, 121
- Couch & Newell (1984) Couch W. J., Newell E. B., 1984, ApJS, 56, 143
- Couch & Sharples (1987) Couch W. J., Sharples R. M., 1987, MNRAS, 229, 423
- Davies et al. (1993) Davies R. L., Sadler E. M., Peletier R. F., 1993, MNRAS, 262, 650
- De Filippis et al. (2004) De Filippis E., Bautz M. W., Sereno M., Garmire G. P., 2004, ApJ, 611, 164
- Dressler & Gunn (1983) Dressler A., Gunn J. E., 1983, ApJ, 270, 7
- Dressler & Gunn (1992) Dressler A., Gunn J. E., 1992, ApJS, 78, 1
- Dressler et al. (1999) Dressler A., Smail I., Poggianti B. M., Butcher H., Couch W. J., Ellis R. S., Oemler A. J., 1999, ApJS, 122, 51
- Fabricant et al. (1991) Fabricant D. G., McClintock J. E., Bautz M. W., 1991, ApJ, 381, 33
- Franx (1993) Franx M., 1993, ApJ, 407, L5
- Goto (2005) Goto T., 2005, MNRAS, pp 53–+
- Gunn & Gott (1972) Gunn J. E., Gott J. R. I., 1972, ApJ, 176, 1
- Kennicutt (1998) Kennicutt R. C., 1998, ApJ, 498, 541
- Larson (1974) Larson R. B., 1974, MNRAS, 166, 585
- Mahdavi & Geller (2001) Mahdavi A., Geller M. J., 2001, ApJ, 554, L129
- Martinelli et al. (1998) Martinelli A., Matteucci F., Colafrancesco S., 1998, MNRAS, 298, 42
- Mihos & Hernquist (1996) Mihos J. C., Hernquist L., 1996, ApJ, 464, 641
- Moore et al. (1998) Moore B., Lake G., Katz N., 1998, ApJ, 495, 139
- Navarro et al. (1996) Navarro J. F., Frenk C. S., White S. D. M., 1996, ApJ, 462, 563
- Norton et al. (2001) Norton S. A., Gebhardt K., Zabludoff A. I., Zaritsky D., 2001, ApJ, 557, 150
- Poggianti & Barbaro (1996) Poggianti B. M., Barbaro G., 1996, A&A, 314, 379
- Poggianti et al. (1999) Poggianti B. M., Smail I., Dressler A., Couch W. J., Barger A. J., Butcher H., Ellis R. S., Oemler A. J., 1999, ApJ, 518, 576
- Rose et al. (2001) Rose J. A., Gaba A. E., Caldwell N., Chaboyer B., 2001, AJ, 121, 793
- Salpeter (1955) Salpeter E. E., 1955, ApJ, 121, 161
- Schmidt (1959) Schmidt M., 1959, ApJ, 129, 243
- Searle (1971) Searle L., 1971, ApJ, 168, 327
- Shioya et al. (2004) Shioya Y., Bekki K., Couch W. J., 2004, ApJ, 601, 654
- Thomas et al. (2004) Thomas D., Maraston C., Korn A., 2004, MNRAS, 351, L19
- Tonry & Davis (1979) Tonry J., Davis M., 1979, AJ, 84, 1511
- Vazdekis (1999) Vazdekis A., 1999, ApJ, 513, 224
- Worthey & Ottaviani (1997) Worthey G., Ottaviani D. L., 1997, ApJS, 111, 377
- Yang et al. (2004) Yang Y., Zabludoff A. I., Zaritsky D., Lauer T. R., Mihos J. C., 2004, ApJ, 607, 258
- Zabludoff et al. (1996) Zabludoff A. I., Zaritsky D., Lin H., Tucker D., Hashimoto Y., Shectman S. A., Oemler A., Kirshner R. P., 1996, ApJ, 466, 104

