Discovery of an X-ray–Luminous Galaxy Cluster at 11affiliation: Based on observations obtained with XMM-Newton, an ESA mission with contributions from NASA 22affiliation: Based on observations obtained at the European Southern Observatory using the ESO Very Large Telescope on Cerro Paranal (ESO programs 72.A-0706, 73.A-0737, 74.A-0023 and 274.A-5024)
Abstract
We report the discovery of a massive, X-ray-luminous cluster of galaxies at =1.393, the most distant X-ray–selected cluster found to date. XMMU J2235.3–2557 was serendipitously detected as an extended X-ray source in an archival XMM-Newton observation of NGC 7314. VLT-FORS2 and band snapshot imaging reveals an over-density of red galaxies in both angular and color spaces. The galaxy enhancement is coincident in the sky with the X-ray emission; the cluster red sequence at identifies it as a high-redshift candidate. Subsequent VLT-FORS2 multi-object spectroscopy unambiguously confirms the presence of a massive cluster based on 12 concordant redshifts in the interval . The preliminary cluster velocity dispersion is km s-1. VLT-ISAAC and band images underscore the rich distribution of red galaxies associated with the cluster. Based on a 45 ks XMM-Newton observation, we find the cluster has an aperture-corrected, unabsorbed X-ray flux of ergs cm-2 s-1, a rest-frame X-ray luminosity of ergs s-1 (0.5–2.0 keV), and a temperature of keV. Though XMMU J2235.3–2557 is likely the first confirmed cluster found with XMM-Newton, the relative ease and efficiency of discovery demonstrates that it should be possible to build large samples of clusters through the joint use of X-ray and large, ground-based telescopes.
Subject headings:
galaxies: clusters: general — X-rays: general1. Introduction
There is a strong impetus in astronomy to discover and investigate objects at ever increasing redshifts in order to probe the state of the Universe at increasingly earlier stages of cosmic history. Such observations allow us to construct evolutionary sequences which ultimately reveal the underlying mechanisms and parameters that define the Universe. The high-redshift push is acutely applicable to the study of galaxy clusters. Their density evolution and distribution on large scales are very sensitive to the cosmological framework. Furthermore, clusters play a key role in tracking the formation and evolution of massive early-type galaxies. It is important to recognize that the leverage on both the derived cosmological parameters and the efficacy of evolutionary studies is greatly enhanced as we probe to higher redshifts.
X-ray selection is currently the optimal technique for constructing large well-defined samples of distant clusters (see review by Rosati, Borgani, & Norman, 2002). However infrared large-area surveys may well become a complementary approach (e.g., Eisenhardt et al., 2004). The present status of X-ray cluster samples is due in large part to numerous ROSAT-based surveys. We now have definitive local samples () totaling 1000 clusters (e.g., REFLEX; Böhringer et al., 2004) and high-redshift samples totaling a few hundred clusters (e.g., 160SD; Vikhlinin et al., 1998; Mullis et al., 2003). Galaxy clusters were routinely discovered at , and occasionally at . However, the domain has been largely unexplored. Only five X-ray–emitting clusters are known here (Stanford et al., 1997; Rosati et al., 1999; Stanford et al., 2002; Rosati et al., 2004; Hashimoto et al., 2004); four of which are from the RDCS survey of Rosati et al. (1998).
It is now possible to redress the lack of knowledge of galaxy clusters at using XMM-Newton, which features unprecedented sensitivity, high angular resolution and wide-field coverage. Several general surveys are underway (e.g., Romer et al., 2001; Pierre et al., 2004; Schwope et al., 2004). We briefly describe here the first high-redshift discovery resulting from our pilot program, which is specifically focused on the identification of galaxy clusters using XMM-Newton.
2. X-ray Selection and Analysis
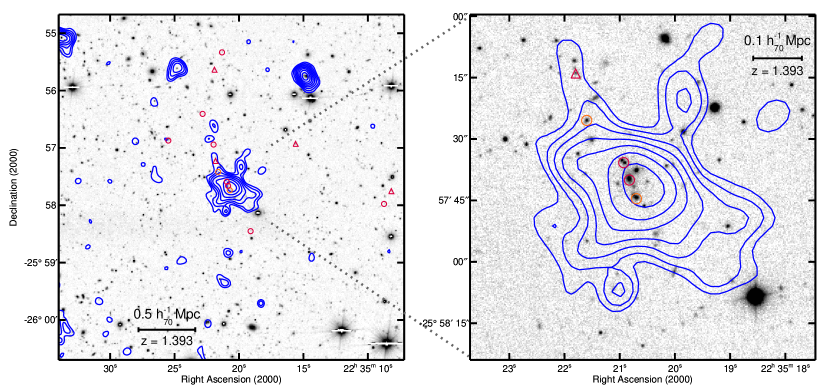
We have initiated a search for distant, X-ray luminous clusters through the serendipitous detection of extended X-ray emission in archival XMM-Newton observations with exposure times 20 ks. Our ultimate objective is to construct an X-ray flux-limited sample of tens of galaxy clusters at . A more immediate goal has been to develop a rapid and efficient observational strategy to identify the most distant systems (). One of the noteworthy objects identified in our initial test fields is XMMU J2235.3-2557 which is detected in a 45 ks XMM-Newton observation of the Seyfert 1.9 galaxy NGC 7314. The source is located at 7.7′ off-axis in the observation recorded on 2 May 2001 (obsid 0111790101). As demonstrated by the X-ray flux contours in Figure 1, this source is extended on arcminute scales and is clearly resolved in comparison to the prominent X-ray point source to the north-west and 2.3′ further off-axis. The X-ray centroid of XMMU J2235.3–2557 in equatorial coordinates is which corresponds to a Galactic latitude of . Extended X-ray sources at high Galactic latitudes are almost exclusively galaxy clusters.
Our X-ray analysis is restricted to the two EPIC-MOS detectors since the EPIC-pn detector was operated in small window mode to avoid pile-up and to permit rapid variability observations of NGC 7314, and thus did not image the location of XMMU J2235.3–2557. The available data are equivalent to a 22.5 ks observation with all three detectors. An effective integration time of 38 ks remains after screening periods of high background. Counts were extracted from a 50″ radius circular region centered on the source; the background was estimated locally using three source-free circular apertures (″120) flanking XMMU J2235.3–2557. There are 280 net source counts in the 0.3–4.5 keV band for the combined MOS detectors (M1+M2). This corresponds to an unabsorbed aperture flux of ( ergs cm-2 s-1 in the 0.5–2.0 keV energy band modeling the source with a 6 keV thermal spectrum (details presented in § 4). Measurement errors are given at the 68% confidence interval () throughout.
XMMU J2235.3–2557 was also serendipitously detected in a ROSAT PSPC observation (1WGA J2235.3-2557; White et al., 1994). The ROSAT flux of ( ergs cm-2 s-1 (0.5–2.0 keV) is in excellent agreement with our XMM-Newton result. This source was not followed up by the ROSAT-era cluster surveys because its extent is poorly constrained by ROSAT data and its flux is fainter than most survey flux limits.
3. Optical Follow-up Observations
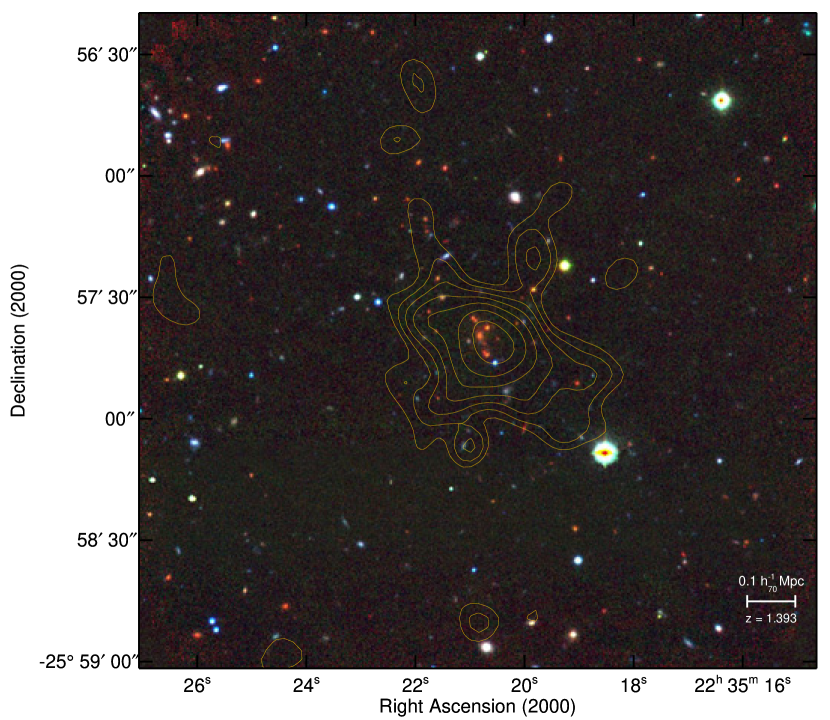
To reject the possibility of a relatively low-redshift cluster (), we examined the location of XMMU J2235.3–2557 in the second epoch Digitized Sky Survey and found the region devoid of any galaxy over-density. To further constrain the redshift in an efficient manner, we acquired relatively short-exposure images in the (1140s) and (480s) bands using VLT-FORS2 on 2 October 2003. These images, combined with a subsequently obtained deep VLT-ISAAC -band image (3600s, 9–11 December 2004), are shown as a 2.5′ 2.5′ color composite in Figure 2. The discovery imaging reveals a significant over-density of faint, very red galaxies spatially coincident with the peak of the extended X-ray emission. Note that the brightest cluster galaxy (BCG) has an extended surface brightness profile typical of massive cluster cDs.
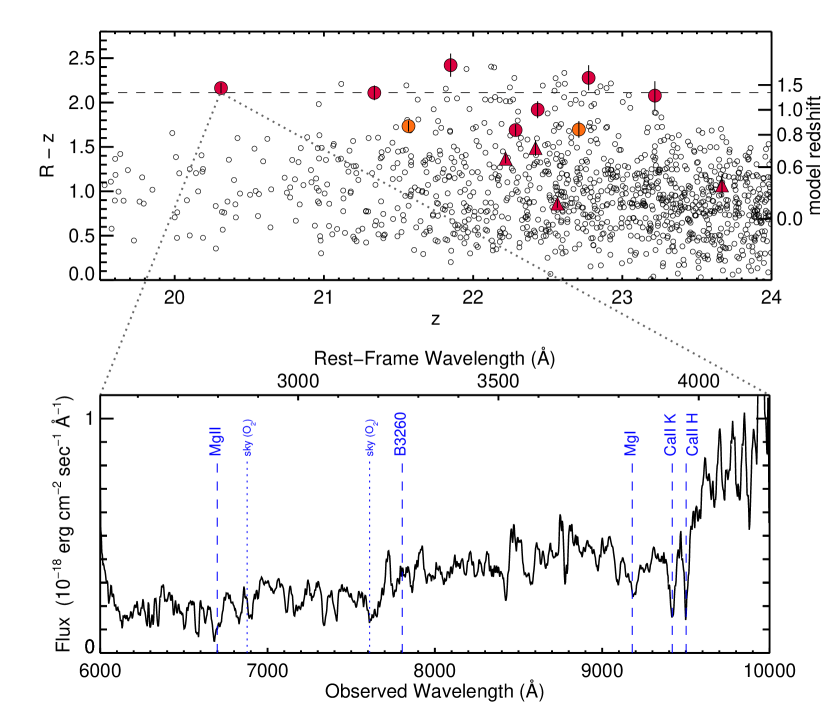
We plot in the top panel of Figure 3 the optical/NIR color-magnitude diagram of the galaxies detected in the 7′ 7′ -band image. The central cluster galaxies clearly delineate the bright end of the cluster red sequence at a color of . Given a realistic galaxy model, we can use the location of the red sequence as a reliable distance indicator (e.g., Kodama & Arimoto, 1997; Gladders & Yee, 2000). Assuming cluster ellipticals form via monolithic collapse at and then passively evolve to the observed redshift (e.g., Daddi, Cimatti, & Renzini, 2000), we derive a color-redshift transformation indicated on the right-side ordinate of the color-magnitude diagram. Thus the observed red sequence color of XMMU J2235.3–2557 corresponds to a redshift of .
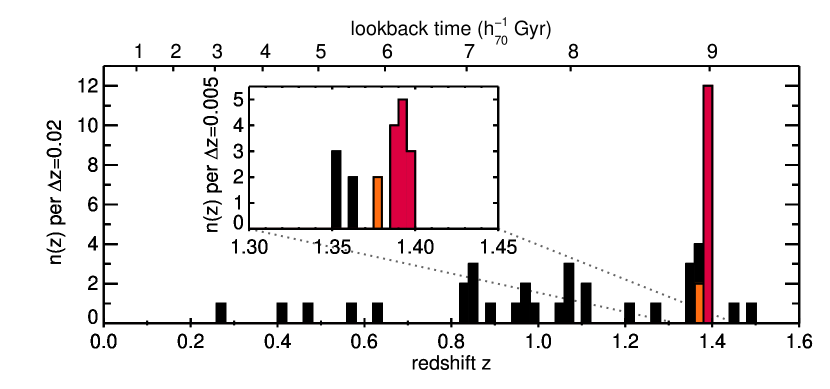
To confirm this very high redshift estimate, we obtained spectroscopic data from two VLT-FORS2 MXU multi-object slit-masks observed on 11 & 15 October 2004. The result of a four-hour integration on the BCG is shown in the middle panel of Figure 3. We measure 12 secure redshifts in the range with =1.393 and a preliminary velocity dispersion of km s-1, corrected for cosmological expansion (see histogram in bottom panel of Figure 3). These spectroscopically confirmed cluster members are marked in red in Figures 1 & 3.
4. Discussion
Here we address a few fundamental characteristics of XMMU J2235.3–2557 based on the discovery datasets. Due to the space limitations of this Letter, we must defer a broad and in-depth discussion to a forthcoming paper. At this cluster is the most distant bona-fide X-ray luminous cluster known to date, and it lies well beyond the redshift range () of the only 5 previously known distant X-ray clusters (all from ROSAT). Note that by advancing to , we can now look 0.5 Gyr further back compared to the previous limit. This is quite significant given the relevant formation time scales ( Gyrs) for the stellar populations in massive cluster galaxies.
With the cluster redshift in hand, we can derive additional X-ray properties of XMMU J2235.3–2557. We estimate the temperature of the intra-cluster medium via a joint fit to the M1+M2 spectra over the 0.3–4.5 keV energy range. Assuming a thermal model (MEKAL) with a metallicity of 0.3 solar, a Galactic absorption column of cm-2 and fixing the cluster redshift at , we find keV. As noted in § 2, the cluster flux within a 50″ radius aperture based on this model is ( ergs cm-2 s-1 (0.5–2.0 keV). At the cluster redshift this aperture corresponds to a physical radius of 421 kpc. If the cluster emission profile follows the typical King profile with a slope of and a core radius of 140 kpc, then the photometry aperture encloses 74.9% of the flux. Thus the total flux is ( ergs cm-2 s-1 and the cluster rest-frame luminosity is ( ergs s-1 (0.5–2.0 keV). This high X-ray luminosity and the high rate of spectroscopic identification (high richness) suggest that XMMU J2235.3–2557 is likely more massive than RDCS1252–29 (previously the most massive, distant cluster known at ).
Examining the projected distribution of red galaxies, those with colors similar to the spectroscopically confirmed cluster members, we see in general that there is a higher density of objects to the north of the cluster core versus to the south. Note this asymmetry is exaggerated in the confirmed members due to bias inherent to the design of the spectroscopy slitmasks which were based on the relatively shallow discovery images. For example, an 30″ band of right ascension beginning 15″ south of the X-ray peak was undersampled due to the dithering pattern required to fill the gap between the FORS2 CCDs. The BCG and X-ray centroid are offset by 3.7″, or 31 kpc at the cluster redshift, along a northwest-southeast vector. We must be cautious with our interpretation until deeper X-ray data and additional spectroscopy are available. However, the alignment of the BCG–X-ray offset vector with the northwest/southeast spurs in the X-ray morphology and the filament of red galaxies leading out of the core to the northeast may indicate a recent subcluster merger along this corridor.
XMMU J2235.3–2557 is fairly isolated in redshift space (Figure 3). Note that there are two galaxies at shown in orange in Figures 1 & 3. One of these () is just outside the formal velocity boundary defining cluster membership (). Both galaxies are close in projection to the cluster core and likely part of the local structure field immediately surrounding the main cluster. The five galaxies at are roughly situated along a declination band 2.5′ south of the cluster. Four of these fall within a 1.7′-diameter circle but there is no significant X-ray emission in this region.
5. Conclusions
XMMU J2235.3–2557 () is the most distant X-ray–selected cluster thus far discovered. Based on its high X-ray luminosity, ICM temperature, and optical/NIR richness, this galaxy cluster is very likely the most distant and most massive () structure known to date. It provides an unprecedented opportunity to test models of the evolution and formation of the most massive galaxies and clusters in high-density environments at the largest look-back time currently accessible. Fundamental to this pursuit are high-quality datasets including wide infrared coverage, high-resolution imaging from space, optical spectroscopy & dedicated X-ray follow-up.
A remarkable and exciting aspect of the discovery of XMMU J2235.3–2557 is the overall efficiency of telescope use from first detection to spectroscopic confirmation. Our experience demonstrates: 1) a massive, cluster is easily detectable in a typical XMM-Newton observation of 20 ks, and 2) the red cluster sequence provides a reliable distance indicator (out to at least ) which can be measured in less than 30 minutes with a red-sensitive CCD on an 8m-class telescope. In the search for clusters, the second point is crucial for rejecting the large number of foreground clusters and economizing the costly optical follow-up. Given the relative ease of discovery, we predict the detection of clusters will become routine in the near future.
References
- Böhringer et al. (2004) Böhringer, H., et al. 2004, A&A, 425, 367
- Daddi et al. (2000) Daddi, E., Cimatti, A., & Renzini, A. 2000, A&A, 362, L45
- Eisenhardt et al. (2004) Eisenhardt, P. R., et al. 2004, ApJS, 154, 48
- Gladders & Yee (2000) Gladders, M. D. & Yee, H. K. C. 2000, AJ, 120, 2148
- Hashimoto et al. (2004) Hashimoto, Y., Barcons, X., Böhringer, H., Fabian, A. C., Hasinger, G., Mainieri, V., & Brunner, H. 2004, A&A, 417, 819
- Kodama & Arimoto (1997) Kodama, T. & Arimoto, N. 1997, A&A, 320, 41
- Mullis et al. (2003) Mullis, C. R., et al. 2003, ApJ, 594, 154
- Pierre et al. (2004) Pierre, M., et al. 2004, JCAP, 9, 11
- Romer et al. (2001) Romer, A. K., Viana, P. T. P., Liddle, A. R., & Mann, R. G. 2001, ApJ, 547, 594
- Rosati et al. (2002) Rosati, P., Borgani, S., & Norman, C. 2002, ARA&A, 40, 539
- Rosati et al. (1998) Rosati, P., della Ceca, R., Norman, C., & Giacconi, R. 1998, ApJ, 492, L21
- Rosati et al. (1999) Rosati, P., Stanford, S. A., Eisenhardt, P. R., Elston, R., Spinrad, H., Stern, D., & Dey, A. 1999, AJ, 118, 76
- Rosati et al. (2004) Rosati, P., et al. 2004, AJ, 127, 230
- Schwope et al. (2004) Schwope, A., et al. 2004, Advances in Space Research, 34, 2604
- Stanford et al. (1997) Stanford, S. A., Elston, R., Eisenhardt, P. R., Spinrad, H., Stern, D., & Dey, A. 1997, AJ, 114, 2232
- Stanford et al. (2002) Stanford, S. A., Holden, B., Rosati, P., Eisenhardt, P. R., Stern, D., Squires, G., & Spinrad, H. 2002, AJ, 123, 619
- Vikhlinin et al. (1998) Vikhlinin, A., McNamara, B. R., Forman, W., Jones, C., Quintana, H., & Hornstrup, A. 1998, ApJ, 502, 558
- White et al. (1994) White, N. E., Giommi, P., & Angelini, L. 1994, IAU Circ., 6100, 1