HST Observations of Heavy Elements in Metal-Poor Galactic Halo Stars
Abstract
We present new abundance determinations of neutron-capture elements Ge, Zr, Os, Ir, and Pt in a sample of 11 metal-poor (–3.1 [Fe/H] –1.6) Galactic halo giant stars, based on Hubble Space Telescope UV and Keck I optical high-resolution spectroscopy. The stellar sample is dominated by -process-rich stars such as the well-studied CS 22892-052 and BD +17∘3248, but also includes the -process-poor, bright giant HD 122563. Our results demonstrate that abundances of the 3rd -process peak elements Os, Ir and Pt in these metal-poor halo stars are very well-correlated among themselves, and with the abundances of the canonical -process element Eu (determined in other studies), thus arguing for a common origin or site for -process nucleosynthesis of heavier (Z 56) elements. However, the large (and correlated) scatters of [Eu,Os,Ir,Pt/Fe] suggests that the heaviest neutron-capture -process elements are not formed in all supernovae. In contrast, the Ge abundances of all program stars track their Fe abundances, very well. An explosive process on iron-peak nuclei (e.g., the -rich freeze-out in supernovae), rather than neutron capture, appears to have been the dominant synthesis mechanism for this element at low metallicities – Ge abundances seem completely uncorrelated with Eu. The correlation (with very small scatter) of Ge and Fe abundances suggests that Ge must have been produced rather commonly in stars – even at early times in the Galaxy – over a wide range of metallicity. The Zr abundances show much the same behavior as Ge with (perhaps) somewhat more scatter, suggesting some variations in abundance with respect to Fe. The Zr abundances also do not vary cleanly with Eu abundances, indicating a synthesis origin different than that of heavier neutron-capture elements.
Detailed abundance distributions, for CS 22892-052 and BD +17∘3248, combining the new elemental determinations for Os-Pt and recently published Nd and Ho measurements, show excellent agreement with the solar system -process curve from the elements Ba to Pb. The lighter -capture elements, including Ge, in general fall below the same solar system -process curve that matches the heavier elements.
1 Introduction
Elemental abundances in metal-poor Galactic halo stars are providing evidence of the earliest Galactic nucleosynthesis history and clues about the identities of the first stellar generations, the progenitors (or predecessors) of the halo stars. The neutron-capture (-capture) elements – formed in slow (-process) and rapid (-process) neutron-capture nucleosynthesis – were synthesized in these first stars and later ejected into the interstellar medium and eventually incorporated into the halo stars (see recent reviews by Cowan & Thielemann 2004; Truran et al. 2002; Sneden & Cowan 2003; Cowan & Sneden 2004).
The focus of -capture abundance studies in metal-poor stars has been to examine correlations among these elements in an attempt to help to identify the sites of nucleosynthesis for these elements and also to trace their evolution with Galactic metallicity. Most of the previous studies in this field have focused on the rare-earth elements (e.g., Ba and Eu) that are easily detectable with ground-based telescopes. Such studies have indicated a consistency, or scaling, (for -process-rich stars) between the total -capture elemental abundances and the solar system -process-only abundances. Until recently, however, it has not been possible to examine the full range of the -capture elements, as many of them have dominant transitions in the near UV that are accessible only to telescopes such as the Hubble Space Telescope (HST). With the Space Telescope Imaging Spectrograph (STIS), it is now possible to make reliable abundance determinations of the heaviest stable -capture elements (such as Pt) to determine whether the relative scaling of the rare-earth elements extends through the 3rd-process peak, and also to examine some of the lighter, less-investigated elements such as Ge.
In this paper we report the first large-sample abundance determinations of the abundances for the elements Ge, Zr, Os and Pt using HST, supplemented by Keck I High Resolution Echelle Spectrograph (HIRES) observations of the very heavy -capture element Ir, in a group of 11 metal-poor halo stars. In §2 we present the spectroscopic data, in §3 we describe the abundance analyses, and in §4 we discuss the correlations among the elements and the implications for stellar nucleosynthesis and Galactic chemical evolution. In this section we also revisit the detailed elemental abundance distributions for the two well-studied -process-rich stars CS 22892-052 and BD +17∘3248, followed by our conclusions in §5.
2 Observations and Reductions
High-resolution ultraviolet spectra were gathered with the Hubble Space Telescope Imaging Spectrograph (HST/STIS). The instrumental setup included the echelle grating E230M centered at 2707 Å, an entrance aperture of 0.20.06, and the near-UV MAMA detector. These components yielded spectra in the wavelength range 2410 Å 3070 Å with a spectral resolving power of R 30,000. One to five individual spectra were obtained during the HST visit for each program star, depending on the target brightness. The observing sequence was a standard routine that included target acquisition, peakup, and integration(s). No special calibration exposures were needed.
Standard HST pipelines produced the one-dimensional, flat-fielded, wavelength-calibrated spectra from the individual stellar integrations. Algorithms implemented in the IRAF111 IRAF is distributed by the National Optical Astronomy Observatory, which is operated by the Association of Universities for Research in Astronomy, Inc., under cooperative agreement with the National Science Foundation. software system were then used to reformat these spectrum files into standard FITS spectral images, and to combine the integrations to produce final spectra. The signal-to-noise ratios (S/N) of the spectra were difficult to estimate accurately because of the strong-lined nature of the stars in the UV wavelength region. From comparisons of synthetic and observed spectra we estimate that S/N 50 in the spectral regions of interest.
We supplemented these data with visible-region high resolution spectra obtained with the Keck I HIRES (Vogt et al. 1994). This instrument was configured to produce complete spectral coverage in interval 3150 Å 4600 Å at a resolving power of R 45,000, and 30 S/N 200 (a steadily increasing function with increasing wavelength for these cool target stars, which were with a CCD system not optimized for near-UV response). We obtained auxiliary lamp spectra for flat-fielding and wavelength calibration of the spectra. The echelle extractions, including flat-field and bias correction, cosmic-ray rejection, sky subtraction, and wavelength and flux calibration, were accomplished with the software package MAKEE (e.g., Barlow & Sargent 1997).
3 Abundance Analysis
3.1 Model Stellar Atmospheres
For the stars CS 22892-052 and BD +17o3248, recent and detailed analyses have been performed by Sneden et al. (2003) and Cowan et al. (2002); their parameters have been adopted here. The stars HD 6755, HD 115444, HD 122563, HD 122956, HD 186478, and HD 221170 were analyzed with the stellar models used by Simmerer et al. (2004). The remaining stars (HD 6268, HD 1265887, and HD 175305) were assigned stellar models based on methods used in Simmerer et al. The details of these parameter selection methods are outlined in that paper and are summarized here.
The grid of Kurucz stellar atmosphere models with no convective overshoot (Castelli et al. 1997) were employed. We interpolated these to the set of stellar parameters using software provided by A. McWilliam (1990, private communication) and I. Ivans (2002, private communication).
The stellar parameters (effective temperature , surface gravity log , metallicity as represented by [Fe/H], and microturbulence vt) were then checked against standard spectroscopic constraints.
-
•
: When possible, effective temperatures were taken from Alonso et al. (1999,2001), who give values for their calibration stars (which include HD 6755, HD 122563, HD 122956, HD 186478, and HD 221170). These temperatures were then checked against the spectroscopic constraint that the equivalent widths (EWs) of Fe I lines be uncorrelated with the excitation potentials of the lines. The Alonso et al. temperatures for those stars were all consistent with that requirement. Effective temperatures were calculated for the remaining stars (HD 6268, HD 115444, HD 126587, and HD 175305) with the Alonso et al. calibrations for infrared color indices. The IR colors were taken from the 2MASS database, as transformed to a system consistent with Alonso et al. (see Simmerer et al. section 3.3.1).
-
•
Surface gravity: log may be derived from the standard relation involving , absolute magnitude, and mass (e.g., Simmerer et al. 2004). Most giant stars are too distant to have a well determined parallax (and hence absolute magnitude), so we used the MV derived by Anthony-Twarog & Twarog (1994) for HD 122563, HD 122956, HD 186478, and HD 221170. The surface gravity for HD 6775 was calculated from its HIPPARCOS parallax (Perryman et al. 1997), as this star is close enough to have a well-determined value (though the HIPPARCOS distance is consistent with that of Anthony-Twarog & Twarog). The derived gravities were then checked spectroscopically by requiring that the abundances of Fe from Fe I and Fe II be essentially equal (see Thevenin & Idiart 1999). The Anthony-Twarog & Twarog values for these stars all met that criterion. The remaining four stars also had distance estimates from Anthony-Twarog & Twarog (1994), which we used to calculate surface gravities.
-
•
Metallicity: A small list of Fe I and Fe II lines was used to check the derived stellar effective temperatures and surface gravities. This list was also used to assess the [Fe/H] metallicity. As per the discussion in Thevenin & Idiart (1999), the Fe ionization equilibrium may not be correctly described by the LTE Saha formula. We therefore report both [Fe I/H] and [Fe II/H] abundances in Table HST Observations of Heavy Elements in Metal-Poor Galactic Halo Stars. Note that Thevenin & Idiart considered relatively high-gravity stars, and a thorough investigation of nLTE effects in low gravity, low metallicity stars has yet to be published. Examples of attempts in this area include those of Gratton et al. (1999) and Korn (2004). These authors suggest that nLTE departures in abundances for stars of interest here may not be large, but the uncertainties in such analyses do not permit definitive conclusions to be reached on this issue.
The metallicity of the model atmosphere usually was set 0.25 dex higher than the derived Fe abundance to account for additional opacity from the -capture elements (whose abundances are enhanced at low metallicities). The [X/Fe] ratios in Table 2 are calculated with [Fe II/H]. For HD 6268, HD 115444, HD 1265887, and HD 175305, we used the [Fe/H] reported by Burris et al. (2000) and then applied the offsets found by Simmerer et al. (2004) to recover Fe I and Fe II abundances. This results in an offset of +0.04 dex (for Fe II) and -0.08 dex (for Fe I) from the [Fe/H] found in Burris et al. (2000).
-
•
Microturbulence: vt was set be requiring that log be uncorrelated with the abundance for Fe I lines. Microturbulence values for the four stars not included in Simmerer et al. (2004) were set to 2.0 km s-1, a typical value for stars in this , log domain.
3.2 Transition Data
In cool stellar atmospheres germanium, osmium, iridium and platinum can only be detected in their neutral species, whose strongest transitions occur in the UV spectral region ( 3500 Å). Such UV lines are the sole abundance indicators of these elements in metal-poor stars. Spectra in this wavelength domain are extremely complex mixes of overlapping atomic and molecular features. No completely unblended features of Ge I, Os I, and Pt I exist at the spectral resolution of our HST/STIS data. Therefore synthetic spectrum computations were employed in all of the abundance determinations of this paper.
Construction of atomic and molecular line lists has been discussed in several of our previous papers; see Sneden et al. (1996, 2003) and Cowan et al. (2002) for overviews and application to -process-rich metal-poor giant stars. Sneden et al. (1998) describe in detail and show illustrative spectra of several of the UV features that are employed here. Briefly, we combined laboratory data for the lines of interest with data for other atomic and molecular hydride features taken from the Kurucz (1995)222Available at http://kurucz.harvard.edu/ database to form the initial line lists. Then repeated syntheses of the solar spectrum (Delbouille, Neven, & Roland 1973)333Available at http://mesola.obspm.fr/solar_spect.php for 3000 Å, and of the spectrum of the very metal-poor, -capture-deficient giant star HD 122563 (obtained as part of this program), were used to refine the often poorly-known transition probabilities of the atomic contaminants. The line strengths of molecular hydrides (predominantly OH, less often CH and NH) were varied together by changing the CNO abundances of the individual stars until acceptable matches with the observed spectra are obtained.
In this procedure, no alterations were permitted to the laboratory data for the Ge I, Os I, Ir I, and Pt I lines. Here we comment on the lines of each species employed in this survey and the sources of their laboratory data.
Germanium: The best germanium abundance indicator is the Ge I 3039.07 Å line. Following the discussion of Cowan et al. (2002), we adopted the Biémont et al. (1999) value. As Cowan et al. noted, two other strong Ge I lines at 2651.17 and 2651.57 Å can be detected in the spectra of our program stars. Unfortunately, they comprise parts of a large blended absorption feature stretching over 2 Å, and we could not derive reliable germanium abundances from these lines. Their line strengths do roughly correlate with that of the 3039 Å line; probably they could become useful transitions with higher resolution (R 60,000) spectra.
Zirconium: Several Zr II lines are detectable on our HST spectra, allowing a link to be made with spectral features of this species seen in the visible spectral region. Cowan et al. (2002) and Sneden et al. (2003) have already demonstrated that consistent abundances of Zr can be obtained from UV and ground-based spectra. Biémont et al. (1981) published reliable -values for many Zr II lines, but unfortunately their study did not extend to wavelengths below 3400 Å. Therefore, for the 3036.39+3036.51 Å blend, and for the lines at 3054.84, 3060.12, and 3061.33 Å, we adopted the transition probabilities recommended by Kurucz (1998), who adjusted the original Corliss & Bozman (1962) values to conform with the Bíemont et al. scale.
Osmium: We analyzed the 2838.63 and 3058.18 Å Os I lines, the same ones used in our original HST/GHRS study of osmium in metal-poor giants (Sneden et al. 1998). Spectra of these two lines are displayed in that paper’s Figure 2. We also added the line at 3301.57 Å, which has been shown to be a reliable Os I abundance indicator in -process-rich stars (Cowan et al. 2002, Sneden et al. 2003). Transition probabilities for the 3058 and 3301 Å lines were adopted from the recent laboratory analysis of Ivarsson et al. (2003): log = –0.45, and log = –0.74. These values are very close to those used in our previous studies (–0.43, and –0.75, respectively; Kwiatkowski et al. 1984). No recent laboratory study of the 2838 Å Os I line exists, so we adopted the value used by Sneden et al. (1998): log = +0.11, from Corliss & Bozman (1962) scaled to the Kwiatkowski et al. lifetime system. None of the osmium lines are strong in the program star spectra, obviating the need for hyperfine and isotopic substructure calculations.
Iridium: We used the same Ir I transitions as did Cowan et al. (2002): 3220.76, 3513.65, and 3800.12 Å. The original study employed values based on the lifetime measurements of Gough, Hannaford, & Lowe (1983) and branching ratios from Corliss & Bozman (1962). Happily, Ivarsson et al. (2003) also have provided transition probabilities for two of the lines: log = –1.21, and log = –1.44, which are in excellent agreement with the older values of –1.26 and –1.45, respectively. We adopted the Ivarsson et al. values for these lines (see further remarks in the appendix), and log = -0.52 for the third line (Gough et al. 1983).
Platinum: Den Hartog et al. (2005) have recently completed a new laboratory transition probability analysis of Pt I; their values are adopted here. That study also searched for the cleanest and strongest lines in our program star BD +17∘3248, originally studied in detail by Cowan et al. (2002). This halo giant star was considered the most favorable case for Pt I detections, as it combines low metallicity ([Fe/H] = –2.1), large -capture/Fe abundance ratios (e.g., [Eu/Fe] +0.9), relatively high temperature ( = 5200 K, which results in substantially weakened molecular contaminating features), and excellent high-resolution spectra in hand from 2500 Å through 7000 Å. Of the 127 Pt I lines with newly-determined values, Den Hartog et al. found only 11 useful features for their platinum abundance study of BD +17∘3248, and recommended only the relatively unblended lines at 2646.68, 2659.45, and 2929.79 Å for application to other metal-poor stars. Those lines were employed in the present study.
Hyperfine and isotopic splitting of Pt I transitions must be taken into account because the stronger lines can be on the damping part of the curve-of-growth. Platinum has six naturally occurring isotopes existing in solar-system percentages of: 192Pt, 0.8%; 194Pt, 32.9%; 195Pt, 33.8%; 196Pt, 25.3%; and 198Pt, 7.2%. The total isotopic splitting for some Pt I lines can be as large as 0.03 Å. Additionally, the 195Pt lines split into 3–4 hyperfine structure components that can have total separations of as much as 0.09 Å. Wavelengths and values of the resulting total of 8–9 transition subcomponents have been taken from Table 7 of Den Hartog et al. (2005). The solar isotopic mix has been adopted in all calculations. In principle, - and -process -capture nucleosynthesis could produce different isotopic platinum mixes. However, this element is a nearly pure -process element in solar-system material (95%, in the most recent / breakdown of Simmerer et al. 2004). Therefore, adoption of the solar-system platinum isotopic abundances is appropriate for the generally -process-rich stars of the present sample.
Lanthanum and Europium: These two rare earth elements (Z = 57 and 63, respectively), often employed in investigations of the - and -processes in the early Galaxy, were employed here to compare with the newly determined very light and very heavy -capture elements. Six of our program stars were included in the Simmerer et al. (2004) La and Eu survey, and their abundances are adopted here. For stars HD 126587 and HD 175305 we have ground-based Keck I HIRES spectra, so we used synthetic spectrum computations, with the model atmospheres described above and the line lists of Simmerer et al., to derive these abundances from the La II 3988.51, 3995.75, 4086.71, 4123.22, and 4333.75 Å and the Eu II 3819.67, 3907.11, 3971.97, 4129.72, and 4205.04 Å transitions. For BD+17o3248 and CS 22892-052, we adopted the La and Eu abundances of Cowan et al. (2002) and Sneden et al. (2003), respectively. The only star unavailable to us for these elements was HD 6268. We chose to employ the abundances of Burris et al. (2000) rather than the more recent study of Honda et al. (2002) because the model atmosphere used in our study has nearly the same parameters as those of Burris et al.
3.3 Abundances of Ge, Zr, Os, and Pt
Abundances were derived from synthetic/observed spectrum matches for one line of Ge I, four lines of Zr II, and three lines each of Os I, Ir I, and Pt I. The abundances from individual lines are listed in Table 1 Stellar Model Parameters, and the mean abundances are in Table 2. The low metallicity halo giant star HD 165195 ( = 4235 K, log = 0.8, [Fe/H] = –2.4; Simmerer et al. 2004) was originally observed as part of our HST/STIS program, but in the end it was discarded. Its temperature is about 300 K lower than any of the other stars, producing a very strong-lined UV spectrum in spite of its low metallicity. No reliable abundances could be determined for this star.
Very few transitions have been used in the derivation of each element’s abundance. All lines are at least partially blended in our program stars, and many are weak features. Therefore our mean abundance estimates given in Table 2 have been computed according to the following rules. Uncertain abundances from individual lines (designated with colons in Table 1 Stellar Model Parameters) have been given equal weight with other abundances. For a couple of stars where only upper limits could be determined for some elements, the lowest values for the upper limits have been quoted in Table 2. For Os I, the 2838 Å line is given half-weight; it may be blended with an unidentified contaminant, since in the strongest-lined stars it often yields a much larger abundance than do the 3058 and 3301 Å lines.
Each of the three Ir I lines has some blending issues that can limit the iridium abundance reliability. The 3800.12 Å line is always very weak in the program stars, and it lies in the large wing of the H I 3797.9 Å Balmer line. The 3513.65 Å line is stronger, but unfortunately it is sandwiched in between the very strong 3513.49 Å Co I and 3513.83 Å Fe I lines; see Figure 1 (lower panel) of Sneden et al. (2000) for the appearance of this feature in CS 22892-052. However, iridium abundances derived from syntheses of these two lines are well-correlated in all program stars. The 3220.76 Å line should be the intrinsically strongest transition. However, attempts to synthesize this feature with inclusion of only Ir I absorption yielded iridium abundances that were 0.3-0.4 dex larger than the means of the abundances derived from the 3513 and 3800 Å lines. Additionally, the observed feature appears to be significantly contaminated by another absorber at approximately 3220.72 Å, which could be an Fe I line listed in the Kurucz (1998) database. We arbitrarily set the -value of this line to a value that provided a reasonable total fit to the overall feature in typical program stars, but the derived iridium abundance uncertainties here remain large, so the 3220 Å line abundance is entered at half-weight into the final averages.
The Pt I 2646 Å line also appears to be significantly blended in the stronger-lined stars, compared to the 2659 and 2909 Å lines. It too is entered into the means with half-weight.
3.4 Uncertainties
In much of our previous work on -capture-rich stars we have concentrated on the rare-earth elements, 57 Z 72. Nearly all detectable transitions of these elements in cool stars arise from low excitation levels of the first ions. Since the ionization potentials of the rare earths are relatively low (5.5–6.8 eV), these elements exist almost exclusively as the first ions. In LTE the Boltzmann and Saha factors are essentially the same for all rare-earth transitions, leading to almost zero sensitivity to and log in the element-to-element abundance ratios (e.g., see Table 3 of Westin et al. 2000).
Most of the species of the present study arise from low excitation levels of the neutral atoms. Therefore, abundance inter-comparisons among Ge, Os, Ir, and Pt also have little sensitivity to model atmosphere parameters. Linking these abundances to those of the rare earths, however, involves a neutral versus first ion comparison. The average first ionization potential, I.P.(Ge,Os,Ir,Pt) 8.5 eV, is significantly larger than the values for most Fe-peak elements. Thus these elements exist substantially as Ge I, Os I, Ir I, and Pt I. Their responses to changes in atmospheric parameters are different than those of Fe-peak neutral species. Repeated computations with variations in , log , [M/H], and vt for these elements as well as for typical Fe I and Eu II lines yielded the following average abundance variations (rounding to the nearest 0.05 dex) in the atmospheric parameter domain of our program stars. For = 150 K: [Fe/H] 0.15, [Eu/H] 0.10, [Ge,Os,Ir,Pt/H] 0.20, or [Eu/Fe] 0.05 and [Ge,Os,Ir,Pt/Fe] 0.05. For log = 0.3: [Fe/H] 0.15, [Eu/H] 0.05, [Ge,Os,Ir,Pt/H] 0.00, or [Eu/Fe] 0.10 and [Ge,Os,Ir,Pt/Fe] 0.15. There is negligible dependence on metallicity through variations of this model parameter by [M/H] 0.30. Finally, the -capture transitions under consideration here are relatively weak, limiting microturbulence dependence to 0.1 dex for vt = 0.2 km s-1.
Given these dependencies, the total influence of atmospheric parameter uncertainties in the abundance ratios of Ge, Os, Ir, and Pt to Fe or Eu is 0.20. Adding in typical uncertainties of fit in matching synthetic and observed spectra of 0.15 yields total suggested abundance uncertainties of 0.25. However, abundance ratios taken simply among Ge, Os, Ir, and Pt should be more reliable, since they all arise from low-excitation states of the neutral species. In particular, the very low relative abundances of Ge to the Os-Ir-Pt group or to Fe cannot be explained away from atmospheric parameter uncertainties.
The Zr abundances have been derived from low-excitation ionized-species transitions, and thus can be compared directly to Eu abundances with little concern about model atmosphere uncertainties. This element has been studied in many of our stars using Zr II lines at longer wavelengths. In Table 3 we summarize the comparisons between our HST-based Zr abundances and other results. For the present study, Zr abundances have been derived from synthetic/observed spectrum matches of the Zr II lines at 3998.96, 4050.33, 4090.51, 4208.98, and 4496.97 Å lines appearing our Keck HIRES-I data. For nine stars with both UV and visible-wavelength spectra, we derive [Zr/Fe] = –0.08 0.06 ( = 0.17), where [Zr/Fe] is in the sense HST/STIS Keck I HIRES. The survey of Burris et al. (2000) has eight stars in common with the present work, for which we derive [Zr/Fe] = –0.08 0.06 ( = 0.17), in the sense this study Burris et al.. Some individual stars have been subjected to very detailed analyses. Inspection of Table 3 suggests that the HST/STIS Zr abundances are systematically lower than most visible-wavelength literature values by 0.1 dex. This offset cannot be pursued further here, because modern lab studies of the lines of Zr II have yet to be accomplished.
4 Discussion
Our new observations – HST/STIS spectra of the elements Ge, Zr, Os and Pt, and Keck I HIRES spectra of Ir – allow us to make -capture abundance comparisons among the sample of metal-poor Galactic halo stars. We have also incorporated these new detections with previously determined values for other elements to obtain detailed -capture elemental abundance distributions for the well-studied and -process rich stars CS 22892-052 and BD +17∘3248.
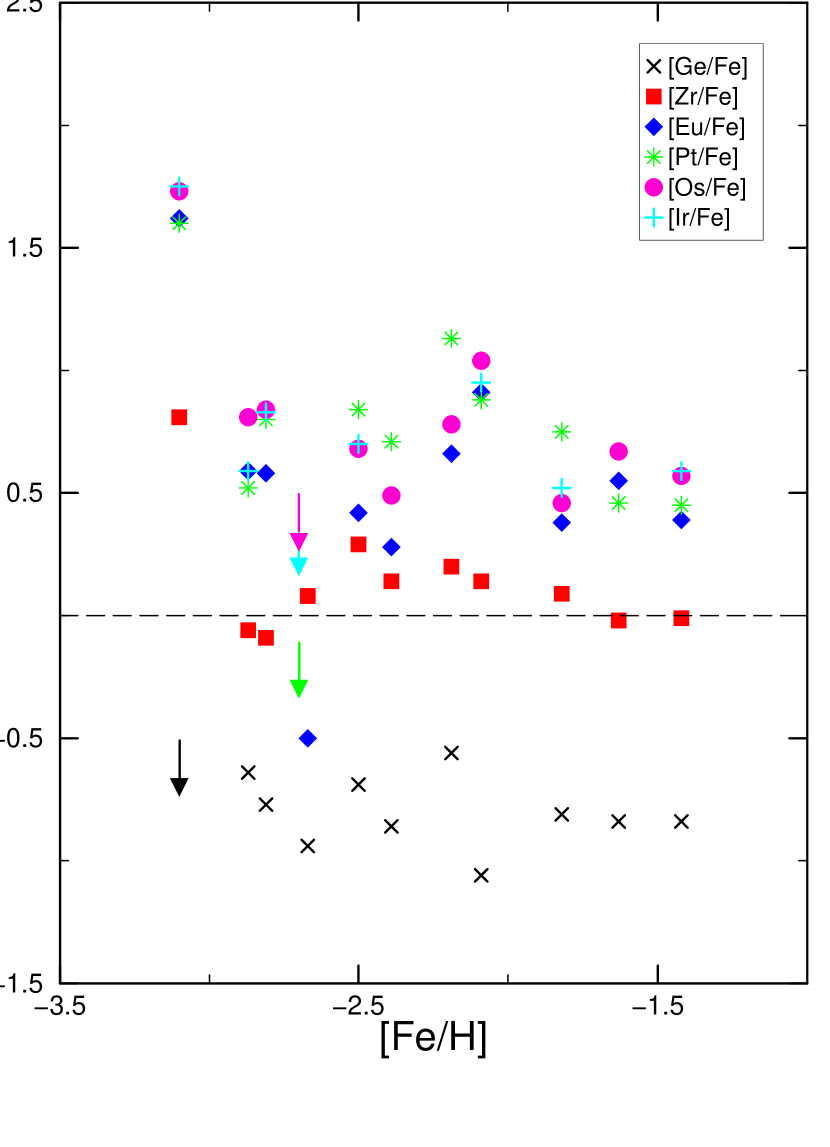
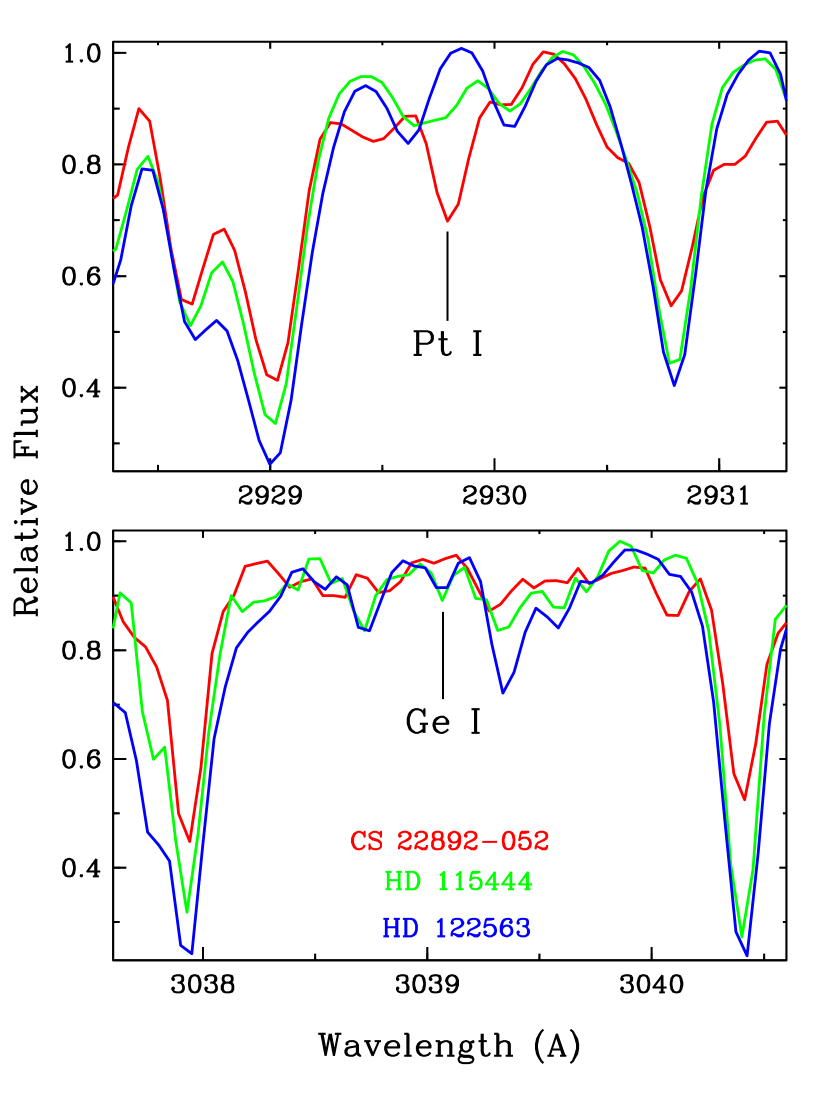
In Figure 1 the entire abundance set is summarized by plotting relative abundance ratios [El/Fe] versus [Fe/H] metallicities. A rough progression of increasing abundance ratio with increasing atomic number is evident: large deficiencies of the light -capture element Ge in all program stars; weak or no enhancements of the intermediate-mass element Zr in all stars except the extreme -process-rich star CS 22892-052; and large overabundances of the heaviest elements Os, Ir, and Pt in all stars except the -process-poor star HD 122563. A similar conclusion may be seen in Figure 2, in which we show the observed spectra of three stars with contrasting -process abundance levels: HD 122563 ([Fe I/H] = –2.61, [Eu/Fe] = –0.50; see Tables HST Observations of Heavy Elements in Metal-Poor Galactic Halo Stars and 2, and their literature references); HD 115444 (([Fe I/H] = –2.71, [Eu/Fe] = +0.58); and CS 22892-052 (([Fe I/H] = –3.09, [Eu/Fe] = +1.62). While the relative absorption strengths of the Pt I lines of these three stars qualitatively track the [Eu/Fe] values (top panel), no such correlation is seen in the Ge I line strengths (bottom panel). In fact, CS 22892-052 has the largest [Eu/Fe] value but clearly the weakest Ge I feature. In the following subsections we amplify and interpret these observational results.
4.1 Abundances of the Heaviest -Capture Elements
Earlier work (Cowan et al. 1996; Sneden et al. 1998, 2003) used HST with STIS and the Goddard High Resolution Spectrograph to detect 3rd -capture-peak (e.g., Pt) in a few individual metal-poor halo stars. Our new abundance data for Os, Ir, and Pt allow us to make the first moderate-sample systematic study of the heaviest stable -capture elements, and to compare them with the -capture element Eu, which is synthesized almost entirely in the -process.
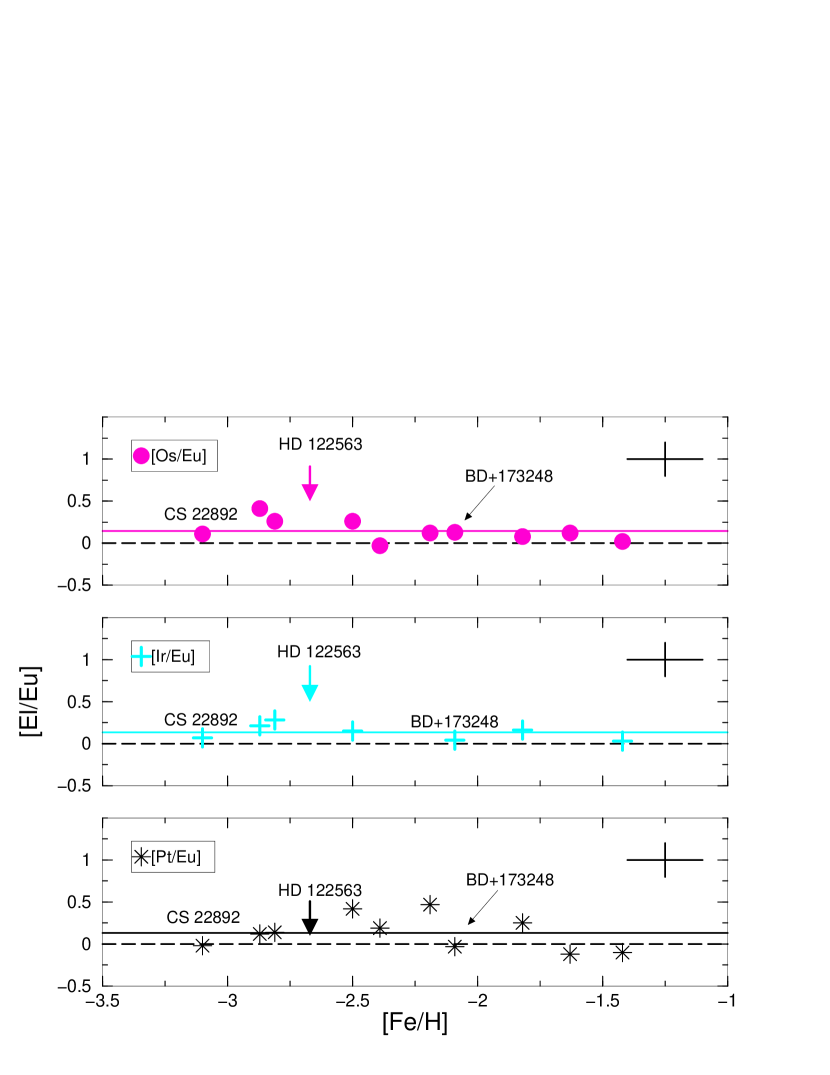
We make direct comparisons of Os, Ir, and Pt abundances with Eu in the three panels of Figure 3. While the ratios [El/Fe] shown in Figure 1 all indicate substantial overabundances of these three elements, the comparisons to Eu in Figure 3 demonstrate the clearly correlated abundance behavior of Eu, Os, Ir, and Pt. The very small deviations from [El/Eu] = 0.0 indicated by the solid horizontal lines of each panel ([Os/Eu] = +0.15, = 0.12; [Ir/Eu] = +0.13, = 0.09;, and [Pt/Eu] = +0.13, = 0.20) suggest that the solar-system -process abundance distribution is mimicked in our sample (and possibly all) -process-rich stars born in the early Galactic halo. We regard the mean +0.15 dex offset as observationally indistinguishable from [El/Eu] = 0.0; see the uncertainty discussion of §3.3. These very-heavy-element abundance comparisons strongly suggest a similar synthesis origin for Eu, Os, Ir, and Pt in the -process sites that were the progenitors to the observed halo stars.
We also want to note the La/Eu ratios listed in Table 2 (see also the discussion in §3.2). In solar system material La (dominantly an -process element, see Simmerer et al. 2004) is more abundant than the -process element Eu. As is seen in the data compiled in Table 2, however, [La/Eu] = –0.4, clearly indicating that all of the stars in our sample are -process-rich. (See Simmerer et al. for further discussion of the synthesis of La in these stars.)
4.2 The Light -Capture Elementals Germanium and Zirconium
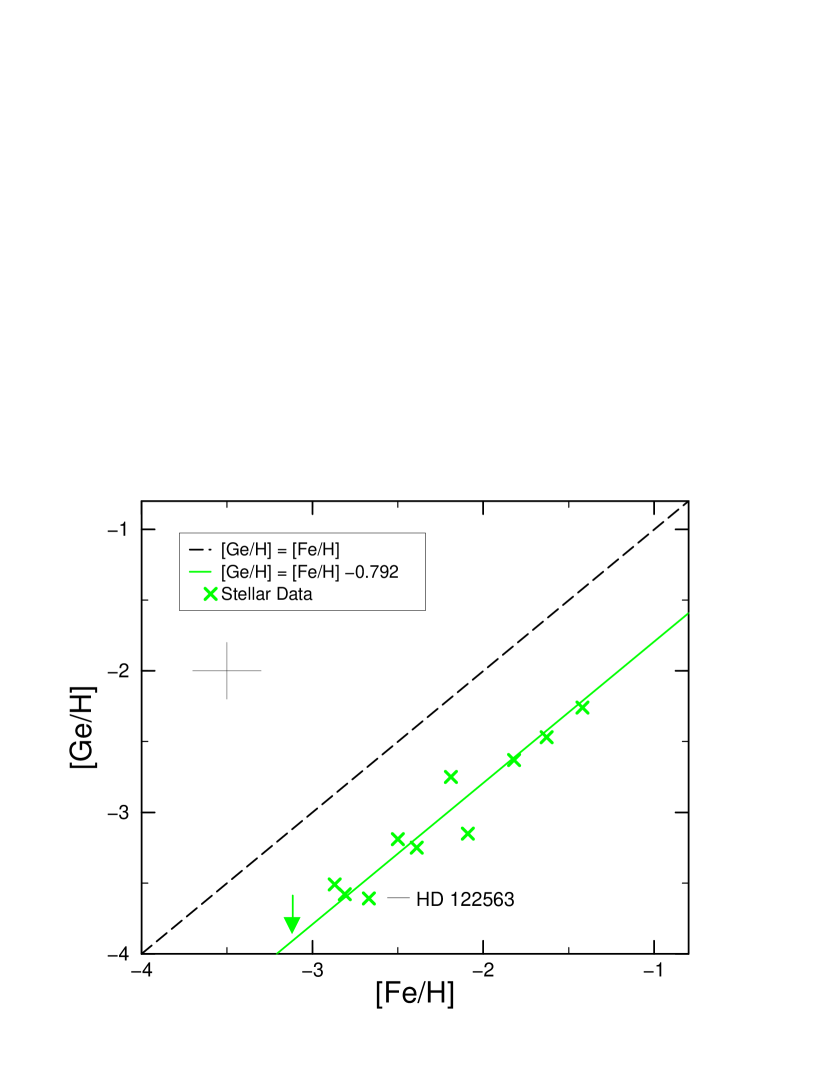
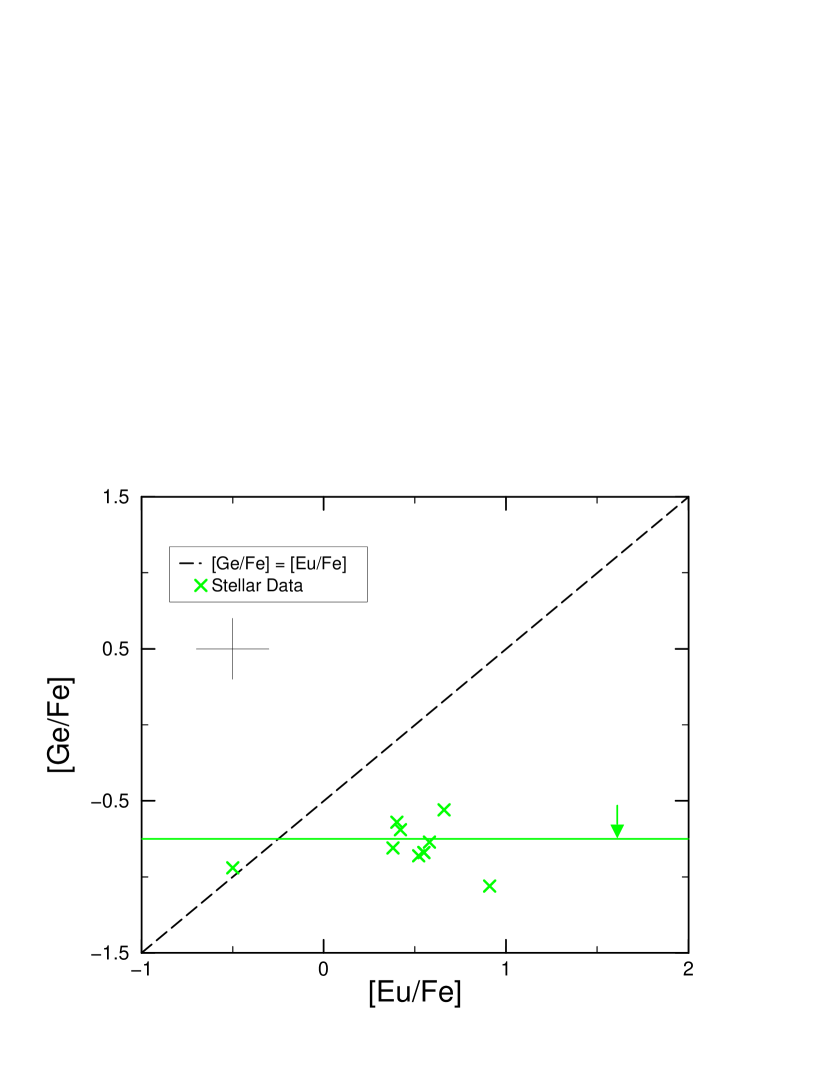
In Figure 4 we plot [Ge/H] values with respect to the traditional metallicity indicators [Fe/H]. It is easy to see that the Ge abundances scale with metallicity but at a depressed (with respect to solar) level: [Ge/H] = [Fe/H] – 0.790.04 ( = 0.14). Further supporting this interpretation are abundance comparisons of Ge with respect to the -capture element Eu that we illustrate in Figure 5. If Ge and Eu were correlated, the abundances would fall along the straight (diagonal) line illustrated in the figure. Obviously the abundances of Ge seem to be uncorrelated with those of the -process element Eu. In fact, [Ge/Fe] for the -process poor star HD 122563 is comparable to the values found for -process (i.e., Eu) rich stars, including the upper limit for CS 22892-052. While -capture processes are important for Ge production in solar system material (e.g., Simmerer et al. 2004), these abundance comparisons immediately suggest a different origin for this element early in the history of the Galaxy.
Our abundance data appear to be more consistent with an explosive (or charged-particle) synthesis for Ge. This might occur as a result of capture on iron-peak nuclei, perhaps during the so-called “-rich freeze-out” in a supernova environment. However, calculations to date (Nakamura et al. 1999; Hoffman et al. 2001; Heger & Woosley 2002; Umeda & Nomoto 2005; Chieffi & Limongi 2004) have difficulties explaining the observed trends in [Ge/Fe]. Indeed, the trends in iron-peak nuclei revealed in Cayrel et al. 2004) strongly suggest the occurrence of a rather dramatic alpha-rich freeze associated with the earliest and most metal-deficient stellar populations, down to at least a metallicity level [Fe/H] -4 (Truran et al. 2005). The strong temperature (density) dependence of this process indicates that fine tuning may be required to fit the observations. This may explain the fact that existing studies have not reproduced the trends. It is interesting to note, in this regard, that the trends seen in the two ”hyper”-iron-poor stars (Frebel et al. 2004; Christlieb et al. 2004) do not appear to be consistent with the extrapolation of those reflected in the Cayrel et al. (2004) study below [Fe/H] -4. This contribution to Ge synthesis appears to be the dominant production mechanism at low metallicities. Of course, un-tracebly small contributions from - and/or -process production cannot be ruled out (but significant -process production is not expected at [Fe/H] –2). At higher metallicities and the onset of the -process, it would be expected that the Ge production would increase sharply and no longer be correlated with the iron production (Gallino, private communication).
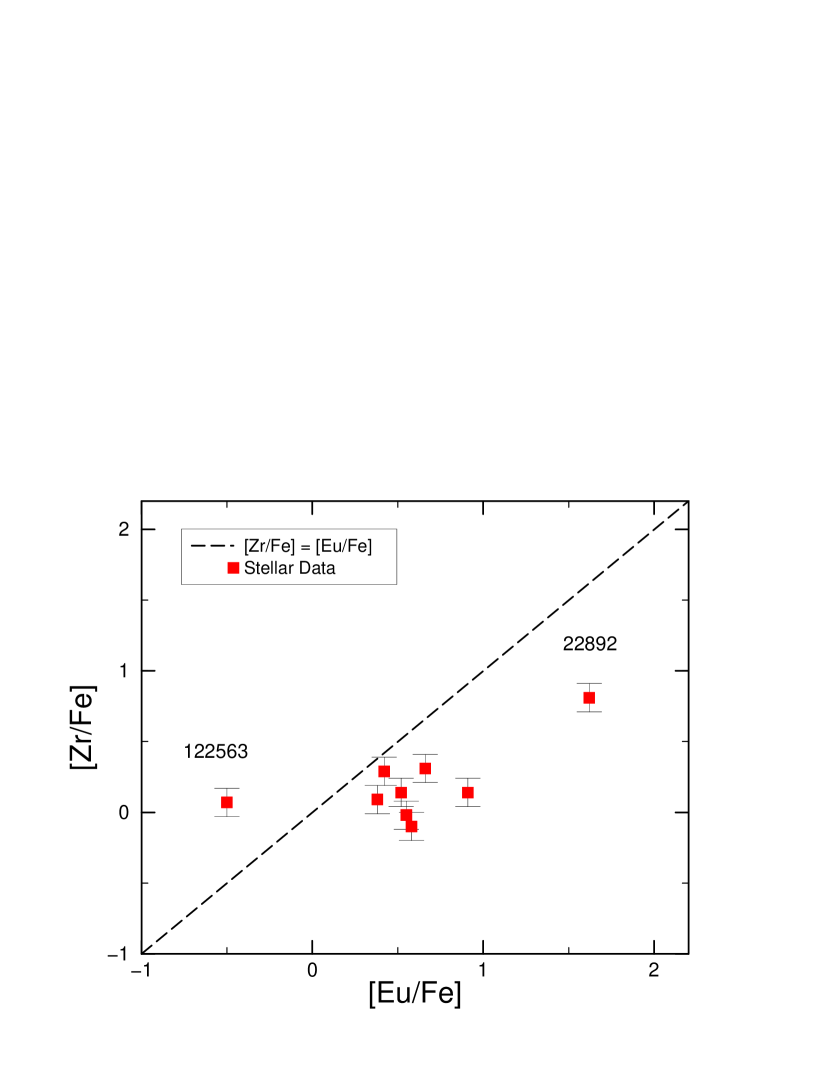
We make a similar abundance comparison of Zr versus Eu for our sample of stars in Figure 6. As discussed in §3.3, we note that the Zr abundances obtained with HST/STIS are well correlated with the ground-based abundances of this element. The abundance data, excluding CS 22892-052, show very little scatter and appear to be uncorrelated with Eu – this includes stars with [Eu/Fe] 1.0. The exception is CS 22892-052, for which [Zr/Fe] is substantially higher than in, for example, HD 122563. The Zr and Eu abundances, however, do not follow a clearly linear correlation in the figure. This again would seem to indicate a different synthesis origin for these two elements, something recently discussed in more detail by Travaglio et al. (2004). Their more extensive abundance analysis suggests that known -capture processes can explain some of the production of Zr, but that the nucleosynthetic origin of this element is different than that for heavier -capture elements such as Ba and Eu. Furthermore, Travaglio et al. argue that an additional (lighter element) primary process is also responsible for some fraction of the synthesis of Sr and Y. We note finally that in addition to our abundance determination for CS 22892-052, the halo giant CS 31081–001 (the Hill et al. 2002 “uranium” star) also has very enhanced [Eu/Fe] [Zr/Fe]. It may be that in these very -process-enhanced stars, this kind of -capture nucleosynthesis contribution overwhelms the light primary process proposed by Travaglio et al. – perhaps as a result of fission recycling. We note that the relative constancy of [Zr/Fe] with both [Fe/H] and [Eu/Fe] supports the conclusion of Johnson and Bolte (2002) - based on the constancy of the ratio [Y/Zr] with respect to [Zr/Fe] and [Ba/Fe] - that the source of Zr in metal-poor stars must be the same for both the -process-rich and -process-poor stars.
4.3 Heavy Element Abundance Scatter
The heavy element abundance patterns presented here exhibit striking differences as a function of metallicity. The linear correlation (with very small scatter) of Ge and Fe abundances suggests that Ge must have been produced rather commonly in stars – even at early times in the Galaxy – over a wide range of metallicity. The Zr abundances show much the same behavior as Ge with (perhaps) somewhat more scatter, suggesting some variations in abundance with respect to Fe. The pattern of the heavy -capture elements Eu, Os, Ir and Pt is however very different than that of Ge and Zr. There is a very large star-to-star scatter in the abundance values with respect to iron, particularly at low metallicity – a factor of 100 at [Fe/H] –2.5. (We note that while there is only one star, HD 122563, in our sample with a very low [Eu/Fe] ratio, observations (see e.g., Burris et al. 2000) have indicated other such stars. At higher metallicities this scatter diminishes dramatically. This general notion is of course not new, having been seen previously for Eu (see e.g., Gilroy et al. 1988; Burris et al. 2000; Sneden & Cowan 2003). This is the first clear indication that 3rd -process peak elements also show the same scatter.
These apparently conflicting trends can be explained by assuming that at early times (and some low metallicities) the Galaxy was chemically inhomogeneous with some regions containing larger amounts of -process ejecta than others. Then at higher metallicities (and later times) these differences in the total abundance levels would be minimized – this would be as a result of a higher number of events, which would produce an abundance average, and probably mixing throughout the Galaxy. Thus, from Ge to Zr to Eu-Os-Ir-Pt we might be witnessing decreasing event statistics, i.e., a smaller number of (supernova) sites at very low metallicities, which create these elements (Cowan & Thielemann 2004 and references therein). This might further indicate that not all supernovae, or at least those that make lighter -capture elements like Ge and Zr, are responsible for synthesizing the heavier -capture elements (these -process events would have been rare) at very low metallicities early in the history of the Galaxy. Such abundance comparisons and scatter (e.g., [Eu/Fe] versus [Fe/H]) are also providing new clues into the earliest stars and the chemical evolution of the Galaxy (e.g., Wasserburg & Qian 2000; Fields, Truran & Cowan 2002) and the nature of and site for the -process, particularly early in the Galaxy (Argast et al. 2004).
4.4 Elemental Abundance Distributions in Individual Stars
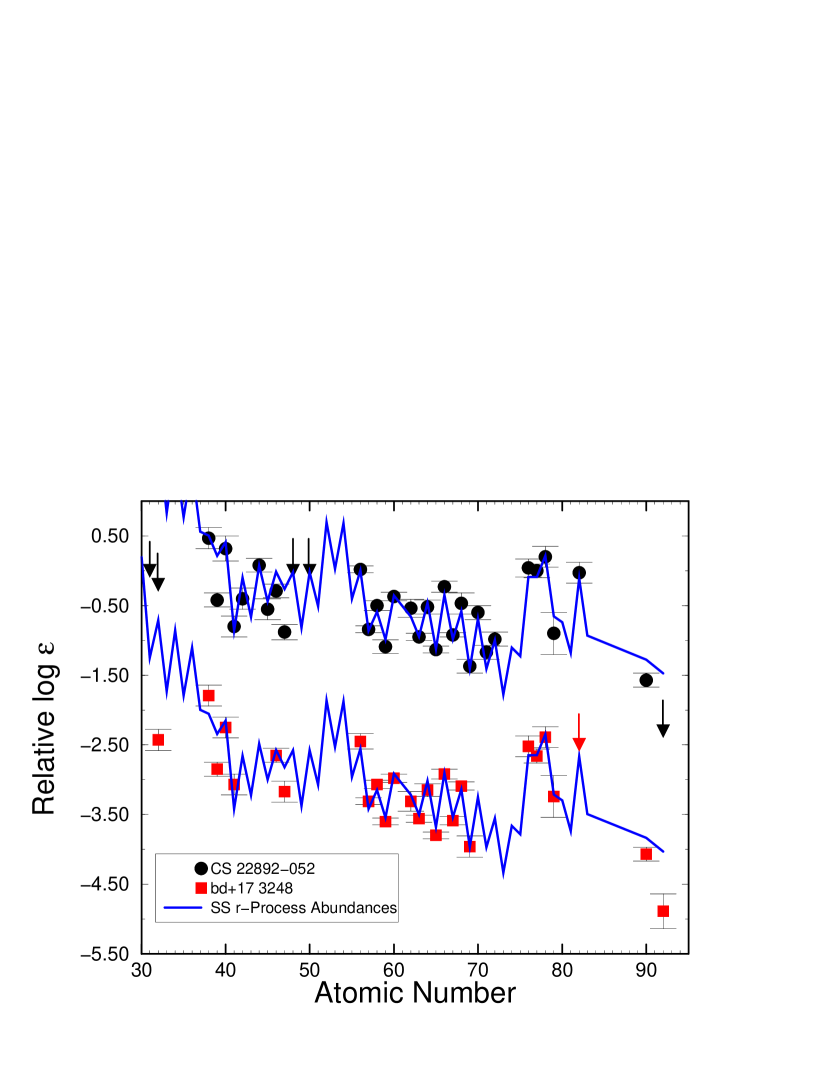
Two of our sample stars are the very -process rich stars CS 22892-052 and BD +17∘3248. Employing our new observations and new, more reliable abundance determinations for Nd (Den Hartog et al. 2003) and Ho (Lawler, Sneden, & Cowan 2004), we have updated and supplemented the (ground-based and HST) abundances previously obtained for CS 22892-052 (Sneden et al. 2003) and BD +17∘3248 (Cowan et al. 2002). We show in Figure 7 the detailed abundance distributions for both of these stars. The values for BD +17∘3248 have been arbitrarily displaced downward for display purposes. We also show for comparison the solar system -process abundances (solid lines), determined based upon the classical -process model and utilizing the most recent -/-process deconvolution reported by Simmerer et al. (2004). Several points are worth noting in this figure. The agreement between the rare earth elements (e.g., Ba and Eu) and the solar system -process abundances is now seen to extend into, and includes, the 3rd -process peak elements Os–Pt in CS 22892-052 and BD +17∘3248. Note that employing the new atomic experimental data of Den Hartog et al. (2005) results in a shift downward of 0.1 dex – with respect to the previously determined value – in the abundance of Pt. This element (along with Os and Ir) now falls on the same scaled solar system -process curve that also matches the abundances of the rare-earth elements such as Eu, strengthening the apparent synthesis connection between these heavier -capture elements.
Our new, more reliable abundance determinations for the elements Nd and Ho are also consistent with the solar system -process distribution. However, as shown in Figure 7, the abundances of elements with Z 56 (i.e., below Ba) in general fall below the scaled solar -process curve for CS 22892-052. There is very little data available for BD +17∘3248 in this region of 40 Z 50, but its Ag abundance, in particular, is much less than the scaled solar-system -process curve. Only upper limits on Ge and Ga were obtained with HST for CS 22892-052, but those abundances fall far below the solar curve, as does the Ge abundance in BD +17∘3248. This indicates that there may be two processes and may suggest two astrophysical sites for -process nucleosynthesis – with one for lighter and another for the heavier -capture elements. This possibility was suggested earlier (see Wasserburg, Busso, & Gallino 1996 and Wasserburg & Qian 2000) with supernovae with different masses and frequencies responsible for the two ends of the -capture abundance distribution. Other models have suggested neutron-star binary mergers as one of the possible sites, particularly for the heavier -capture elements where supernovae models have had difficulties in achieving the required high entropies (Freiburghaus et al. 1999; Rosswog, Rosswog, & Thielemann 1999; but see Argast et al. 2004). In addition to a combination of supernovae and neutron-star mergers, it has been suggested that the light and heavy -capture elements could also be synthesized in the same core-collapse supernova (Cameron 2001; see also recent reviews by Cowan & Sneden 2004 and Cowan & Thielemann 2004 for further discussion).
5 Conclusions
We have made new detections of the elements Ge, Zr, Os, and Pt with HST (STIS), along with Ir using Keck I (HIRES), in a sample of metal-poor Galactic halo stars. These are the first large-sample abundance determinations of these elements in such stars. The abundances of the elements Os, Ir and Pt, in the 3rd-process peak appear to be correlated among themselves and with Eu – the extensively observed, rare-earth, -process element – indicating a similar nucleosynthesis origin and site. In contrast the Ge abundance appears to scale with iron in the halo stars and is independent of the Eu abundances in those stars. This suggests an explosive, rather than -capture, synthesis for this element in stars at very low metallicities. Perhaps this might be the result of some type of alpha-rich freeze out in SNe early in the history of the Galaxy – at higher (e.g., near solar) metallicities, and later times, it would be expected that - and -process production would dominate production. The Zr abundances in the sample stars do not in general scale with metallicity, nor with the Eu abundances, suggesting a different origin for this element than for the heavier -capture elements. The one exception is for the very -process rich (high Eu abundance) star CS 22892-052, where there is a significant increase in the Zr abundance. This element, however, has a complicated synthesis with perhaps several processes contributing (see e.g., Travaglio et al. 2004).
The star-to-star abundance scatter among the elements is quite different, with the lighter element Ge showing very little scatter over the range of metallicity studied. This suggests a common origin - most SNe making this element - even at very low metallicities. Zr like Ge also shows little scatter with iron except for the case again of CS 22892-052. It has been shown previously that [Eu/Fe] exhibits a large star-to-star scatter as a function of metallicity (see e.g. Burris et al. 2000). Our results are the first demonstration that the abundances of the 3rd-process elements Os-Ir-Pt to iron coincide with and exhibit a similar scatter to [Eu/Fe], again suggesting a similar origin for these four elements. These new elemental abundance scatter data also appear to be consistent with the idea that not all supernovae will make Eu (and Os-Pt) – these appear to be rarer events than the synthesis of, for example, Ge and Zr – and to point to a lack of chemical homogeneity early in the history of the Galaxy.
The new abundance determinations for Os-Ir-Pt fall on the same solar system scaled -process curves as the rare-earth elements in the -process rich stars CS 22892-052 and BD +17∘3248. This agreement (or consistency) now extends from Ba through the 3rd-process peak for these stars, again indicating a similar synthesis origin for these elements. The observed abundances of the lighter -capture elements (Ge and Zr) do not fall on the same solar curve that matches the heavier such elements, and may indicate two sites, or at least astrophysical conditions, for the synthesis of all of the -capture elements.
While the astrophysical site for the -process has still not been precisely identified (see e.g., Cowan & Thielemann 2004), the abundance determinations presented here are consistent with a supernova origin and suggest that not all supernovae may be responsible for synthesizing these -capture elements. However, additional abundance determinations –particularly over a range of mass number including both lighter and heavier -capture elements – in stars of very low metallicity will be needed to constrain models of -process production, determine if there are multiple sites and to understand the history of element, and star, formation at very early times in the history of the Galaxy.
Appendix A Substructure of Neutral Iridium Transitions
Hyperfine and isotopic structure of Ir I lines must be included in the synthesis of stellar spectra for accurate abundance determinations. Complete (reconstructed) line structure patterns of the three most important Ir I lines are given in Table 4 for the users’ convenience. Wavenumbers of transitions were taken from the improved energy levels (Ivarsson et al. 2003) and from Moore (1971) for the 3220 Å line. The air wavelengths were computed from the energy levels using the standard index of air (Edlén 1953, 1966).
Solar system isotopic abundances for Ir from Rosman & Taylor (1998) were used. Both 191Ir and 193Ir have nuclear spin F = 3/2. The first half of the listed components for each line are all from 191Ir and the second half are from 193Ir. The component strengths from 191Ir always sum to the solar system abundance of 0.37272 (within rounding error) and the component strengths from 193Ir sum to 0.62728 (within rounding error). Relative component strengths would need to be modified to model non-solar isotopic abundances. The isotope shift in the 3513 Å line of –0.071 cm-1 for 193Ir with respect to 191Ir was adopted from Murakawa & Suwa (1952), and that in the 3220 Å and 3800 Å lines of –0.00095 cm-1 and –0.064 cm-1, respectively, were adopted from Sawatzky & Winkler (1989). Negative isotope shifts, where the heavier isotope is to the red of the lighter isotope, are common for heavy elements because the field shift from a non-negligible nuclear size overwhelms the normal and specific mass shifts.
We took hyperfine A and B constants for the ground level from Büttgenbach et al.’s (1978) extremely accurate atomic-beam magnetic-resonance measurements. Upper level hyperfine constants were taken from Gianfrani & Tito (1993) for the 3220 Å line and from Murakawa and Suwa (1952) for the 3513 Å and 3800 Å lines. The log = –0.52 for the 3220 Å line was taken from Gough et al. (1983). The transition probabilities listed by Ivarsson et al. (2003) were used to compute log = –1.21 for the 3513 Å line and log = –1.44 for the 3800 Å line. There is some inconsistency between the Einstein A coefficients in Table 4 and the log values in Table 5 of Ivarsson et al. (2003). The log values in Table 5 of Ivarsson et al. are smaller than the above values by 0.04 or 0.05. Abundances in our work are based on the above log values from Ivarsson et al.’s Einstein A coefficients which are correct (S. Ivarsson, private communication). A similar problem was found in Ivarsson et al.’s log(gf) for the Os I 3058 Å line. Our value of –0.40 is based on their A coefficient for this line.
References
- (1) Alonso, A., Arribas, S., & Martinez-Roger, C. 1999, A&AS, 140, 261
- (2) Alonso, A., Arribas, S., & Martinez-Roger, C. 2001, A&A, 376, 1039
- (3) Anthony-Twarog, B. J. & Twarog, B. A. 1994, AJ, 107, 1577
- (4) Argast, D., Samland, M., Thielemann, F.-K., & Qian, Y.-Z 2004, A&A, 416, 997
- (5) Barlow, T. A. & Sargent, W. L. W. 1997, AJ, 113, 136
- (6) Biémont, E., Grevesse, N., Hannaford, P., & Lowe, R. M., 1981, ApJ, 248, 867
- (7) Biémont, E., Lyngå, C., Li, Z. S., Svanberg, S., Garnir, H. P., & Doidge, P. S. 1999, MNRAS, 303, 721
- (8) Burris, D. L., Pilachowski, C. A., Armandroff, T. A., Sneden, C., Cowan, J. J., & Roe, H. 2000, ApJ, 544, 302
- (9) Büttgenbach, S., Dicke, R., Gebauer, H., Kuhnen, R., & Träber, F. 1978, Z. Phys. A, 286, 333
- (10) Cameron, A. G. W. 2001, ApJ, 562, 456
- (11) Castelli, F., Gratton, R. G., & Kurucz, R. L. 1997, A&A, 318, 841
- (12) Cayrel, R., et al. 2004, A&A, 416, 1117
- (13) Chieffii, A., & Limongi, M. 2004, ApJ, 608, 405
- (14) Christlieb, N., et al. 2004, Nature, 603, 708
- Corliss & Bozman (1962) Corliss, C. H. & Bozman, W. R. 1962, Experimental Transition Probabilities for Spectral Lines of Seventy Elements, NBS Monograph 53 (Washington: US Gov. Prt. Off.)
- (16) Cowan, J. J., et al. 2002, ApJ, 572, 861
- (17) Cowan, J. J., Sneden, C., Burris, D. L., & Truran, J. W. 1996, ApJ, 460, L115
- Cowan & Sneden (2004) Cowan, J. J., & Sneden, C. 2004, in Carnegie Observatories Astrophysics Series, Vol. 4: Origin and Evolution of the Elements, ed. A. McWilliam & M. Rauch (Cambridge: Cambridge Univ. Press), in press
- (19) Cowan, J. J., & Thielemann, F.-K., 2004, Phys. Today, in press
- (20) Delbouille, L, Roland, G., & Neven, L. 1973, Photometric Atlas of the Solar Spectrum from lambda 3000 to lambda 10000, (Li‘ege, Inst. d’Ap., Univ. de Li‘ege)
- (21) Den Hartog, E. A., Lawler, J. E., Sneden, C., & Cowan, J. J. 2003, ApJS, 148, 543
- (22) Den Hartog, E. A., Herd, T. M., Lawler, J. E., Sneden, C., Cowan, J. J., & Beers, T. C. 2005, ApJ, in press
- (23) Edlén, B. 1953, J. Opt. Soc. Am., 43, 339
- (24) Edlén, B. 1966, Metrologia, 2, 71
- (25) Fields, B. D., Truran, J. W., & Cowan, J. J. 2002, ApJ, 575, 845
- (26) Frebel, A., et al. 2004, Nature, submitted
- (27) Freiburghaus, C., Rosswog, S., & Thielemann, F.-K. 1999, ApJ, 525, L121
- (28) Fulbright, J. P. 2000, AJ, 120, 1841
- (29) Gianfrani, L. & Tito G. M. 1993, Z. Phys. D, 25, 113
- (30) Gilroy, K. K., Sneden, C., Pilachowski, C. A., & Cowan, J. J. 1988, ApJ, 327, 298
- (31) Gough, D. S., Hannaford, P., & Lowe, R. M. 1983, J. Phys. B., 16, 785
- (32) Gratton, R. G., Carretta, E., Eriksson, K., & Gustafsson, B. 1999, A&A, 350, 955
- (33) Heger, A., & Woosley, S. E. 2002, ApJ, 567, 532
- (34) Hill, V., et al. 2002, A&A, 387, 560
- (35) Hoffman, R. D., Woosley, S. E., & Weaver, T. A. 2001, ApJ, 549, 1085
- (36) Honda, S., Aoki, W, Kajino, T., Ando, H., Beers, T. C., Izumiura, H., Sadakane, K., & Takada-Hidai, M. 2004, ApJ, 607, 474
- (37) Ivarsson, S., et al. 2003, A&A, 409, 1141
- (38) Johnson, J. A. 2002, ApJS, 139, 219
- (39) Korn, A. J. 2004, Origin and Evolution of the Elements, Carnegie Observatories Centennial Symposia, Carnegie Observatories Astrophysics Series, ed. A. McWilliam and M. Rauch,
- (40) Kurucz, R. L. 1995, in Workshop on Laboratory and astronomical high resolution spectra, ASP Conference Ser. #81 ed. A.J. Sauval, R. Blomme, and N. Grevesse (San Francisco: Astr. Soc. Pac.), p.583
- (41) Kwiatkowski, M., Zimmermann, P., Biémont, E., & Grevesse, N. 1984, A&A, 135, 59
- (42) Lawler, J. E., Sneden, C., & Cowan, J. J. 2004, ApJ, 608, 850
- (43) Lodders, K. 2003, ApJ, 591, 1220
- (44) McWilliam, A., Preston, G. W., Sneden, C., & Searle, L. 1995, AJ, 109, 2757
- (45) Moore, C. E. 1971, Atomic Energy Levels: As Derived from the Analysis of Optical Spectra, Vol. 3, National Standard Reference Data Series-National Bureau of Standards 35 (Washington, DC: U. S. Gov. Printing Off.), 177
- (46) Murakawa, K. & Suwa S. 1952, Phys. Rev. 87, 1048
- (47) Perryman, M. A. C., et al. 1997, A&A, 323, L49
- (48) Rosman, K. J. R., & Taylor, P. D. P. 1998, J. Phys. Chem. Ref. Data 27, 1275
- (49) Rosswog, S., Liebendorfer, M., Thielemann, F.-K., Davies, M. B., Benz, W., & Piran, T., 1999, A&A, 341, 499
- (50) Sawatzky, G., & Winkler, R. 1989, Z. Phys. D, 14, 9
- (51) Simmerer, J., Sneden, C., Cowan, J. J., Collier, J., Woolf, V., & Lawler, J. E. 2004, ApJ, in press
- (52) Sneden, C., Cowan, J. J., Burris, D. L., & Truran, J. W. 1998, ApJ, 496, 235
- (53) Sneden, C., et al. 2003, ApJ, 591, 936
- (54) Sneden, C., & Cowan, J. J. 2003, Science, 299, 70
- (55) Sneden, C., Cowan, J. J., Ivans, I. I., Fuller, G. M., Burles, S., Beers, T. C., & Lawler, J. E. 2000, ApJ, 533, L139
- (56) Sneden, C., McWilliam, A., Preston, G. W., Cowan, J. J., Burris, D. L., & Armosky, B. J. 1996, ApJ, 467, 819
- (57) Thévenin, F. & Idiart, T. P. 1999, ApJ, 521, 753
- (58) Travaglio, C., Gallino, R., Arnone, E., Cowan, J. J., Jordan, F., & Sneden, C. 2004, ApJ, 601, 864
- (59) Truran, J. W., Cowan, J. J., Pilachowski, C. A., & Sneden, C. 2002, PASP, 114, 1293
- (60) Umeda, H., & Nomoto, K. 2005, ApJ, in press, astro-ph/0308029
- (61) Vogt, S. S. et al. 1994, in Proc. SPIE Conf. 2198, Instrumentation in Astronomy VII, eds. D. L. Crawford and E. R. Craine, (Bellingham, WA: SPIE), p. 362
- (62) Wasserburg, G. J., Busso, M., & Gallino, R. 1996, ApJ, 466, L109
- (63) Wasserburg, G. J., & Qian, Y.-Z. 2000, ApJ, 529, L21
| Star | Teff | log | vt | [Fe I/H] | [Fe II/H] | References |
|---|---|---|---|---|---|---|
| HD6268 | 4685 | 1.50 | 2.00 | –2.42 | –2.36 | 1 |
| HD6755 | 5105 | 2.95 | 2.50 | –1.68 | –1.57 | 2 |
| HD115444 | 4720 | 1.75 | 2.00 | –2.90 | –2.71 | 2 |
| HD122563 | 4570 | 1.35 | 2.90 | –2.72 | –2.61 | 2 |
| HD122956 | 4510 | 1.55 | 1.60 | –1.95 | –1.69 | 2 |
| HD126587 | 4795 | 1.95 | 2.00 | –2.93 | –2.81 | 1 |
| HD175305 | 5040 | 2.85 | 2.00 | –1.48 | –1.36 | 1 |
| HD186478 | 4600 | 1.45 | 2.00 | –2.56 | –2.44 | 2 |
| HD221170 | 4400 | 1.10 | 1.70 | –2.35 | –2.03 | 2 |
| BD+17o3248 | 5200 | 1.80 | 1.90 | –2.08 | –2.10 | 3 |
| CS 22892-052 | 4800 | 1.50 | 1.95 | –3.10 | –3.09 | 4 |
References. — (1) Derived in the same manner as the model atmospheres of Simmerer et al. (2004); (2) Simmerer et al. (2004); (3) Cowan et al. (2002); (4) Sneden et al. (2003).
| aaWavelength in Å. | Species | E.P.bbExcitation potential in eV. | log | (1)ccStar Names: (1) HD6268; (2) HD6755; (3) HD115444; (4) HD122563; (5) HD122956; (6) HD126587;
(7) HD175305; (8) HD186478; (9) HD221170; (10) BD+17o3248; (11) CS 22892-052. |
(2) | (3) | (4) | (5) | (6) | (7) | (8) | (9) | (10) | (11) |
|---|---|---|---|---|---|---|---|---|---|---|---|---|---|---|
| 3039.07 | Ge I | 0.88 | –0.04 | +0.32 | +1.08 | –0.07 | –0.16 | +0.84 | +0.03 | +1.28 | +0.35 | +0.69 | +0.46 | –0.2 |
| 3036.39ddThe two Zr II lines at 3036 Å form one blended feature. | Zr II | 0.56 | –0.42 | +0.31 | +0.92 | –0.13 | +0.05 | +0.96 | –0.13 | +1.17 | +0.49 | +1.08 | +0.61 | |
| 3036.51ddThe two Zr II lines at 3036 Å form one blended feature. | Zr II | 0.53 | –0.60 | |||||||||||
| 3054.84 | Zr II | 1.01 | +0.18 | +0.46 | +1.02 | –0.08 | +1.2: | –0.13 | +1.32 | +0.44 | +0.71 | +0.15 | ||
| 3060.12 | Zr II | 0.04 | –1.37 | +0.46 | +1.07 | –0.08 | +0.10 | +0.91 | –0.4 | +1.17 | +0.69 | +0.71 | +0.30 | |
| 3061.33 | Zr II | 0.10 | –1.38 | +0.3: | +1.02 | –0.5: | +0.03 | +0.91 | –0.4 | +1.22 | +0.19 | +0.68 | +0.51 | +0.50 |
| 2838.63 | Os I | 0.64 | +0.11 | –0.5: | +0.32 | –0.60 | –0.8 | –0.14 | –0.6: | +0.52 | –0.6: | –0.17 | +0.45 | |
| 3058.65 | Os I | 0.00 | –0.40 | –0.55: | +0.45: | –0.75: | –1.2 | -0.04 | –0.7 | +0.67 | –0.46 | –0.15: | +0.30 | +0.05 |
| 3301.57 | Os I | 0.00 | –0.74 | –0.58 | –1.0 | –0.09 | –0.78 | +0.32 | –0.41 | +0.4: | +0.02 | |||
| 3220.78 | Ir I | 0.35 | –0.52 | –0.88 | –1.3 | –0.17 | –1.08 | +0.52 | –0.71 | +0.25 | +0.25 | |||
| 3513.65 | Ir I | 0.00 | –1.21 | –0.48 | –0.9 | –0.02 | –0.78 | +0.47 | –0.51 | +0.25 | –0.10 | |||
| 3800.12 | Ir I | 0.00 | –1.44 | –0.78 | –1.3 | –0.02 | –1.08 | +0.42 | –0.71 | +0.20 | –0.15 | |||
| 2646.88 | Pt I | 0.00 | –0.79 | –0.10 | +0.7: | –0.33 | +1.07 | +0.2: | +0.98 | +0.62 | ||||
| 2659.45 | Pt I | 0.00 | –0.03 | +0.01 | +0.20 | –0.48 | –1.3 | +0.3: | –0.83 | +0.37 | 0.0: | +0.7: | +0.42 | |
| 2929.79 | Pt I | 0.00 | –0.70 | +0.01 | +0.57 | –0.48 | –1.3 | +0.46 | –0.78 | +0.77 | –0.16 | +0.58 | +0.52 | +0.20 |
| Star | Ge | Zr | Os | Ir | Pt | La | Eu | References |
|---|---|---|---|---|---|---|---|---|
| Abundances in log units | ||||||||
| Sun | +3.60 | +2.60 | +1.41 | +1.36 | +1.70 | +1.16 | +0.52 | 1 |
| HD6268 | +0.32 | +0.38 | –0.53: | –0.01 | –0.93 | –1.33 | 2 | |
| HD6755 | +1.08 | +1.01 | +0.4: | +0.45 | –0.29 | –0.50 | 3 | |
| HD115444 | –0.07 | –0.20 | –0.65 | –0.68 | –0.48 | –1.35 | –1.61 | 3 |
| HD122563 | –0.16 | +0.06 | –1.2 | –1.3 | –1.3 | –2.35 | –2.59 | 3 |
| HD122956 | +0.84 | +1.00 | –0.08 | -0.05 | +0.38 | –0.48 | –0.79 | 3 |
| HD126587 | +0.03 | –0.71: | –0.96 | –0.71 | –1.70 | –1.89 | 6 | |
| HD175305 | +1.28 | +1.22 | +0.50 | +0.46 | +0.67 | –0.06 | –0.29 | 6 |
| HD186478 | +0.35 | +0.45 | –0.43 | –0.63 | –0.02 | –1.29 | –1.50 | 3 |
| HD221170 | +0.69 | +0.88 | –0.16 | +0.48 | –0.72 | –0.85 | 3 | |
| BD+17o3248 | +0.46 | +0.64 | +0.37 | +0.23 | +0.50 | –0.42 | –0.67 | 4 |
| CS 22892-052 | –0.2 | +0.32 | +0.04 | –0.05 | +0.20 | –0.84 | –0.95 | 5 |
| Abundances in [X/Fe] units | ||||||||
| Sun | 0.00 | 0.00 | 0.00 | 0.00 | 0.00 | 0.00 | 0.00 | 1 |
| HD6268 | –0.86 | +0.14 | +0.49 | +0.71 | +0.26 | +0.52 | 2 | |
| HD6755 | –0.84 | –0.02 | +0.67 | +0.43 | +0.12 | +0.55 | 3 | |
| HD115444 | –0.77 | –0.10 | +0.84 | +0.86 | +0.72 | +0.20 | +0.58 | 3 |
| HD122563 | –0.94 | +0.07 | +0.1 | +0.1 | –0.3 | –0.90 | –0.50 | 3 |
| HD122956 | –0.81 | +0.09 | +0.46 | +0.54 | +0.63 | +0.05 | +0.38 | 3 |
| HD126587 | –0.64 | +0.81 | +0.61 | +0.52 | –0.05 | +0.40 | 6 | |
| HD175305 | –0.84 | –0.02 | +0.57 | +0.58 | +0.45 | +0.14 | +0.55 | 6 |
| HD186478 | –0.69 | +0.29 | +0.68 | +0.57 | +0.84 | –0.01 | +0.42 | 3 |
| HD221170 | –0.56 | +0.31 | +0.78 | +1.13 | +0.15 | +0.66 | 3 | |
| BD+17o3248 | –1.06 | +0.14 | +1.04 | +0.95 | +0.88 | +0.52 | +0.91 | 4 |
| CS 22892-052 | –0.7 | +0.81 | +1.73 | +1.69 | +1.60 | +1.09 | +1.62 | 5 |
Note. — In the top section, La and Eu are taken from: (1) Lodders (2003); (2) Burris et al. (2000); (3) Simmerer et al. (2004); (4) Cowan et al. (2002); (5) Sneden et al. (2003); (6) this study. In the bottom section the log values derived from Ge I, Os I, Ir I, and Pt I are referenced to the Fe I values of Table HST Observations of Heavy Elements in Metal-Poor Galactic Halo Stars, while those from Zr II, La II, and Eu II are referenced to Fe II.
| Star | HST | Keck | Burris | Others | References |
|---|---|---|---|---|---|
| HD 6268 | +0.14 | +0.32 | +0.17,+0.12 | 1,2 | |
| HD 6755 | –0.02 | +0.07 | +0.08 | 3 | |
| HD 115444 | –0.10 | +0.05 | +0.18,+0.37,+0.26 | 2,4,5 | |
| HD 122563 | +0.07 | –0.08 | +0.31 | –0.03,–0.08,+0.18,+0.03 | 2,3,4,5 |
| HD 122956 | +0.09 | +0.13 | +0.16 | +0.27 | 3 |
| HD 126587 | –0.09 | +0.10 | +0.33,+0.12 | 2,5 | |
| HD 175305 | –0.02 | +0.14 | +0.10 | +0.16 | 3 |
| HD 186478 | +0.29 | +0.26 | +0.40 | +0.35,+0.28,+0.29 | 1,2,5 |
| HD 221170 | +0.31 | +0.35 | +0.12 | 3 | |
| BD+17 3248 | +0.14 | +0.50 | +0.27 | +0.26,+0.25 | 5,6 |
| CS 22892-052 | +0.81 | +0.73 | +0.79 | +0.61,+0.60,+0.73 | 1,2,7 |
Note. — References: (1) McWilliam et al. 1995; (2) Honda et al. 2004; (3) Fulbright 2000; (4) Westin et al. 2000; (5) Johnson 2002; (6) Cowan et al. 2002; (7) Sneden et al. 2003.
| Frequency | Wavelength | Upper | Lower | Relative | Relative | Normalized |
|---|---|---|---|---|---|---|
| vacuum | air | F | F | Component | Component | Component |
| (cm-1) | (Å) | Frequency | Wavelength | Strength | ||
| 31039.450 | 3220.7765 | 5 | 6 | –0.04119 | +0.00427 | 0.12113 |
| 31039.450 | 3220.7765 | 5 | 5 | +0.00578 | –0.00060 | 0.00683 |
| 31039.450 | 3220.7765 | 5 | 4 | +0.06206 | –0.00644 | 0.00016 |
| 31039.450 | 3220.7765 | 4 | 5 | –0.01616 | +0.00168 | 0.09566 |
| 31039.450 | 3220.7765 | 4 | 4 | +0.04012 | –0.00416 | 0.00897 |
| 31039.450 | 3220.7765 | 4 | 3 | +0.09635 | –0.01000 | 0.00019 |
| 31039.450 | 3220.7765 | 3 | 4 | +0.02388 | –0.00248 | 0.07474 |
| 31039.450 | 3220.7765 | 3 | 3 | +0.08011 | –0.00831 | 0.00679 |
| 31039.450 | 3220.7765 | 2 | 3 | +0.06870 | –0.00713 | 0.05824 |
| 31039.450 | 3220.7765 | 5 | 6 | –0.04666 | +0.00484 | 0.20387 |
| 31039.450 | 3220.7765 | 5 | 5 | +0.00692 | –0.00072 | 0.01150 |
| 31039.450 | 3220.7765 | 5 | 4 | +0.06707 | –0.00696 | 0.00026 |
| 31039.450 | 3220.7765 | 4 | 5 | –0.01662 | +0.00172 | 0.16100 |
| 31039.450 | 3220.7765 | 4 | 4 | +0.04353 | –0.00452 | 0.01509 |
| 31039.450 | 3220.7765 | 4 | 3 | +0.10179 | –0.01056 | 0.00033 |
| 31039.450 | 3220.7765 | 3 | 4 | +0.02573 | –0.00267 | 0.12578 |
| 31039.450 | 3220.7765 | 3 | 3 | +0.08399 | –0.00872 | 0.01143 |
| 31039.450 | 3220.7765 | 2 | 3 | +0.07123 | –0.00739 | 0.09801 |
| 28452.318 | 3513.6473 | 7 | 6 | +0.1034 | –0.01277 | 0.11648 |
| 28452.318 | 3513.6473 | 6 | 6 | +0.0348 | –0.00430 | 0.00459 |
| 28452.318 | 3513.6473 | 6 | 5 | +0.0568 | –0.00701 | 0.09636 |
| 28452.318 | 3513.6473 | 5 | 6 | –0.0167 | +0.00207 | 0.00007 |
| 28452.318 | 3513.6473 | 5 | 5 | +0.0053 | –0.00065 | 0.00606 |
| 28452.318 | 3513.6473 | 5 | 4 | +0.0116 | –0.00143 | 0.07929 |
| 28452.318 | 3513.6473 | 4 | 5 | –0.0326 | +0.00402 | 0.00008 |
| 28452.318 | 3513.6473 | 4 | 4 | –0.0263 | +0.00324 | 0.00457 |
| 28452.318 | 3513.6473 | 4 | 3 | –0.0291 | +0.00359 | 0.06523 |
| 28452.318 | 3513.6473 | 7 | 6 | +0.0379 | –0.00468 | 0.19602 |
| 28452.318 | 3513.6473 | 6 | 6 | –0.0356 | +0.00440 | 0.00772 |
| 28452.318 | 3513.6473 | 6 | 5 | –0.0136 | +0.00168 | 0.16217 |
| 28452.318 | 3513.6473 | 5 | 6 | –0.0921 | +0.01137 | 0.00012 |
| 28452.318 | 3513.6473 | 5 | 5 | –0.0700 | +0.00865 | 0.01019 |
| 28452.318 | 3513.6473 | 5 | 4 | –0.0626 | +0.00773 | 0.13344 |
| 28452.318 | 3513.6473 | 4 | 5 | –0.1125 | +0.01389 | 0.00014 |
| 28452.318 | 3513.6473 | 4 | 4 | –0.1050 | +0.01296 | 0.00770 |
| 28452.318 | 3513.6473 | 4 | 3 | –0.1061 | +0.01310 | 0.10977 |
| 26307.462 | 3800.1239 | 6 | 6 | +0.0970 | –0.01401 | 0.11563 |
| 26307.462 | 3800.1239 | 6 | 5 | +0.1190 | –0.01718 | 0.00551 |
| 26307.462 | 3800.1239 | 5 | 6 | +0.0248 | –0.00358 | 0.00551 |
| 26307.462 | 3800.1239 | 5 | 5 | +0.0468 | –0.00676 | 0.08976 |
| 26307.462 | 3800.1239 | 5 | 4 | +0.0531 | –0.00767 | 0.00723 |
| 26307.462 | 3800.1239 | 4 | 5 | –0.0013 | +0.00019 | 0.00723 |
| 26307.462 | 3800.1239 | 4 | 4 | +0.0050 | –0.00072 | 0.07120 |
| 26307.462 | 3800.1239 | 4 | 3 | +0.0022 | –0.00031 | 0.00544 |
| 26307.462 | 3800.1239 | 3 | 4 | –0.0256 | +0.00370 | 0.00544 |
| 26307.462 | 3800.1239 | 3 | 3 | –0.0284 | +0.00411 | 0.05979 |
| 26307.462 | 3800.1239 | 6 | 6 | +0.0347 | –0.00502 | 0.19460 |
| 26307.462 | 3800.1239 | 6 | 5 | +0.0567 | –0.00820 | 0.00927 |
| 26307.462 | 3800.1239 | 5 | 6 | –0.0396 | +0.00572 | 0.00927 |
| 26307.462 | 3800.1239 | 5 | 5 | –0.0176 | +0.00254 | 0.15107 |
| 26307.462 | 3800.1239 | 5 | 4 | –0.0101 | +0.00146 | 0.01217 |
| 26307.462 | 3800.1239 | 4 | 5 | –0.0686 | +0.00991 | 0.01217 |
| 26307.462 | 3800.1239 | 4 | 4 | –0.0611 | +0.00883 | 0.11982 |
| 26307.462 | 3800.1239 | 4 | 3 | –0.0622 | +0.00899 | 0.00915 |
| 26307.462 | 3800.1239 | 3 | 4 | –0.0948 | +0.01369 | 0.00915 |
| 26307.462 | 3800.1239 | 3 | 3 | –0.0959 | +0.01386 | 0.10063 |