A Chandra and XMM-Newton study of the wide-angle tail radio galaxy 3C 465
Abstract
We have observed the prototypical wide-angle tail radio galaxy 3C 465 with Chandra and XMM-Newton. X-ray emission is detected from the active nucleus and the inner radio jet, as well as a small-scale, cool component of thermal emission, a number of the individual galaxies of the host cluster (Abell 2634), and the hotter thermal emission from the cluster itself. The X-ray detection of the jet allows us to argue that synchrotron emission may be an important mechanism in other well-collimated, fast jets, including those of classical double radio sources. The bases of the radio plumes are not detected in the X-ray, which supports the model in which these plumes are physically different from the twin jets of lower-power radio galaxies. The plumes are in fact spatially coincident with deficits of X-ray emission on large scales, which argues that they contain little thermal material at the cluster temperature, although the minimum pressures throughout the source are lower than the external pressures estimated from the observed thermal emission. Our observations confirm both spatially and spectrally that a component of dense, cool gas with a short cooling time is associated with the central galaxy. However, there is no evidence for the kind of discontinuity in external properties that would be required in many models of the jet-plume transition in WATs. Although the WAT jet-plume transition appears likely to be related to the interface between this central cool component and the hotter intra-cluster medium, the mechanism for WAT formation remains unclear. We revisit the question of the bending of WAT plumes, and show that the plumes can be bent by plausible bulk motions of the intra-cluster medium, or by motion of the host galaxy with respect to the cluster, as long as the plumes are light.
keywords:
galaxies: active – X-rays: galaxies – galaxies: individual: 3C 465 – galaxies: jets – radiation mechanisms: non-thermal1 Introduction
Wide-angle tail radio galaxies (WATs) present a number of interesting problems for our understanding of the dynamics of extragalactic radio sources and in particular their interaction with the external medium. Here we define the class as being sources that are associated with a cluster dominant galaxy, at or near the cluster centre, and that are characterized in the radio by twin, well-collimated jets that abruptly flare into long, often sharply bent plumes or tails. (Throughout this paper we use the term ‘jet’ to refer to the inner, well-collimated feature, and ‘plume’ to refer to the outer parts of the source.) The earliest problem associated with WATs was identified by Burns (1981) and Eilek et al. (1984, hereafter E84): given that WAT host galaxies are cluster-centre objects and should be close to the bottom of the cluster potential well (and so not moving at high speed with respect to the external medium) what gives rise to the often sharp bends in the plumes? This problem is in fact not unique to sources that are WATs by our definition; not all cluster-centre sources with bent plumes exhibit the large-scale, narrow, well-collimated jets of a WAT. A problem that is unique to WATs (also identified by E84) is how, and why, these jets make the transition into broad plumes where they do: what is it about the external environment that sets the location for the jet-plume transition? Or, since these objects are in general radio-luminous enough to be classical double (FRII) sources and their jets are very similar to those of FRIIs, we can ask a related question (e.g. Hardcastle 1998): what is it about the external environment that causes these sources to be WATs and not FRIIs?
Radio, optical and X-ray observations have allowed some progress to be made in answering these questions. Large-scale bulk motions in the intra-cluster medium (ICM) are expected if the host cluster is not relaxed, and the ram pressure from these can bend the plumes: Einstein and ROSAT observations have shown that there is indeed X-ray substructure in the host clusters of WATs (e.g. Burns et al. 1994; Gómez et al. 1997a) and this is backed up by optical spectroscopy that shows there is substantial substructure in the galaxy velocity distributions of a few well-studied clusters hosting WATs (Pinkney et al. 1993; Gómez et al. 1997b). Substructure in the host clusters will also give rise to non-radial buoyancy forces that can play a part in bending the plumes (e.g. Sakelliou, Merrifield & McHardy 1996). Observational input to the questions related to the jet-plume transition has been more limited, but Hardcastle (1998) and Hardcastle & Sakelliou (2004) have shown that the jets often terminate in compact structures similar to the hotspots of FRII radio galaxies, supporting a picture (Hardcastle 1999) in which the current jet-plume transition, where it occurs at a single point, is a result of the interaction between the jet and the edge of the previously existing plume. Hardcastle & Sakelliou also provided the first direct evidence that the external environment is responsible for the unique structure of WATs, by demonstrating an inverse correlation between the jet termination distance and the temperature of the host cluster. However, the physics that governs the location of the base of the plume is still unclear. Modellers have concentrated on the idea that it is associated with some localized feature of the external medium, such as propagation across an IGM/ICM interface or a shock front (e.g. Loken et al. 1995; Hooda & Wiita 1996) or interaction with discrete clumps in the external medium (e.g. Higgins, O’Brien, & Dunlop 1999). X-ray observations with the previous generation of observatories had insufficient resolution and sensitivity to test these models.
However, Chandra and XMM have now been used to observe a number of WAT host clusters, allowing the observational picture in the X-ray to be updated. Jetha et al. (2005) present observations of two WAT host clusters with Chandra, showing that both contain a cool central gas component and that the jet enters the plume close to the transition between this and the hotter gas in the rest of the host cluster. While this has some similarities to the picture in which a jet-plume transition is a result of a propagation across some structure in the IGM/ICM interface, the detailed Chandra observations show that there are no discontinuities in the physical conditions in the clusters (as would be expected if the jet-plume transition was a result of propagation across a discrete feature in the external medium, such as a shock or cold front) and no discrete X-ray emitting features associated with the plume bases. An association between the jet-plume transition and the cold central gas seems likely as a result of this work, but the mechanism for WAT formation is still not clear.
The observations of Jetha et al. were also not sensitive enough to study the X-ray properties of the radio components themselves. In WATs the jets, like those in FRIIs, are thought to remain relativistic, well-collimated flows (‘type II’ jets) until they undergo rapid deceleration at a hotspot. In the much commoner twin-jet FRI sources, the initially type II jet flow undergoes significant bulk deceleration on scales of a few kpc, slowing from bulk relativistic speeds to speeds that are trans-sonic or sub-sonic with respect to the external medium (Bicknell 1994; Laing & Bridle 2002) and forming a ‘type I’ jet that may in some cases make a smooth transition into a plume similar to those of WATs. In all cases that have been observed in detail this bulk deceleration in FRIs is accompanied by high-energy particle acceleration that gives rise to X-ray synchrotron emission (e.g. Hardcastle et al. 2001, Worrall et al. 2001, Hardcastle et al. 2002). However, the inner jets of FRI sources, while they should still be relativistic, are often also strong sources of X-ray emission (Hardcastle et al. 2001, 2003). WAT jets should be similar to the inner jets of FRIs, and so we might expect to detect synchrotron X-ray emission from them, particularly on small scales. On the other hand, WAT plumes should not be similar to the brighter outer jets of FRIs in the deceleration region, since the model outlined by Hardcastle & Sakelliou (2004) requires the jet deceleration in the plumes to take place at a single discrete location.
Investigating these issues requires sensitive X-ray observations of more WAT systems. 3C 465, the subject of this paper, is the closest WAT in the northern sky () and the best studied at radio frequencies (Riley & Branson 1973; Leahy 1984; E84; Eilek & Owen 2002; Hardcastle & Sakelliou 2004), to the extent that it is often taken to be the prototype object of its class. Its host galaxy is the D galaxy NGC 7720, the dominant galaxy of the cluster Abell 2634. A2634 has been well studied in the X-ray, initially with Einstein (Jones et al. 1979; E84; Jones & Forman 1984) and later with the ROSAT PSPC (Schindler & Prieto 1997) and HRI (Sakelliou & Merrifield 1998, 1999) and with ASCA (e.g. Fukazawa et al. 1998). The velocity properties of the galaxies in the cluster have also been studied in detail (Pinkney et al. 1993, Scodeggio et al. 1995). From these studies it has been possible to show that A2634 is a non-relaxed cluster, with an X-ray extension around the central cluster galaxy perpendicular to the jet axis (e.g. Schindler & Prieto 1997) although there is little evidence in the galaxy distributions and velocity data for a recent merger (Scodeggio et al. 1995). On small scales, Sakelliou & Merrifield (1999) argued that the compact X-ray core seen by the ROSAT HRI was extended on scales of a few arcsec, and that this implied detection of a small-scale IGM component. Sakelliou & Merrifield (1998) showed that the individual galaxies of the host cluster were of low luminosity in the X-ray, arguing that this implied that hot gas had been stripped from the galaxies in their motion through the IGM.
Because of this wealth of existing observational data, 3C 465 is an excellent target for observations with the new generation of X-ray observatories aimed at addressing the outstanding questions described above. In this paper we report on the results of our Chandra and XMM-Newton observations. Throughout the paper we use a concordance cosmology with km s-1 Mpc-1, and . At the redshift of 3C 465, 1 arcsec corresponds to 590 pc. Spectral indices are the energy indices and are defined in the sense . The photon index is . All fits to the X-ray data include the effects of Galactic absorption with a column density of cm-2. J2000 co-ordinates are used throughout.
2 Observations and processing
2.1 XMM
3C 465 was observed with the EPIC cameras on XMM, using the medium filter, for 11160 s (MOS1) 11162 s (MOS2) and 8725 s (pn) on 2002 Jun 22. The data were filtered using sas to include only the standard flag set, and remove bad columns and rows; we retained the out of field of view events. High background events were filtered on the count rate above 10 keV using the same criteria as were used for the background dataset we used in subsequent analysis (Read & Ponman 2003), i.e. an upper count rate in the 10–15 keV energy range with standard flags and PATTERN=0 of 1 count s-1 (pn) and 0.35 count s-1 (MOS): this did not significantly affect the MOS cameras, but flagged out a substantial fraction of the pn data. The effective exposure times after filtering were 11054 s (MOS1) 11105 s (MOS2) and 6735 s (pn).
After filtering, the data were vignetting-corrected using the sas task evigweight, and spectra and images were generated using the evselect task. We used the techniques described by Croston et al. (2003) to interpolate over chip gaps and bad columns to make images in the energy range 0.3–7.0 keV for presentation.
Although the source and background datasets had been filtered using the same criteria, the count rate in the out of field of view regions for both MOS and pn was significantly higher in our observations than in the background dataset. This implies a higher contribution from particles in our data, which (if uncorrected) would bias our extracted spectra. The reason for this discrepancy appears to be that the effective spectrum of the particle background, as measured by XMM, differs in our data and in the background files (where it is of course an exposure-weighted average over many observations). We generated an approximate correction for the particle background excess in our data by taking the difference between the out of field of view spectra in our data and those in the Read & Ponman background files. A suitably scaled version of this spectrum (taking account of the weighting applied to the data) was then added to the evigweight-corrected background spectra generated for each observation. This had the effect of stabilizing the temperature fitted to large-area regions of the extended X-ray source (Section 3.8).
While this approach to background correction should provide an accurate correction for the non-X-ray contribution to the observed background, it differs from the double-subtraction method of Arnaud et al. (2002) in that it does not attempt to correct for the difference between the level of the cosmic X-ray background in the background datasets and that in the observation of 3C 465. The reason we do not attempt to do this is that the cluster fills the field of view, so that it is impossible to define a local blank-sky background that does not include cluster emission: any attempt to apply the method of Arnaud et al. would tend to over-estimate the cosmic background excess and consequently cause us to under-estimate the true normalization of the models fitted to the data. The systematic error introduced by omitting this double-subtraction correction is small in the case of 3C 465 and should predominantly affect low energies, and we have verified that applying the double-subtraction method to the spectra we extract in Section 3.8 does not significantly affect fitted parameters such as mekal model temperature, though of course it does affect the normalization of the fitted models.
2.2 Chandra
We observed 3C 465 with Chandra on 2004 Aug 31 for 49528 s. The source was positioned near the standard aim point on the back-illuminated S3 CCD. We reprocessed the data in the standard way to apply the latest calibration files (using CIAO 3.1 and CALDB 2.28). As the data were taken in VFAINT mode, we used ‘VFAINT cleaning’ to identify and reject some background events. We also removed the 0.5-pixel event position randomization. There were no times of unusually high background, so we were able to use all of the available data.
We used events in the energy range 0.5–5 keV to construct images (throughout the paper this energy range is used for Chandra imaging).
2.3 Radio data
The high-resolution radio images used are taken from Hardcastle & Sakelliou (2004), and were made with the NRAO Very Large Array (VLA) at 8.4 GHz. We also make use of a 1.4-GHz VLA image taken from the 3CRR Atlas of Leahy, Bridle & Strom111http://www.jb.man.ac.uk/atlas/ with a resolution of 5.4 arcsec.
3 Spatial and spectral analysis
3.1 Methods
Chandra spectra were extracted and corresponding response and ancillary response matrices constructed using ciao. XMM spectral extraction was carried out using SAS, and an on-axis ancillary response matrix was generated using the task arfgen and used for every spectrum. The response matrices used were the ‘canned’ responses supplied on the XMM web site222ftp://xmm.vilspa.esa.es/pub/ccf/constituents/extras/responses/. The use of on-axis ancillary response matrices is made possible by the vignetting correction applied with evigweight.
Spectral model fitting was carried out in xspec, in the energy range 0.4–7.0 keV (Chandra) and 0.3–7.0 keV (XMM). In all cases, except where otherwise stated, the extracted spectra were grouped so that each fitting bin had counts after background subtraction. Errors quoted throughout are the value for one interesting parameter, unless otherwise stated.
3.2 Overview
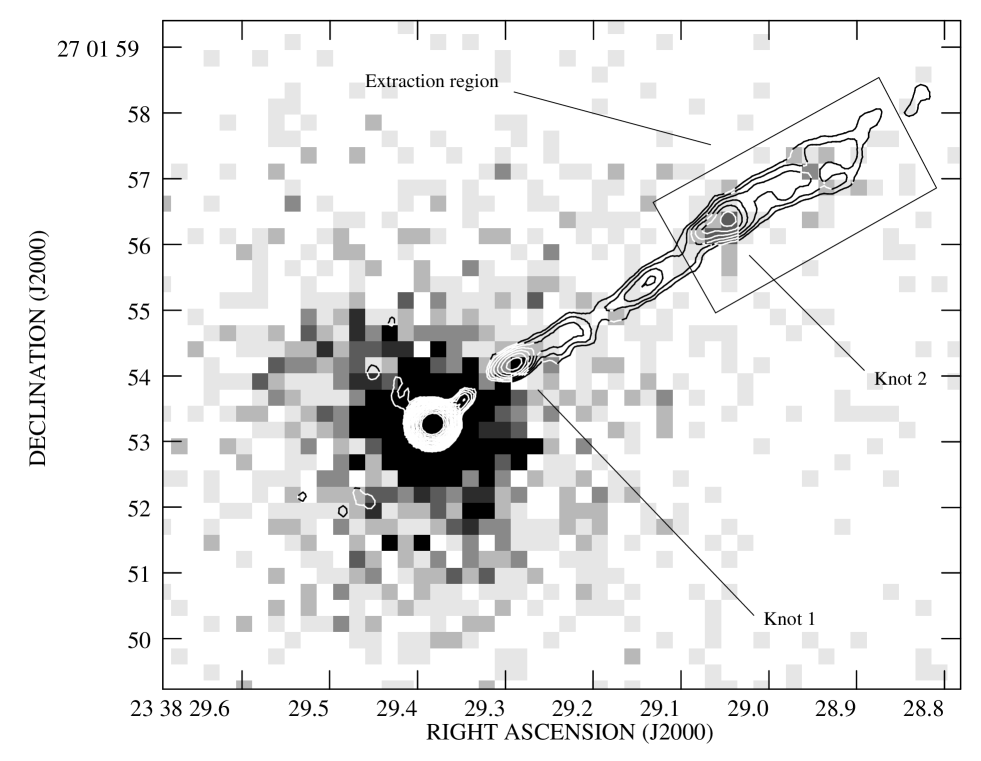
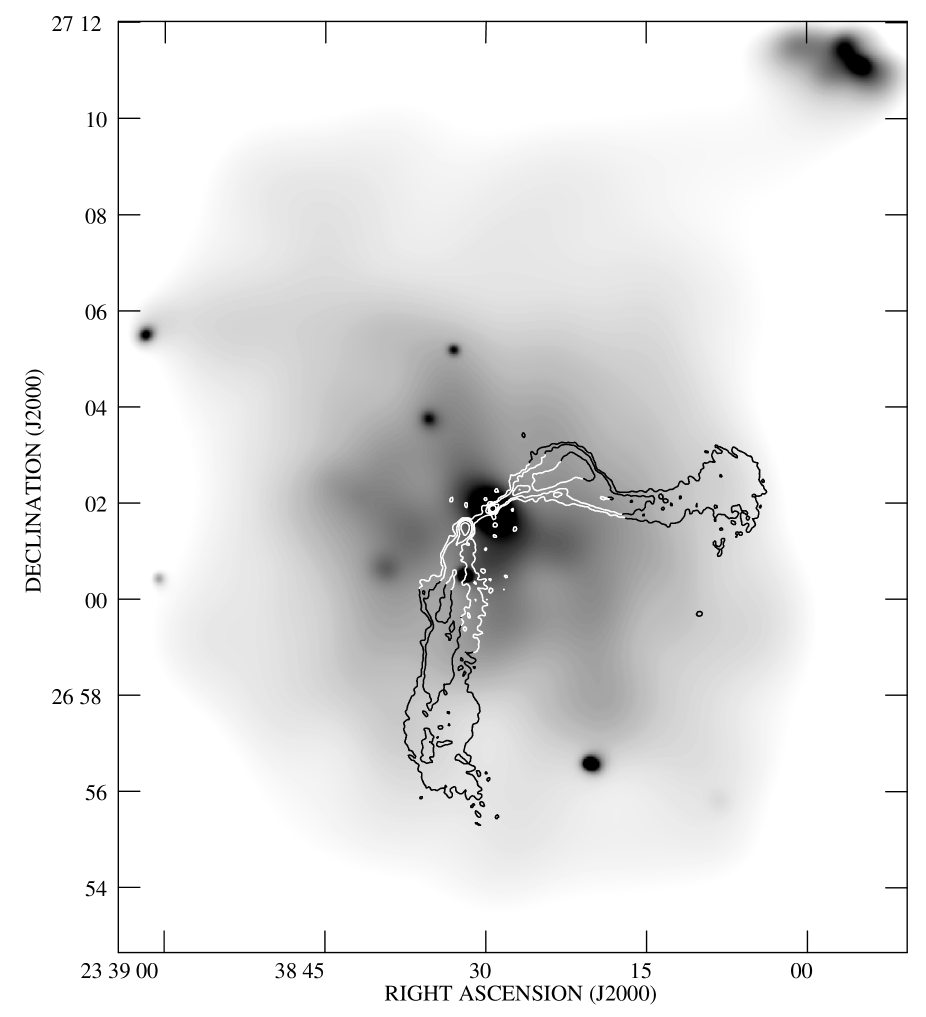
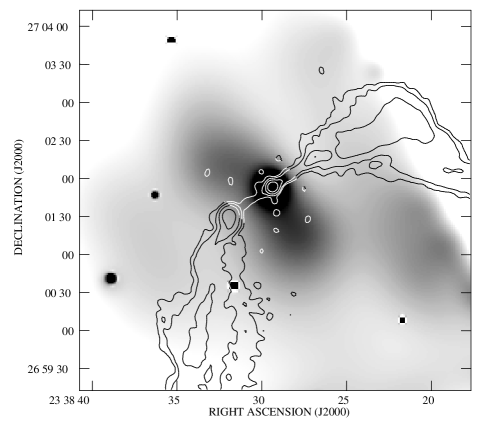
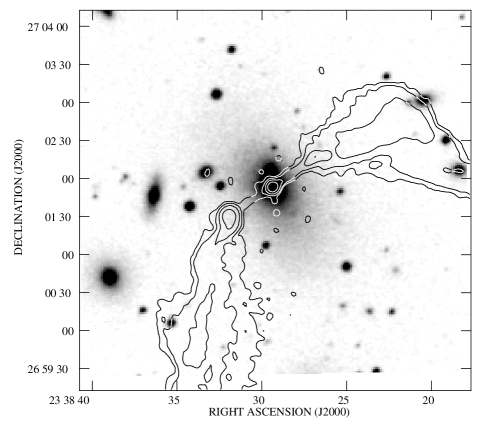
In the Chandra image there is a clear detection of an X-ray core and emission associated with the jet, as well as small-scale extended emission (Fig. 1). On larger scales, thermal emission from the host cluster is clearly visible in the Chandra data and there are detections of several of the individual galaxies of the cluster. No significant excess X-ray emission is seen around the points where the narrow inner jets enter the radio plumes. The XMM observations (Fig. 2) detect the X-ray core and small-scale thermal emission and the thermal emission from the cluster, as well as some of the cluster galaxies and the background cluster known as CL-37 (Scodeggio et al. 1995). In the following sections we discuss each component in turn.
3.3 The core
There is small-scale thermal emission associated with the inner parts of NGC 7720 (Section 3.6), and so measurements of the nuclear X-ray emission need to be carried out with care. We initially used a small region (a circle of radius 1.5 arcsec centred on the peak of the X-ray emission) to extract a spectrum from the Chandra dataset. Background was taken from a concentric annulus between 1.5 and 2.5 arcsec. This spectrum was very poorly fitted ( for 28 degrees of freedom) with a single power law model with Galactic absorption, and the strong residuals below 1 keV suggested that there was some contribution from thermal emission even in this small region. A model consisting of a thermal (mekal) component with 0.5 solar abundance and an unabsorbed power law gave a much better fit ( for 26 degrees of freedom), but required an unusually flat photon index () for the power-law component. When the power law was allowed to have some intrinsic absorption, a better fit was obtained ( for 25 d.o.f.): in this case the temperature of the thermal component was keV, the power-law photon index was , and the excess absorbing column was cm-2. No improvement in the fit was obtained by including further components, such as a second unabsorbed power law. Imaging the core in hard and soft bands (above and below 1 keV) suggests that it is indeed much more point-like in the hard band than the soft band, supporting the model implied by this fit. The power-law component contributes 260 counts in this model, or about 1/3 of the total in the extraction region, and its unabsorbed 1-keV flux density is nJy, taking into account a correction for the small aperture and local background subtraction estimated from PSF simulations using the chart and marx tools. Errors quoted here are for two interesting parameters to take account of the strong relationship between absorbing column and normalizing flux.
To compare the Chandra and XMM results, we extracted a spectrum for both using a circle of radius 30 arcsec, taking background from an annulus between 30 and 40 arcsec. (This region includes emission from the companion galaxy, NGC 7720A, which is 14 arcsec to the north, but as discussed in Section 3.7 this is a weak X-ray source and does not contribute significantly to the fits.) The results are similar to those found above: the best joint fit to the thermal/absorbed power-law model, with all parameters the same for both XMM and Chandra datasets, has for 122 d.o.f. and gives a somewhat higher keV, an intrinsic absorbing column for the power-law component cm-2, power-law photon index , and unabsorbed 1-keV power-law flux density of nJy. The improvement in the fit obtained by allowing the parameters of the power law component in the Chandra and XMM datasets to vary independently is marginal ( for 119 d.o.f.) and the best-fitting parameters are similar. A more significant improvement ( for 120 d.o.f.) is obtained by fitting two mekal models with different temperatures together with the absorbed power law, suggesting that there may be temperature structure in the extraction region: in this model the lower temperature is keV, and so is consistent with the temperature measured in the inner 1.5 arcsec, while the higher temperature is keV. We discuss temperature structure in more detail in Section 3.6. The normalizations for the power-law component in both these fits agree with that determined from the small-aperture Chandra fit described above within the large fitting uncertainties.
3.4 The jet
The Chandra detection of X-ray emission from the inner part of the N jet of 3C 465 is the first X-ray detection of a WAT jet. X-ray emission appears to come predominantly from the two brightest knots of the radio jet, denoted NJ1 by Hardcastle & Sakelliou (2004) (Fig. 1). It is hard to assign a statistical significance to the detection of the inner knot (labelled knot 1 in Fig. 1), because of the difficulty in measuring a good background so close to the bright, asymmetrical central X-ray emission from the core and central thermal component: our best estimate, based on local matched background circles, is that it contains counts. Knot 2, which corresponds to the brightest discrete feature of the radio jet, contains counts, and there are a few more counts plausibly associated with the jet in the bright jet region beyond it. No X-ray emission from the jet is detected beyond 7.5 arcsec (4.4 kpc). Knot 2 is resolved transversely in the radio, with a deconvolved Gaussian FWHM of 0.3 arcsec; this suggests that it should be essentially unresolved to Chandra, and the observed X-ray emission is consistent with that suggestion. There are too few counts in the region of the jet from knot 2 onwards to extract a spectrum and carry out detailed model fitting, but the two-bin spectrum that can be extracted from the region marked on the figure suggests a steep X-ray power-law photon index (). Assuming this photon index and Galactic absorption, the X-ray flux density from this region of the jet is nJy. The corresponding radio flux density is 6.6 mJy at 8.4 GHz, so that the two-point radio-X-ray spectral index is 0.92. The unabsorbed jet flux in the ROSAT band is ergs cm-2 s-1, corresponding to a luminosity of ergs s-1 at the distance of 3C 465 (assuming no beaming). The inner region of the jet is clearly different from the outer region (beyond 7.5 arcsec): if the straight region of the outer jet were similar in X-ray properties to the inner parts, we would expect to have detected it at the level of Chandra counts, whereas fewer than 30 () are detected. However, the outer jet shows no clear knots of radio emission until the base of the plume (see below).
3.5 ‘Hotspots’ and plume bases
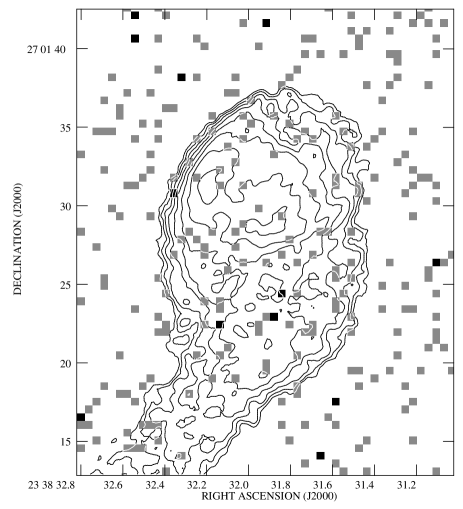
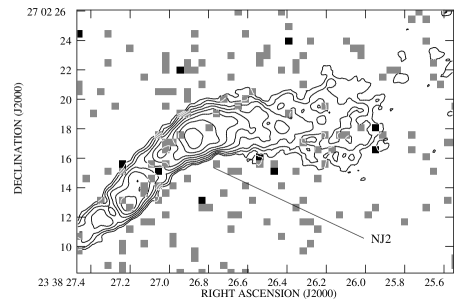
There is no significant detection of X-ray emission from the radio-bright bases of the plumes in 3C 465 (Fig. 3). The strongest limit on the radio/X-ray ratio from these regions comes from the bright southern plume base. In a circular region around the brightest radio emission from this region we can set an upper limit of 25 Chandra counts, corresponding to nJy assuming a power-law model with a photon index of . The radio flux density in the same region is 143 mJy, so that the two-point radio-X-ray spectral index is . This is steeper than is observed for any detected FRI jet base; if the plume base had had a more typical value for FRI jets of (similar to the knots in the inner jet, see above), it would have been detected at the level of counts. As pointed out by Hardcastle & Sakelliou (2004), 3C 465 does not show any obvious hotspot-like jet termination features, but the best candidate feature, the knot at the end of the northern radio jet (NJ2 in their notation: labelled in Fig. 3) is also not significantly detected in the X-ray.
3.6 Small-scale thermal emission
To characterize the small-scale thermal emission implied by the images and the spectral fits of Section 3.3, we carried out radial profile fitting to the inner 35 arcsec of the Chandra dataset, taking background from the region between 35 and 45 arcsec and excluding a pie slice at the position angle of the jet and the emission from the nearby companion galaxy (see Section 3.7). We use the PSF parametrization of Worrall et al. (2001). The radial profile is best fitted with a combination of a small model and a point-like component (Fig. 4). The fit is good ( for 40 d.o.f.) and the best-fitting model parameters are , arcsec (errors are for 2 interesting parameters). In this model the point-like component contributes counts in the 0.5–5 keV energy range: this compares well with the number estimated from spectral fitting in Section 3.3. These observations confirm the suggestion based on ROSAT data (Sakelliou & Merrifield 1999) that there is a component of extended X-ray emission associated with NGC 7720.
We used spectral fitting in concentric annuli in the inner 30-arcsec region to investigate whether there was evidence for temperature structure in this small-scale thermal component. Identical background regions, between 30 and 40 arcsec, were taken for each fit. The results are shown in Table 1. Either simply fitting spectra to each annulus, or using the xspec deprojection model, we find evidence that there is a temperature gradient in the small-scale thermal material in the centre of A2634.
Using the temperatures measured above in combination with the radial profile, we estimate the central density of the small-scale thermal material in 3C 465 to be m-3, while the central pressure is Pa. The central cooling time of this material is short ( years). These conditions are very similar to those found in the central components of more normal, non-WAT FRI radio galaxies hosted by groups (e.g. Hardcastle et al. 2002, 2005).

| Annulus | Independent fits | Deprojected fits | ||
|---|---|---|---|---|
| (arcsec) | Temperature | Temperature (keV) | ||
| (keV) | (fixed ) | (fixed ) | (free ) | |
| 0–1.5 | 37/25 | |||
| 1.5–3 | 27/16 | |||
| 3–7.5 | 32/17 | |||
| 7.5–30 | 9/13 | |||
The fit to the central bin includes an obscured power-law component as discussed in Section 3.3. Abundance is fixed to 0.5 solar for the temperatures listed in the ‘fitted’ and ‘deprojected’ columns. The total values for the deprojected models were 109/71 (fixed abundance) and 86/70 (free abundance). The best-fitting abundance for the free-abundance deprojection model was .
3.7 The cluster galaxies
Eleven galaxies from the A2634 cluster were detected in the Chandra field of view; this is almost all of the bright cluster galaxies that are suitably positioned for Chandra imaging. Of these, the five brightest in X-rays and lying in the XMM field of view were also detected with XMM. The detected sources are listed in Table 2, along with some less bright elliptical galaxies that in general are not detected. We measured the Chandra counts for each source using circular extraction regions and concentric or adjacent background annuli, and, where spectral fitting was possible, fitted each Chandra spectrum (XMM spectra gave little additional information) with a combination of an unabsorbed, hard power-law model with fixed and a mekal model with fixed 0.5 solar abundance (the power-law component being intended to represent the contribution from X-ray binaries). Where galaxies were not detected, we set upper limits based on the Chandra background. Results are tabulated in Table 2. Where spectral fits were possible, most galaxies were fitted with a thermal model with a temperature between 0.5 and 0.8 keV, in some cases together with a less luminous power-law component. Cluster galaxies therefore do contain some hot gas, though the luminosity even of the brightest system is about an order of magnitude less than that of the extended X-ray emission associated with NGC 7720 itself. The typical galaxy X-ray luminosities – calculated from the fitted model where possible, and using a thermal model with keV for the weaker sources or upper limits – are comparable to the luminosities estimated for the class of optically brighter galaxies by Sakelliou & Merrifield (1998), after correction for the different cosmology used in that paper; this suggests that the analysis carried out in that paper, where individual galaxies were not significantly detected, was broadly correct, although the presence of some emission best modelled as thermal suggests that the galaxy atmospheres have not been fully stripped. When plotted on the relation (Fig. 5), some of the early-type galaxies we detect lie above the relation found by Sakelliou & Merrifield (their fig. 6), though the errors on their relation are large. However, it should be noted that several of the galaxies we detect are unusual in the sense of being possibly interacting (e.g. P257 and 259) and were excluded from the analysis of Sakelliou & Merrfield.
| Galaxy ID | Type | XMM | RA | Dec | Ext’n | Chandra | Spectral fit | Luminosity | ||
|---|---|---|---|---|---|---|---|---|---|---|
| det’n? | h m s | ∘ ′ ′′ | radius | counts | ( | ( | ||||
| (arcsec) | ergs s-1) | ) | ||||||||
| P202 | E | U | 23 38 29.6 | 27 02 05 | 3 | – | 0.5 | |||
| P246 | S0 | N | 23 38 52.5 | 26 56 22 | 15 | * | 0.3 | |||
| P257 | E | Y | 23 38 29.2 | 26 58 44 | 9 | mekal + pow, | 1.1/3 | 2.4 | 1.3 | |
| P256 | E | N | 23 38 34.4 | 26 58 46 | 9 | mekal, | 1.4/1 | 0.8 | 0.4 | |
| P259 | E | Y | 23 38 26.8 | 26 59 06 | 8 | mekal + pow, | 0.5/1 | 1.5 | 1.3 | |
| P263 | E | Y | 23 38 38.8 | 27 00 41 | 9 | mekal, | 4.0/4 | 2.0 | 1.0 | |
| P271 | S0 | N | 23 38 36.3 | 27 01 48 | 9 | – | 0.9 | 0.7 | ||
| P275 | E | N | 23 38 33.3 | 27 02 05 | 5 | – | 0.4 | 2.4 | ||
| P294 | S0 | N | 23 37 53.7 | 27 05 18.4 | 20 | * | 0.3 | |||
| P295 | S0 | N | 23 38 27.1 | 27 05 25 | 10 | – | 0.5 | 0.3 | ||
| P302 | S | Y | 23 39 11.7 | 27 06 55 | 19 | * | pow | 2.8/3 | 2.7 | |
| P308 | E | N | 23 38 22.8 | 27 09 29 | 10 | 1.1 | ||||
| P316 | S0 | N | 23 38 46.3 | 27 10 20 | 15 | * | 0.4 | |||
| P320 | S0 | N | 23 39 07.0 | 27 12 21 | 20 | * | 0.3 | |||
| P321 | S0 | N | 23 38 41.7 | 27 12 54 | 10 | * | 0.2 | |||
| P322 | S0 | N | 23 38 50.1 | 27 12 53 | 20 | * | 1.1 | |||
| P324 | S0 | Y | 23 38 43.7 | 27 12 57 | 22 | * | mekal, | 2.8/2 | 2.9 | 1.7 |
| P331 | E/S0 | – | 23 38 50.5 | 27 16 06 | 23 | * | mekal, | 0.3/1 | 2.0 | 2.1 |
The galaxy IDs refer to the numbers allocated by Pinkney et al. (1993): P202 is the companion galaxy, also known as NGC 7720A. The XMM detection column indicates whether a galaxy was detected by XMM (Y), undetected although in field of view (N) or undetectable due to proximity to another source (U) or through being out of the field of view (–). Extraction regions used reflect the detected X-ray emission, the need to avoid including emission from other sources, and the size of the PSF at the off-axis distance of the source: the standard extraction region of 9 arcsec for the on-axis sources corresponds to 5 kpc at the distance of the cluster. Chandra counts quoted are in the 0.5–5 keV energy range. Counts marked with an asterisk are from one of the front-illuminated chips, the others are from ACIS-S3. X-ray luminosities are in the Einstein range (0.2–3.5 keV) and are calculated from the absorbed flux assuming a luminosity distance of cm. Where no spectral fit was possible, a mekal model with keV was used to estimate luminosity. Optical luminosities are taken from the values used by Sakelliou & Merrifield (1998), updated to the cosmology of the present paper.

3.8 The cluster
3.8.1 Cluster structure
Examination of the image shown in Fig. 2 shows that there is considerable structure in the large-scale cluster emission, as inferred previously from the ROSAT images. We have verified, by masking out the XMM and Chandra-detected point sources using the dmfilth tool in ciao, that little of the structure seen in Fig. 2 can be attributed to combinations of weak point sources. Three features of the image are of particular interest:
-
1.
The elongation of the central X-ray emission on arcmin scales in a direction perpendicular to that of the jet axis, but similar to that of the isophotes of the host galaxy (features that were originally pointed out by E84). The elongation can be seen particularly clearly in the Chandra data, as illustrated in Fig. 6.
-
2.
The larger-scale elongation of the X-ray emission in the same direction, particularly to the SW. This is the extension seen in the images of Schindler & Prieto (1997) and Sakelliou & Merrifield (1999).
-
3.
The apparent decrements in X-ray surface brightness at the positions of the bases of the plumes. Measurements of count density using regions defined from the adaptively smoothed maps shows that these deficits are significant at the – level. (It should be noted, however, that there are apparent deficits at similar significance to the NE and SW, which do not correspond to the positions of any radio feature.)
It is worth commenting briefly on the elongation of the X-ray emission. Fig. 6 strongly suggests that the extension is brighter in the SW direction, or ‘behind’ the galaxy if we were to adopt a model in which the plume bending is related to the motion of the galaxy (see Section 4.4 for discussion of this point). To confirm this, we carried out radial profiling in angular ranges guided by the structure seen in Fig. 6. The results are shown in Fig. 7; a clear excess in both directions can be seen, but the extension in the SW direction is systematically brighter. This agrees with the results that E84 found on larger scales. They commented that the optical galaxy shows the same asymmetry, a result we confirm by identical radial profiling of the DSS-2 image. In a model in which the host galaxy is moving through the ICM, it is tempting to model the excess extension in the SW direction as a ‘wake’ due to ram-pressure stripping of the small-scale thermal component and/or Bondi-Hoyle accretion behind the galaxy. At least one other WAT exhibits X-ray evidence for a wake (Sakelliou et al. 1996, 2005). While we do not rule out the possibility of a weak wake in 3C 465, the wake model leaves two questions unanswered: 1) how can ram-pressure and/or accretion explain the asymmetry in the stars of the host galaxy? and 2) how does the small-scale wake relate to the elongation on much larger scales, which extends both to the NE and the SW of the present position of the host galaxy?

3.8.2 Global properties
To characterise the spatial and spectral structure of the extended emission we used the same techniques as we applied to the small-scale structure: as Schindler & Prieto (1997) argued, the departures from radial symmetry are predominantly on smaller scales and in any event do not dominate in terms of counts. We therefore extracted radial profiles for each camera in annuli centred on the X-ray core and extending to a radius of 625 arcsec, carrying out background subtraction in the way described by Croston et al. (2003). (Unlike our spectral extractions, the radial profile extraction does use double subtraction to take account of any differences between the cosmic X-ray background in our observation and in the background files: this is possible in this case because the radial profile fitting code we use can take into account the contribution of the fitted model to the background region.) The model fitted consisted of a point component, a model whose structural parameters were fixed to the best-fitting parameters for the small-scale emission determined with Chandra (Section 3.6) and a model whose core radius and value were allowed to vary. The normalization of each component was allowed to vary. The best-fitting large-scale model to the profiles from all three cameras had , arcsec (errors are for two interesting parameters) with for 237 degrees of freedom. The fit to the pn data is shown in Fig. 8; fits to the MOS profiles are similar. The fits agree with the Chandra fits in suggesting that the small-scale extended component dominates over the point-source component, though the uncertainties on the relative normalizations of the two components are large: the total counts found by the fits in the two small-scale components are consistent with what would be expected given the count rate obtained from the Chandra data.

The spectral properties of various regions of the cluster were estimated using the xspec deprojection model in combination with mekal thermal models and a power-law contribution in the central region. To make this model work effectively the regions used must cover a large region of the cluster, and so we used annuli extending out to 10 arcmin (as tabulated in Table 3) with background taken from the background files and with the corrections described in Section 2.1. As with the Chandra fits described above, we also tabulate the results of fitting independently to the annuli used. The abundance was initially fixed at 0.5 solar: if it was allowed to vary, the best-fitting joint value in the deprojection model was , with very similar temperatures (not tabulated).
| Annulus | Independent fits | Deprojected fits | |
|---|---|---|---|
| (arcsec) | Temperature | Temperature | |
| (keV) | (keV) | ||
| 0–30 | 75/71 | ||
| 30–60 | 98/76 | ||
| 60–120 | 217/221 | ||
| 120–240 | 323/280 | ||
| 180–240 | 315/335 | ||
| 240–300 | 329/372 | ||
| 300–600 | 318/475 | ||
The fit to the central bin includes an obscured power-law component as discussed in Section 3.3. Abundance is fixed to 0.5 solar (see the text). The total value for the deprojected model was 1671/1847.
It will be seen that the deprojected and independent fits give similar temperatures, around 4.5–5 keV, for the outer regions of the cluster. These temperatures are in reasonable agrement, within the errors, with the temperatures estimated from ROSAT PSPC data by Schindler & Prieto (1997), though somewhat higher than the cluster temperature of keV derived from ASCA data by Fukazawa et al. (1998). It remains possible that the temperatures we measure are contaminated by excess particle background, in spite of the steps we have taken to subtract this off (Section 2.1). However, we see no sign of an increase in temperature at large radii, as we might expect in such a scenario (and as we do in fact see without the particle background corrections). Instead, the temperatures are largely consistent with a constant value of keV beyond about 1 arcmin from the core.
Combining the XMM deprojection with the Chandra deprojection of Section 3.6, we obtain the temperature profile shown in Fig. 9. Whereas the XMM data alone might have suggested a significant temperature jump at around the jet termination distance in 3C 465 ( arcsec) the two datasets taken together strongly suggest a smooth temperature gradient as a function of distance, probably levelling out at keV.

The deprojection allows us to estimate particle densities in the deprojection annuli, which we can compare with those estimated from the radial profile analysis using the method of Birkinshaw & Worrall (1993). The radial profile values are necessarily calculated assuming a single conversion factor between count density and volume-normalized emission measure, and so cannot take account of temperature structure: we carry out the conversion assuming instrumental responses appropriate for temperatures of 4.7 keV for the outer region modelled with XMM data and 1.0 keV for the Chandra data that describe the inner region. On the other hand, the densities estimated using the deprojection model are emission-weighted densities and can only be at best representative of the density in the bin. The proton densities estimated using the two models are plotted as a function of radius in Fig. 10 (we assume for the purposes of the plot that the transition between the two models happens when their densities become equal at around 20 arcsec from the core). The plot shows that the agreement between the densities estimated using the two methods is reasonable, except perhaps in the outer bin, which would be expected to be most affected by the assumption of the deprojection algorithm that no cluster emission exists outside the deprojection region. We can therefore have reasonable confidence in pressures estimated using either method. The agreement between the two methods also suggests that the physical conditions we estimate are reliable in spite of the fact that we find lower values and core radii than other workers.


Pressure as a function of radius, estimated from the deprojection and from the radial profile fitting, is plotted in Fig. 11. To convert the density estimated from radial profile fitting to a pressure we have assumed a temperature which is constant at 0.66 keV within 2 arcsec and constant at 4.7 keV beyond 200 arcsec, and has a log-linear profile between those two radii (i.e. ): such a temperature profile is a reasonable description of the profile plotted in Fig. 9, though others could be devised. It can be seen that the pressure estimates are again reasonably consistent, as expected. Also plotted on Fig. 11 (dashed lines) are the minimum pressures in various components of the radio source. These are calculated from flux measurements from the 1.4 GHz and 8.4 GHz maps on the assumption of a synchrotron spectrum with , , a low-energy electron energy index of 2 (corresponding to ) and a break in the electron spectrum determined by the fluxes in the two maps. We assume no relativistic protons, a filling factor of unity, and a cylindrical geometry for all features. For the bright northern jet, we have estimated the minimum pressure in two ways: firstly assuming no projection or beaming (as was the case for all the other components) and secondly assuming an effective beaming speed of and an angle to the line of sight : this latter is a representative beaming value that reproduces the jet sidedness ratio measured by Hardcastle & Sakelliou (2004). These pressures are essentially true minimum pressures: only very implausible assumptions for the electron energy spectra can reduce them significantly, and then only by a factor . Fig. 11 shows that the inner jet is the only component, on either of these two models, that appears to have a higher minimum internal pressure than the external thermal material over some of its length. All the other regions of the source are underpressured with respect to the external pressure by factors of between about 3 and 30, as is typically found for the large-scale components of FRI sources (Hardcastle & Worrall 2000 and references therein). This conclusion is different from that of E84 partly because our estimated minimum pressures are slightly lower, but mostly because our external pressures are higher, as a result of a higher measured external temperature (their value of 1.85 keV is lower than any modern estimate) and a better-constrained model for the external density.
3.9 CL-37
Pinkney et al. (1993) and Scodeggio et al. (1995) both report the existence of a cluster of galaxies 12 arcmin to the NW of NGC 7720, with a redshift around 0.124. This cluster is detected in X-rays in the MOS1 and MOS2 cameras of XMM (it lies on the very edge of the pn field of view). Extracting a spectrum from a 75-arcsec radius circle around the X-ray centroid, with background taken from an adjacent larger circle, we find that the MOS1 and MOS2 data are well fitted (/d.o.f. = 84/88) by a mekal model with keV and abundance solar. The unabsorbed X-ray flux in this region is around ergs cm-2 s-1, which is substantially lower than the value predicted by Scodeggio et al. from the luminosity-velocity dispersion relationship even after correcting to the cosmology used here, although the extraction region is not large at the distance of CL-37. However, as the measured temperature would correspond (e.g. Edge & Stewart 1991) to an expected velocity dispersion in the range 400–600 km s-1, it seems likely that the true velocity dispersion of the cluster is less than the value of km s-1 quoted by Scodeggio et al.. Given the large uncertainties on the result of Scodeggio et al. , their comment that the velocity structure of the cluster is complex, and the large scatter in the - relationship, the true velocity dispersion can be estimated to be something closer to km s-1.
4 Discussion
4.1 X-ray emission from the jet and plumes
It is conventional to believe (e.g. Leahy 1993) that the jets of WAT sources are physically similar to those in classical double (FRII) radio galaxies and quasars; evidence for this comes from their narrow and sometimes one-sided appearance (as in 3C 465), the polarization structure they exhibit and their frequent termination in compact, shock-like features similar to the hotspots in FRIIs (Hardcastle & Sakelliou 2004). X-ray emission from FRII-like (‘type II’) jets, particularly in quasars and other sources where the jet is a priori thought to make a small angle to the line of sight, is often attributed in the literature to inverse-Compton scattering of the cosmic microwave background radiation by a jet with a high bulk Lorentz factor (), based on the observations that a one-zone synchrotron model cannot be fitted to the data and that the inverse-Compton process without beaming requires a large departure from the equipartition condition (e.g. Tavecchio et al. 2000). However, the generally accepted picture of X-ray emission from FRI-like (‘type I’) jets is that they are due to synchrotron emission related to the strong deceleration of the jet flow expected on other grounds in the inner few kpc of these systems (e.g. Hardcastle et al. 2001, 2002); in these cases a one-zone synchrotron model is often a good fit to the overall jet spectrum (although the details of jet structure may in fact be complex on scales that cannot be resolved in most sources: Hardcastle et al. 2003) while a beamed inverse-Compton model requires implausible jet parameters.
The detection of 3C 465’s inner jet in X-rays, at a level similar to what would be predicted using a simple synchrotron model based on observations of type I jets, lends support to the idea that some type II jets can be synchrotron sources. There is already evidence for this from the comparatively strong detections of the pre-flaring jets, thought to be type II, in some FRI sources, notably 3C 66B and Cen A (Hardcastle et al. 2001, 2003) as well as X-ray detections of components of the jets of some FRII sources (e.g. 3C 219, Comastri et al. 2003; 3C 452 and 3C 321, Hardcastle et al. 2004; 3C 403, Kraft et al. 2005) for which it is highly implausible that a beamed inverse-Compton model can be an explanation. 3C 465 is particularly interesting in this context for three reasons: (1) it is generally accepted that WAT jets are type II, (2) the emission from the jet is not confused by inverse-Compton emission from any surrounding lobes, and (3) there is no confusion between jet knots and hotspots, which can also be synchrotron X-ray sources. 3C 465’s detection thus gives us a reason to reiterate a point already made by Hardcastle et al. (2004) and Kraft et al. (2005): there are clearly X-ray-emitting type II jets for which the beamed inverse-Compton model is not the explanation. Since there is no compelling reason to expect a one-zone synchrotron model to be a good fit in an FRII jet in which the loss spatial scale may be two to three orders of magnitude smaller than the region of the jet being considered, observers should be wary of ruling out the possibility that synchrotron emission is responsible for the X-rays from a given type II jet.
On the other hand, the non-detection of the bases of the plumes of 3C 465 in X-rays, at a level sufficient to show that their radio to X-ray spectral index is significantly greater than that seen in all FRI jets, strongly suggests that these regions are not analogous to the bases of type I jets. This is as expected in the picture of these objects proposed by Hardcastle et al. (1998) and Hardcastle & Sakelliou (2004), in which the jet decelerates rapidly at a single point close to the base of the plume, rather than there being uniform distributed deceleration over a finite-sized region of the base of the plume. We conclude that the non-detection of the plumes in X-rays in the Chandra observations is evidence that the bases of WAT plumes are physically different from the bases of FRI type I jets; WAT plumes are probably more similar to the large-scale jets of FRIs, which typically do not show either strong deceleration or X-ray emission.
It is not clear why we do not see X-ray emission associated with the assumed rapid deceleration of the jet at the base of the plume, by analogy with the X-ray emission detected from the hotspots of many low-luminosity FRII radio galaxies, thought to be synchrotron in origin (Hardcastle et al. 2004 and references therein). Features as faint as the brightest knot at the end of the N jet (NJ2 in the notation of Hardcastle & Sakelliou: see also Fig. 3) have been detected in X-ray observations of FRII hotspots. However, as we noted above, there is no particularly good candidate feature analogous to a hotspot in the radio images of 3C 465; the jet flow clearly continues after NJ2. Chandra images of WATs that do exhibit compact bright jet termination structures would be of considerable interest.
4.2 WAT termination
We begin by noting that the conclusions of Jetha et al. (2005), based on less sensitive observations, apply to 3C 465 as well. There is no evidence in the data either for discrete features associated with the jet termination points or plume bases or for discontinuities in the properties of the external medium at the distances of the jet-plume transition, such as the shock structures in the models of Loken et al. (1995); in particular, our observations show that the apparent temperature discontinuity seen in the inner regions of the sources studied by Jetha et al. was probably an unresolved temperature gradient. Models that require a discontinuity in the external medium are thus ruled out by observation. The jet termination is on a similar scale to the transition between the central, cool X-ray core and the hotter cluster medium, again as observed by Jetha et al., but as yet we have no clear idea of why this should be the case. As Jetha et al. suggest, numerical modelling of realistic (fast, low-density) jets and plumes in realistic cluster environments may be the way forward here. It is also interesting to note that the transition occurs close to the point where the jet internal (minimum) pressure starts to exceed the external thermal pressure (Section 3.8 and Fig. 11). X-ray and radio data of similar quality for a larger number of sources would be required to say whether this is more than a coincidence.
4.3 Pressures and particle content
Our detailed X-ray and radio observations have given a very clear indication that the large-scale plumes of 3C 465 behave similarly to the lobes or plumes of normal twin-jet FRI sources: the minimum pressures in the lobes are about an order of magnitude below the external thermal pressures. This implies some sort of departure from the minimum-energy condition, either a departure from equipartition between the radiating electrons and magnetic fields, a population of non-radiating relativistic particles, or a contribution to pressure from particles that do not participate in equipartition, such as thermal protons. As usual (e.g. Hardcastle et al. 1998, Croston et al. 2003) we cannot tell which of these is the case. In the inner parts of normal FRI jets the jet deceleration is thought to be by entrainment of external material, which has suggested that the entrained material might supply the missing pressure if it could be heated efficiently so as to avoid thermal X-rays from the lobes or plumes (see e.g. Croston et al. 2003). In WAT plumes, the jets are not expected to have entrained significant amounts of external material, since they do not show the deceleration-related structures of FRI jets, and so this explanation seems less likely (see also below, Section 4.4). On the other hand, if we assume that equipartition does not hold, it is not clear why such a large departure from equipartition should be required in WAT plumes but not in FRII lobes, where inverse-Compton evidence (e.g. Hardcastle et al. 2002, Belsole et al. 2004, Croston et al. 2004) suggests that equipartition is roughly maintained and that the electrons and magnetic fields alone are sufficient to provide pressure balance with the external medium. The departure from equipartition would correspond to around a factor 5 difference between the actual magnetic field strength and the equipartition value; this is considerably larger than is typically seen in the X-ray-detected lobes of FRII radio galaxies (Croston et al. 2005). In addition, a departure from equipartition sufficient to make the internal pressure equal to the external pressure in the direction of electron domination would give rise to strong inverse-Compton emission from the plumes, at the level of a few thousand XMM counts, which is not observed – the deficits in X-ray count rate seen at the bases of the plumes seem to rule out this model, so that the lobes would have to be magnetically dominated if electrons and magnetic field alone were to supply the required pressure. The third possibility is that the plumes contain an energetically dominant population of relativistic protons: this cannot be ruled out directly by the data, but again arguments based on inverse-Compton detections suggest that it is not the case in the hotspots (Hardcastle et al. 2004) or lobes (Croston et al. 2005) of FRII sources. We return to the particle content of the plumes in the next section.
4.4 Bending
It is instructive to revisit the arguments of E84 that led to the conclusion that the bending of 3C 465 in particular, and of WATs in general, was difficult to explain in any model. They assumed that the kinetic energy of the plume must supply the overall observed radio luminosity: that is, the bulk flow is cold and there is in situ particle acceleration at all points in the plume. This leads to a condition on the density and speed of a non-relativistic plume:
| (1) |
(their eq. 2) where is a factor giving the efficiency of conversion between kinetic energy and energy of relativistic electrons, is the plume radius, is its density and is its speed. They assumed in situ particle acceleration on the basis of estimates of the synchrotron loss timescale at 5 GHz, and so we note to begin with that it may not be necessary to satisfy this condition in its original form. The synchrotron age of material at the end of the plumes is years, based on 1.4 GHz and 330 MHz data taken from the VLA archives, if we assume a Jaffe & Perola (1973) aged synchrotron spectrum, an injection index of 2.0 and a loss magnetic field strength around the minimum-energy value of 0.4 nT (taking into account CMB losses), and consequently material can be transported out from the jets or plume bases without in situ reacceleration so long as , or 2500 km s-1.
E84 used the lack of observed depolarization to place a limit ( m-3) on the density of thermal material (effectively, protons) in the tails. This method of setting a density limit has fallen out of favour in recent years, partly because it does not provide a strong upper limit (Laing 1984) and partly because it seems unlikely that the limits it does provide are close to the true values, which may be much lower. It may thus not be appropriate to use a proton density around – m-3 as a ‘typical’ value in the plumes. Observationally, there are few other constraints on the internal density available: as discussed above, we know from the X-ray deficits seen in both ordinary FRIs and in cluster-centre objects (e.g. Bîrzan et al. 2004) that the missing pressure in these sources is not supplied by thermal protons at the temperature of the external medium, but this only really gives the constraint that the internal density is likely to be much lower than the external one. A true limit comes from considering the minimum possible internal density. If we assume that the WAT plumes are in pressure balance and that the internal pressure is supplied by relativistic particles and magnetic field, presumably with some departure from the minimum energy condition, the plume material remains very light compared to the external medium: we require , where , and the effective density of the internal material is , while the external density is , where is the mass per particle in atomic mass units (about 0.6). The density contrast is thus , or about for the temperature of the 3C 465 cluster. The internal density (in terms of an equivalent proton density) in this model, which represents a minimum possible internal density if we think that the plumes are not underpressured, would be of the order of 0.04 m-3, much lower than the ‘typical’ values used by E84. Such a light plume is comparatively easy – perhaps even too easy – to bend by ram pressure; if the flow speed up the plume, , were comparable to the local external sound speed ( km s-1), bulk motions with speeds of would have a significant effect, while if were comparable to the speed estimated above from spectral ageing arguments, we would require external bulk motions with speeds around . If instead we adopt the luminosity condition (eq. 1) to estimate the flow speed, retaining this low internal density, then we would obtain a bulk speed around [for a radiative efficiency of 0.1, which may be generous, in view of the jet luminosity inferred for the weaker source 3C 31 by Laing & Bridle (2002)] and, because of the low internal density, bulk motions with speeds around would still be sufficient to bend the plume: as E84 comment, low jet densities are possible, but require high speeds if the luminosity condition is to be satisfied.
If, on the other hand, the pressure deficit at minimum energy is supplied by hot, entrained, internal thermal material, as is possible for FRI lobes, then we know only that the density contrast is (since the thermal protons then dominate the density of the flow) and in that case external bulk motions at the sound speed can bend the plume significantly if , which for moderate heating of the internal protons requires plume speeds that are at most mildly supersonic: for example, if the plume speed is 2500 km s-1, then the internal protons must be heated to around 20 keV (which would also give a density for internal protons that was close to the ‘limit’ on internal density inferred by E84). Bending by subsonic motions requires a correspondingly higher temperature, increasing as , but this is not impossible, as we have little information on the temperature of the internal protons. In the case of a proton-dominated plume the luminosity condition, eq. 1, requires , and it can be shown that very high internal temperatures ( K), correspondingly low densities, and high plume flow speeds () are required for the plume to be bent by sub-sonic bulk motions in the external medium. To summarize, the plumes can be bent by bulk motions in the external medium if they are light, but they will only also meet the luminosity condition of E84 if they are also fast. If we drop the assumption of in situ acceleration (and instead assume passive transport of radiating electrons) then the plumes need only be mildly supersonic, but must still be light.
This conclusion revives the possibility that the plumes are in fact bent by the motion of the galaxy with respect to the host cluster. E84 suggest that the systematic motion of NGC 7720 could be of order 100–300 km s-1, or –. Their estimate does not necessarily rule out higher galaxy speeds, because they base it on the radial velocity of the galaxy with respect to the cluster mean (which does not tell us about motions in the plane of the sky) and on studies of the radial velocities of cDs in general (which may not be representative of the systems hosting WATs). The possible detection of an X-ray wake behind 3C 465 (Section 3.8.1) may indicate a higher speed. Nevertheless, it is interesting that the speed estimate of E84 is within the range estimated above for plume bending either if the plume’s internal pressure is supplied entirely by relativistic particles and the plume is fast, or if a slower plume’s internal pressure is supplied by very hot thermal material. Is this picture consistent with the fact that the inner jets are not bent? This question is more difficult to answer because we do not have a reliable estimate for the inner jet speed or density, and we cannot assume pressure balance in the jet. If we assume (from the beaming analysis) and take the minimum equivalent internal density to be given by , using the minimum pressure plotted in Fig. 11, then we can use Euler’s equation in the form
| (2) |
where is the radius of curvature of the jet, is the galaxy speed, and is the width of the jet. (The non-relativistic approximation is not badly wrong in this case.) From the radio maps we can see that the radio jet bends, if it bends at all, by less than one jet width over its observed length . Taking arcsec (which includes the effects of projection with ), arcsec, and an external density comparable to that at the transition between the hot and cool components in the X-ray (1500 protons m-3) we find that speeds of 120 km s-1 could produce a bend of one jet width. As this is very consistent with the possible values for systematic motion of the galaxy, and as our estimate of is a lower limit, we are satisfied that an explanation for the plume bending in terms of the systematic motion of the galaxy through the cluster is not inconsistent with the observations of essentially straight inner jets, provided that the jets are fast. We emphasise, however, that this model is only viable if the plume is light. If there is substantial entrained thermal material, then the analysis above suggests that sub-sonic motion of the galaxy through the cluster material is too slow to have a significant effect on the plumes. It is interesting in this context that there is a population of WAT sources with bent inner jets (exemplified by 0647+693, Hardcastle & Sakelliou 2004): if the jets in these sources are bent by ram pressure due to the host galaxy’s motion, then the model we have discussed suggests either that the jets in these sources are weaker (transport less energy) or slower, or that the systematic motions of the host galaxies are larger. We will investigate this possibility in more detail elsewhere.
These results, combined with those of the previous subsection, mean that there are some interesting possible differences between WATs and classical FRI sources. On the one hand, we have shown (Section 4.3) that the large-scale plumes of 3C 465 are very similar to the extended structure of other FRI sources in terms of the difference between the minimum internal pressure and the external pressure: in FRIs one of the best explanations for this observation is that the pressure deficit is supplied by heated, entrained material. On the other hand, as we have seen, bending of the 3C 465 plumes by galactic motions puts limits on the amount of entrained material that is present: for example, if we adopt a plume speed of 2500 km s-1, then significant bending by bulk speeds of km s-1 require thermal densities several orders of magnitude below the external density (with correspondingly high temperatures if we want this material to supply the missing pressure), while satisfying the E84 luminosity condition requires even lower densities. These densities are considerably lower than the densities estimated by O’Dea (1985) from the bending of narrow-angle tail (NAT) sources. Although it would be interesting to revisit the calculations of O’Dea with modern estimates of the external density, and to compare them to estimates of the proton density required to provide pressure in the lobes, this may be an indication that type II jets such as those in 3C 465 are less efficient at entraining thermal material than the type I jets of NATs.
5 Conclusions
Our principal results can be summarized as follows:
-
1.
The detection of X-ray emission from the inner part of the jet of 3C 465 adds significantly to the evidence that fast (at least mildly relativistic), efficient, FRII-like (‘type 2’) jets can be sources of X-ray synchrotron radiation.
-
2.
The non-detection of X-ray emission from the jet termination point and the bases of the plumes rules out a model in which the plume bases resemble the bright bases of FRI radio jets, which are often X-ray synchrotron sources: this is consistent with our favoured model for the WAT jet-plume transition, in which the deceleration of the fast inner jets takes place rapidly when the jet interacts with the external medium at the edge of the plume, rather than slowly by entrainment as in FRI jets. However, it is interesting that there is no detection of synchrotron X-rays from any of the plausible candidates for the jet termination ‘hotspot’ in 3C 465, unlike the situation in the (supposedly physically similar) hotspots in low-power FRII sources. More X-ray observations of WATs with bright jet termination hotspots are required.
-
3.
We have made detailed measurements of the temperature and density structure of 3C 465’s host cluster, A2634, and in particular have resolved a central dense, cool thermal component with a relatively short cooling time, which is similar to the components seen in other WATs and to the central components of FRI sources in groups. There is no evidence for any discontinuity in the properties of the external medium, and so we conclude, following Jetha et al. (2005), that models of WAT formation that require such discontinuities are ruled out. The most likely scenario based on our observations and those of Jetha et al. is that the location of the jet-plume transition is related to the emergence of the jet from the small-scale cool component associated with the host galaxy, but the physical mechanism that sets the location of the plume base remains unclear.
-
4.
Our observations show that the minimum pressures of the plumes fall below the pressures estimated for the external thermal material: this implies either some departure from the minimum-energy (equipartition) condition or an additional contribution to pressure from low-density, hot thermal material. The plumes of WATs are thus similar to the large-scale components of more normal FRI sources.
-
5.
Revisiting the arguments related to WAT plume bending, we find that the plumes can be bent by sub-sonic bulk motions of the ICM, or by plausible motion of the host galaxy through the ICM, provided that they are extremely light with respect to the external medium (as would be the case if their internal pressures were dominated by relativistic particles and/or magnetic field).
Acknowledgments
We thank Dan Evans for discussions of the X-ray core and helpful comments on the paper, Nazirah Jetha for discussions of WAT properties, and an anonymous referee for helpful comments. MJH thanks the Royal Society for a research fellowship. The National Radio Astronomy Observatory is a facility of the National Science Foundation operated under cooperative agreement by Associated Universities, Inc. This work is based on observations obtained with XMM-Newton, an ESA science mission with instruments and contributions directly funded by ESA Member States and NASA.
References
- [] Arnaud, M., et al., 2002, A&A, 390, 27
- [] Belsole, E., Worrall, D.M., Hardcastle, M.J., Birkinshaw, M., Lawrence, C.R., 2004, MNRAS, 352, 924
- [] Bicknell, G.V., 1994, ApJ, 422, 542
- [] Birkinshaw, M., Worrall, D.M., 1993, ApJ, 412, 568
- [] Bîrzan, L., Rafferty, D.A., McNamara, B.R., Wise, M.W., Nulsen, P.E.J., 2004, ApJ, 607, 800
- [] Burns, J.O., 1981, MNRAS, 195, 523
- [] Burns, J.O., Rhee, G., Owen, F.N., Pinkney, J., 1994, ApJ, 423, 94
- [] Comastri, A., Brunetti, G., Dallacasa, D., Bondi, M., Pedani, M., Setti, G., 2003, MNRAS, 340, L52
- [] Croston, J.H., Hardcastle, M.J., Birkinshaw, M., Worrall, D.M., 2003, MNRAS, 346, 1041
- [] Croston, J.H., Birkinshaw, M., Hardcastle, M.J., Worrall, D.M., 2004, MNRAS, 353, 879
- [] Croston, J.H., Hardcastle, M.J., Harris, D.E., Belsole, E., Birkinshaw, M., Worrall, D.M., 2005, ApJ submitted
- [] Edge, A.C., Stewart, G.C., 1991, MNRAS, 252, 428
- [] Eilek, J.A., Owen, F.N., 2002, ApJ, 567, 202
- [] Eilek, J.A., Burns, J.O., O’Dea, C.P., Owen, F.N., 1984, ApJ, 278, 37 [E84]
- [] Fukazawa, Y., Makishima, K., Tamura, T., Ezawa, H., Xu, H., Ikebe, Y., Kikuchi, K., Ohashi, T., 1998, PASJ, 50, 187
- [] Gómez, P.L., Pinkney, J., Burns, J.O., Wang, Q., Owen, F.N., Voges, W., 1997a, ApJ, 474, 580
- [] Gómez, P.L., Ledlow, M.J., Burns, J.O., Pinkney, J., Hill, J.M., 1997b, AJ, 114, 1711
- [] Hardcastle, M.J., 1998, MNRAS, 298, 569
- [] Hardcastle, M.J., 1999, A&A, 349, 381
- [] Hardcastle, M.J., Birkinshaw, M., Worrall, D.M., 2001, MNRAS, 326, 1499
- [] Hardcastle, M.J., Sakelliou, I., 2004, MNRAS, 349, 560
- [] Hardcastle, M.J., Worrall, D.M., 2000, MNRAS, 319, 562
- [] Hardcastle, M.J., Worrall, D.M., Birkinshaw, M., Laing, R.A., Bridle, A.H., 2002, MNRAS, 334, 182
- [] Hardcastle, M.J., Worrall, D.M., Kraft, R.P., Forman, W.R., Jones, C., Murray, S.S., 2003, ApJ, 593, 169
- [] Hardcastle, M.J., Worrall, D.M., Birkinshaw, M., Laing, R.A., Bridle, A.H., 2005, MNRAS in press
- [] Higgins, S.W., O’Brien, T.J., Dunlop, J.S., 1999, MNRAS, 309, 273
- [] Hooda, J.S., Wiita, P.J., 1996, ApJ, 470, 211
- [] Jaffe, W.J., Perola, G.C., 1973, A&A, 26, 423
- [] Jetha, N.N., Sakelliou, I., Hardcastle, M.J., Ponman, T.J., Stevens, I.R., 2005, MNRAS, in press
- [] Jones, C., Forman, W., 1984, ApJ, 276, 38
- [] Jones, C., Mandel, E., Schwarz, J., Forman, W., Murray, S.S., Harnden, F.R., 1979, ApJ, 234, L21
- [] Kraft, R.P., Hardcastle, M.J., Worrall, D.M., Murray, S.S., 2005, ApJ submitted
- [] Laing, R.A., 1984, in Bridle A.H., Eilek J.A., eds, Physics of Energy Transport in Radio Galaxies, NRAO Workshop no. 9, NRAO, Green Bank, West Virginia, p. 90
- [] Laing, R.A., Bridle, A.H., 2002, MNRAS, 336, 1161
- [] Leahy, J.P., 1984, MNRAS, 208, 323
- [] Leahy, J.P., 1993, in Röser H.-J., Meisenheimer K., eds, Jets in Extragalactic Radio Sources, Springer-Verlag, Heidelberg, p. 1
- [] Loken, C., Roettiger, K., Burns, J.O., 1995, ApJ, 445, 80
- [] O’Dea, C.P., 1985, ApJ, 295, 80
- [] Pinkney, J., Rhee, G., Burns, J.O., Hill, J.M., Oegerle, W., Batuski, D., Hintzen, P., 1993, ApJ, 416, 36
- [] Read, A.M., Ponman, T.J., 2003, A&A, 409, 395
- [] Riley, J.M., Branson, J.B.A., 1973, MNRAS, 164, 271
- [] Sakelliou, I., Merrifield, M.R., 1998, MNRAS, 293, 489
- [] Sakelliou, I., Merrifield, M.R., 1999, MNRAS, 305, 417
- [] Sakelliou, I., Merrifield, M.R., McHardy, I.M., 1996, MNRAS, 283, 673
- [] Sakelliou, I., Acreman, D.M., Hardcastle, M.J., Merrifield, M.R., Ponman, T.J., Stevens, I.R., 2005, MNRAS submitted
- [] Schindler, S., Prieto, M.A., 1997, A&A, 327, 37
- [] Scodeggio, M., Solanes, J.M., Giovanelli, R., Haynes, M.P., 1995, ApJ, 444, 41
- [] Tavecchio, F., Maraschi, L., Sambruna, R.M., Urry, C.M., 2000, ApJ, 544, L23
- [] Worrall, D.M., Birkinshaw, M., Hardcastle, M.J., 2001, MNRAS, 326, L7