Probing the dark matter profile of hot clusters and the relation with XMM-Newton
Abstract
We present results based on XMM-Newton observations of a small sample of hot galaxy clusters. Making a full use of XMM-Newton’s spectro-imaging capabilities, we have extracted the radial temperature profile and gas density profile, and with this information, calculated the total mass profile of each cluster (under the assumption of hydrostatic equilibrium and spherical symmetry). Comparing the individual scaled total mass profiles, we have probed the Universality of rich cluster mass profiles over a wide range of radii (from 0.01 to 0.7 the virial radius). We have also tested the shape of cluster mass profiles by comparing with the predicted profiles from numerical simulations of hierarchical structure formation. We also derived the local mass-temperature () scaling relation over a range of temperature going from 4 to 9 keV, that we compare with theoretical predictions.
keywords:
Clusters of Galaxies , Large Scale Structure , X-rays , XMM-Newton Observations1 Introduction
In a framework where cosmic structure forms under the effect of gravitation alone, the population of galaxy clusters should be strongly similar. A similarity of shape is expected for the dark matter distribution in clusters due to the process of gravitational collapse. The gas “follows” the distribution of the dominant dark matter component within the gravitational well, and is in approximate hydrostatic equilibrium (between major mergers). Then the matter in clusters (be it baryonic or dark) has a similar distribution from cluster to cluster. Scaling laws are another aspect of cluster similarity and are a direct prediction from scenarios of structure formation based solely on gravitation. They express the correlation between physical quantities (such as temperature, luminosity, entropy,…), and in fact make clusters a two parameter population which depends only on the redshift and the total mass of each object. Each single other quantity can then be expressed as follows: .
The properties of cluster similarity are a powerful statistical tool for the study of the cluster population, and a rich source of information on structure formation and evolution. (For details see Arnaud et al. (2004) and reference therein).
The paper presents results in the currently-favored concordance cosmological model: km/s/Mpc, and .
2 Universality of the mass distribution
We have investigated the shape of the dark matter profile in clusters of galaxies using a sample of five rich, relaxed nearby clusters with temperatures ranging between 4 and 9 keV. The different steps in the computation of each mass profile are:
-
•
The computation of an azimuthally-averaged surface brightness (SB) profile, which is then parameterized with either (a) the sum of -models (, BB or BBB model, Pointecouteau et al. 2004) or (b) a modified double -model allowing a peaked density distribution toward the cluster center (i.e KBB model, Pratt & Arnaud 2002).
-
•
Spatially-resolved spectroscopic fits of annular regions to obtain a temperature profile. The output projected temperature profile is then corrected for projection effects and for the effects of PSF blurring. This is achieved through a Monte Carlo simulation in which the projected profile is randomly sampled 1000 times within the observed errors, parameterized using the functional form of Allen et al. (2001), and subsequently corrected for projection and PSF effects.
-
•
Under the assumptions of spherical symmetry and hydrostatic equilibrium, these density and the temperature profiles can then be used to derive the total mass profile. More detailed explanations of those different steps can be found in Pratt & Arnaud (2002, 2003, 2005) and Pointecouteau et al. (2004).
We have used our derived mass profiles to test different models for the dark matter distribution. We tested an isothermal sphere model, a MQGSL profile (Moore et al., 1999) and a NFW profile (Navarro et al., 1997). The NFW profile proved to be the best representation of our current data. We adopted this as the parametric description for our cluster mass profiles. In fitting the mass profiles, the free parameters were the mass at a given overdensity with respect to the critical density of the Universe, , and either the scale radius, , or the concentration parameter, . This approach allows us to work directly with the mass at a chosen overdensity. Each pair of parameters led to identical results.
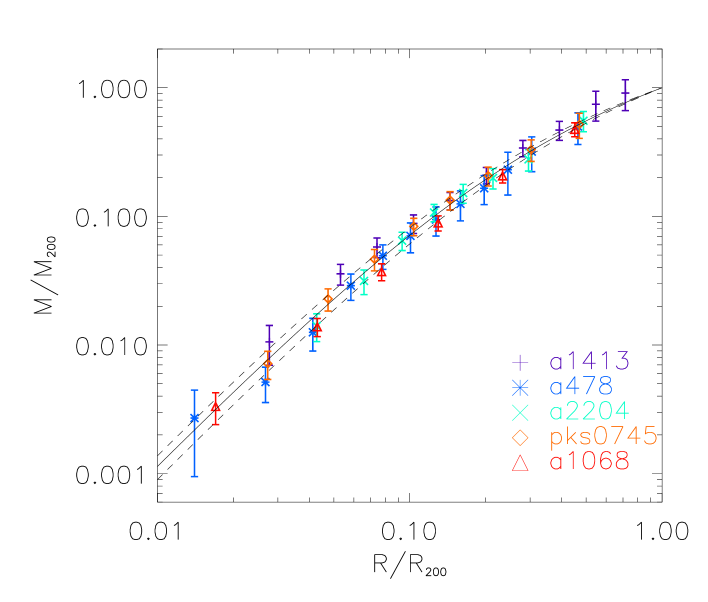
We then scaled each total mass profile according to the cluster virial radius (defined as the radius where the density is equal to 200 times the critical density of the Universe at the cluster redshift, ) and the virial mass (the mass at this radius, ). Our small sample includes the following clusters: A478, PKS0745, A1068 , A1413 and A2204. The results on A1413 and A478 have been respectively published by Pratt & Arnaud (2002) and Pointecouteau et al. (2004). PKS0745 was originally analyzed by Chen et al. (2003), but we reprocessed the whole data set checking that our result are consistent with the previously published ones. Nothing on A1068 and A2204 has yet been published. The details on clusters are gathered in Table 1). The five scaled mass profiles are plotted together in Fig. 2. The five profiles scale very well over a large range of radii from about 0.01 to 0.7 the virial radius, exhibiting a strongly similar shape as expected for an underlying universal matter profile in clusters.
| Name | Rev. | model | ||
|---|---|---|---|---|
| A478 | 0.088 | 401,411 | 48/41/37 | BBB |
| PKS0745 | 0.103 | 164 | 10/10/– | KBB |
| A1068 | 0.137 | 633 | 19/20/15 | BBB |
| A1413 | 0.143 | 182 | 24/25/10 | KBB |
| A2204 | 0.152 | 322 | 20/20/13 | KBB |
Columns: (1) Name. (2) redshift. (3) XMM-Newton revolution. (4) Effective exposure time for EMOS1/EMOS2/EPN. (4) Parametric model used for the density profile modelisation.
3 The relation as seen by XMM-Newton
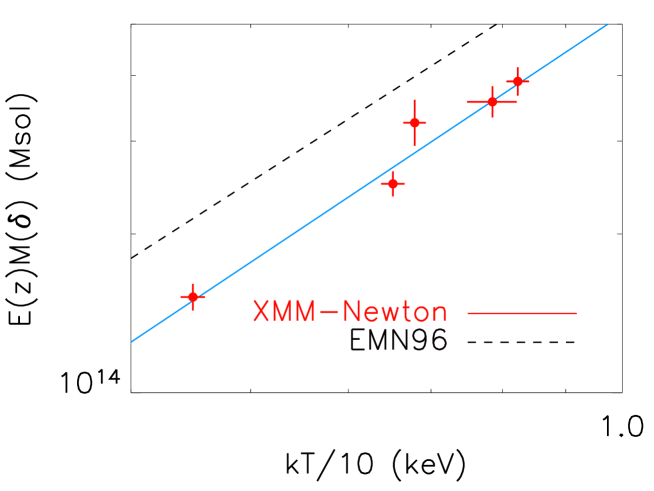
In order to further check the properties of cluster similarity with our sample, we have investigated the mass to temperature () relation. For easy comparison with previous work, we focus on an overdensity of with respect to the critical density of the Universe. The “virial” temperatures used to determine the relation were obtained from direct spectroscopic fits over a region from , chosen to avoid the cooling cores found in many of these clusters. We then performed a linear regression fit in the plane, taking into account both the errors in and . With only five XMM-Newton clusters we are able to derive the following relation: M⊙ (see Fig. 2). This result is compatible in terms of slope with the slope of 1.5 predicted by numerical simulations relying on gravitation-based scenarios of structure formation (Evrard, et al., 1996). However, the normalization of the observed relation is lower by a factor of about 30%, a problem encountered in several previous works (Nevalainen et al., 2000; Finoguenov et al., 2001; Allen et al., 2001; Sanderson et al., 2003). We then added the published Chandra data on four rich ( keV) clusters not already in our sample (A2390, A1835, RXJ1347-1145, MS2137-2353; Allen et al. 2001) and re-derived the relation, finding M⊙. The fit is almost unchanged, perhaps due to the larger uncertainties of the Chandra measurements with respect to the very precise XMM-Newton measurements.
Thus at , our derived relation is compatible in terms of slope with the prediction from scenarios of structure formation based on gravitation alone.
4 Conclusion
With this work we have used XMM-Newton’s excellent imaging and spectroscopic capabilities to observe clusters of galaxies up to about half of the virial radius (). In this study we were able to:
-
1.
probe the universality of the dark matter distribution in a sample of 5 rich, nearby galaxy clusters from 0.01 to 0.7 times the virial radius. The five scaled mass profiles present a very similar shape which is fairly well described by an NFW density distribution.
-
2.
investigate the relation at the overdensity of 2500 times the critical density of the Universe over a range of temperature going from about 4 keV to 9 keV. The derived relation has a slope compatible with the expected slope of 1.5 from the numerical simulations based on gravitational heating. The precision of the XMM-Newton measurements allows us to put tight constraints on the slope with only 5 clusters. Still our observed normalization for this relation is lower by a factor of about 30% compared to theoretical predictions.
Since the mass is not measured directly, but is derived from the density and the temperature profiles, a key issue for this kind of work lies in the accuracy of the determination of the true (meaning deprojected and PSF corrected) temperature and surface brightness profiles. The shape of Chandra temperature profiles (Vikhlinin, this meeting) and the XMM-Newton profiles we derived from our observations have therefore to be cross-compared. This is essential to assess the reliability of temperature profiles in mass profile determination and in the calibration of scaling laws. In a forthcoming paper, we extend our sample coverage to lower temperature (Pointecouteau, Arnaud & Pratt, in preparation). There we will investigate in greater detail the properties of the scaled profiles, the slope and normalization of the relation, and compare our results to recent numerical simulations involving non-gravitational processes.
The quality of current X-ray data makes it possible to calibrate the scaling laws in the local universe (the highest redshift cluster of our sample is A2204 with ) with a high precision which is fundamental for: (i) further studies concerning the evolution of scaling laws, and therefore for the studies of structure formation and evolution; (ii) surveys at different wavelengths like blind SZ surveys, which will make use of calibrated X-ray scaling laws as a bridge to calibrate SZ scaling laws such as the relation (roughly the SZ flux to total mass relation), needed for cosmological studies based on SZ statistics.
Indeed for such kind of studies, biases and/or systematic errors could be induced by the thermodynamical state of the clusters, or by some hypothesis or processes in the data analysis. Such kind of biases and systematics have to be carefully investigated and quantified to assess the calibration of scaling laws, and to make their use reliable on large cluster samples for cosmological studies and structure formation studies.
References
- Allen et al. (2001) Allen, S. W., Schmidt, R. W., & Fabian, A. C. The X-ray virial relations for relaxed lensing clusters observed with Chandra. MNRAS, 328, L37-L41, 2001.
- Arnaud et al. (2004) Arnaud, M., Pratt, G. W., & Pointecouteau, E. Structural and scaling properties of galaxy clusters: probing the physics of structure formation. Memorie della Societa Astronomica Italiana, 75, 529-537, 2004.
- Chen et al. (2003) Chen, Y., Ikebe, Y., Böhringer, H. X-ray spectroscopy of the cluster of galaxies PKS 0745-191 with XMM-Newton. A&A, 407, 41-50, 2003.
- Evrard, et al. (1996) Evrard, A. E., Metzler, C. A., & Navarro, J. F. Mass Estimates of X-Ray Clusters. ApJ, 469, 494-507, 1996.
- Finoguenov et al. (2001) Finoguenov, A., Reiprich, T. H., & Böhringer, H. Details of the mass-temperature relation for clusters of galaxies. A&A, 368, 749-759, 2001.
- Moore et al. (1999) Moore, B., Quinn, T., Governato, F., Stadel, J., & Lake, G. Cold collapse and the core catastrophe. MNRAS, 310, 1147-1152, 1999.
- Navarro et al. (1997) Navarro, J. F., Frenk, C. S., & White, S. D. M. A Universal Density Profile from Hierarchical Clustering. ApJ, 490, 493-508., 1997
- Nevalainen et al. (2000) Nevalainen, J., Markevitch, M., & Forman, W. The Cluster M-T Relation from Temperature Profiles Observed with ASCA and ROSAT. ApJ, 532, 694-699, 2000.
- Pointecouteau et al. (2004) Pointecouteau, E., Arnaud, M., Kaastra, J., de Plaa, J. XMM-Newton observation of the relaxed cluster A478: Gas and dark matter distribution from 0.01R200 to 0.5R200. A&A, 423, 33-47, 2004.
- Pratt & Arnaud (2002) Pratt, G. W. & Arnaud, M. The mass profile of A1413 observed with XMM-Newton: Implications for the M-T relation. A&A, 394, 375-393, 2002.
- Pratt & Arnaud (2003) Pratt, G. W. & Arnaud, M. Entropy scaling in galaxy clusters: Insights from an XMM-Newton observation of the poor cluster A1983. A&A, 408, 1-16, 2003.
- Pratt & Arnaud (2005) Pratt, G. W. & Arnaud, M. XMM-Newton observations of three poor clusters: Similarity in dark matter and entropy profiles down to low mass. A&A, 429, 791-806, 2005.
- Sanderson et al. (2003) Sanderson, A. J. R., et al. The Birmingham-CfA cluster scaling project - I. Gas fraction and the M-TX relation. MNRAS, 340, 989-1010, 2003.