2Astronomical Institute, Utrecht University, Princetonplein 5, NL-3584 CC Utrecht, The Netherlands
3 Department of Physics and Astronomy, Johns Hopkins University, 3400 North Charles Street, Baltimore, MD 21218, USA
4 Gemini Observatory, c/o AURA, Casilla 603, La Serena Chile
5 Universidad de La Laguna, Av. Astrofisico Francisco Sanchez sn, 38206, La Laguna, Tenerife, Spain
The Star Cluster Population in the Tidal Tails of NGC 6872 ††thanks: Based on Observations at the Very Large Telescope of the European Southern Observatory, Paranal/Chile under Program 71.B-0596. Table 2, containing the photometry, positions, and derived properties of each source is available in electronic form ec at the CDS via anonymous ftp to cdsarc.u-strasbg.fr (130.79.128.5) or via http://cdsweb.u-strasbg.fr/cgi-bin/qcat?J/A+A/
We present a photometric analysis of the rich star cluster population in the tidal tails of NGC 6872. We find star clusters with ages between 1 - 100 Myr distributed in the tidal tails, while the tails themselves have an age of less than 150 Myr. Most of the young massive () clusters are found in the outer regions of the galactic disk or the tidal tails. The mass distribution of the cluster population can be well described by a power-law of the form , where , in very good agreement with other young cluster populations found in a variety of different environments. We estimate the star formation rate for three separate regions of the galaxy, and find that the eastern tail is forming stars at times the rate of the western tail and times the rate of the main body of the galaxy. By comparing our observations with published N-body models of the fate of material in tidal tails in a galaxy cluster potential, we see that many of these young clusters will be lost into the intergalactic medium. We speculate that this mechanism may also be at work in larger galaxy clusters such as Fornax, and suggest that the so-called ultra-compact dwarf galaxies could be the most massive star clusters that have formed in the tidal tails of an ancient galactic merger.
Key Words.:
galaxies: star clusters – galaxies: interactions – galaxy: individual: NGC 68721 Introduction
An increasing number of studies are showing the great variety and abundance of environments that are conducive to the formation of young massive stellar clusters (YMCs). From the centers of merging galaxies (e.g. Miller et al. 1997; Whitmore et al. 1999) to nuclear starburst rings (Maoz et al. 2001) and even in normal spiral galaxies (Larsen & Richtler 2000). In addition, recent studies have shown that YMCs can form outside the main body of a galaxy, in tidal tails (Tran et al. 2001, Knierman et al. 2003) and between galaxies in compact groups (Gallagher et al. 2001). Indeed, it appears that wherever the local star-formation rate is high enough, YMCs are certain to be present.
The goal of this study is to determine the properties of the rich star cluster population in the tidal tails of the NGC 6872. By studying the age distribution of the clusters with respect to the spatial distribution, we can gain insight into the cluster formation process on large (galaxy) scales. Additionally, we shall compare the derived parameters of the population as a whole with that of more typical cluster populations in order to search for differences related to environmental influence.
Recently, Knierman et al. (2003) have surveyed the tidal tails of four mergers of spiral galaxies. They found that only one of the six tails studied (the west tail of NGC 3256) showed a large number of star clusters, while three others showed evidence of a small number of clusters. The authors suggest that the presence of tidal dwarf galaxies may hamper the formation of YMCs in the rest of the tidal tail. In this sense, NGC 6872 is akin to NGC 3256, as it lacks a clear tidal dwarf galaxy in each of its tails.
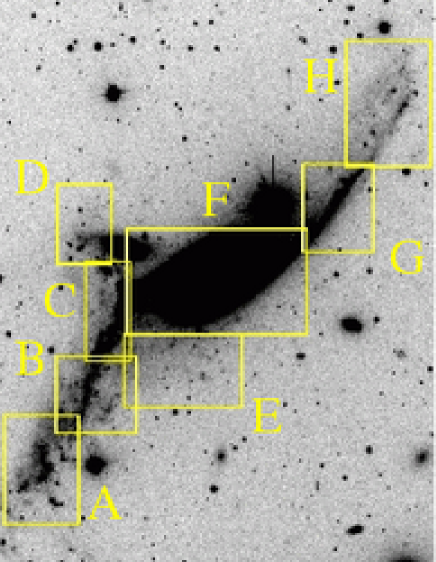
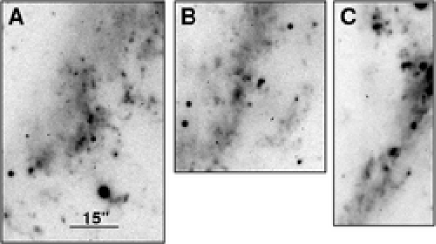
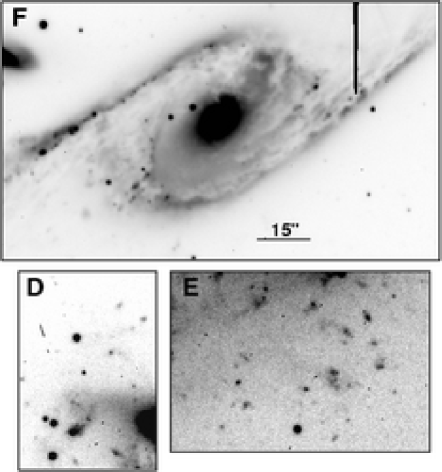
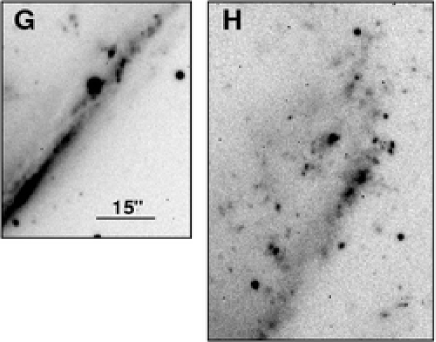
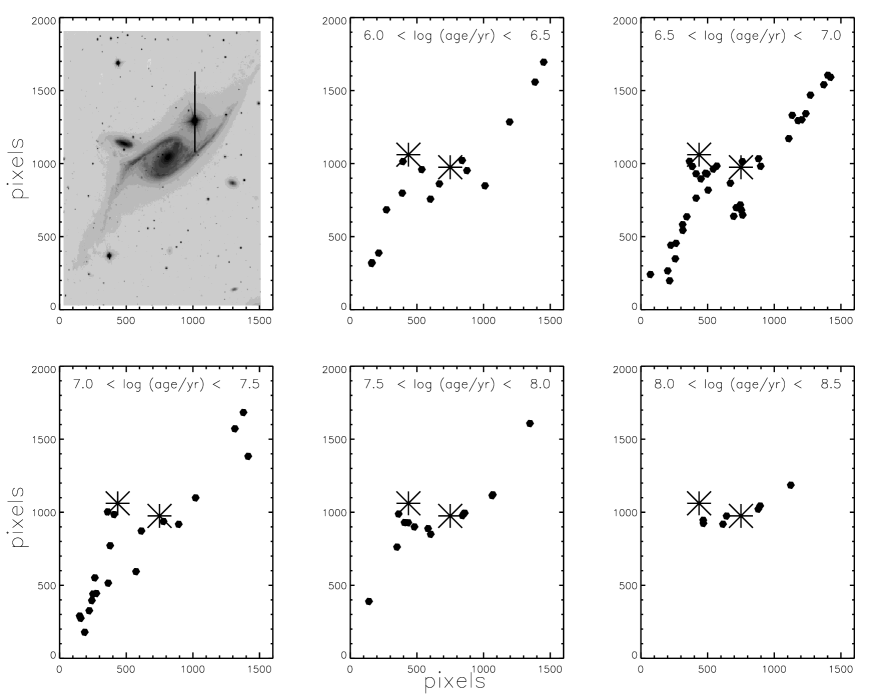
NGC 6872 is a barred spiral galaxy that is interacting with IC 4970, a smaller S0 galaxy (de Vaucouleurs et al. 1991), which is the elliptical structure in the center left of Fig. 1. In Figure 1 an optical (B-band) image of NGC 6872 is shown, and each of the regions labeled and shown in more detail in the subsequent figures (Figs. 2, 3, & 4). Note that all panels are based on the same scaling (see panel A, F, and G).
The NGC 6872/IC 4970 interaction has been modeled by Mihos et al. (1993) and Horellou & Koribalski (2003) who both find a mass ratio between NGC 6872 and IC 4970 of 5:1, and a time since periapse of Myr, i.e. the event that triggered the formation of the tails. Two long, thin tidal tails extend from the disk of NGC 6872, the optical component of which terminates some 60 kpc from the galactic center. NGC 6872 has a rich star cluster population in its tidal tails, first noted by Horellou & Koribalski (2003). The combination of new U-band imaging, archival B, V, and I imaging, and Fabry-Perot data taken from the literature allow an analysis of the cluster population as a whole including their formation history and spatial position within the tails. This in turn will provide insight into the formation and evolution of star clusters in the special circumstance of galaxy interactions.
This study is set up in the following way. In § 2 we present the observations and the methods of reduction and photometry employed. In § 3 we study the colour distribution of the cluster population and infer each cluster’s age and mass. The youngest clusters are discussed in § 4 which is followed by an estimation of the star formation rate in the individual regions of the galaxy in § 5. Our observational results are combined with models of galaxy interactions from the literature in order to explore the formation and future evolution of the cluster population in § 6, and in § 7 we summarize our results.
The heliocentric redshift of NGC 6872 is 4701 km/s (de Vaucouleurs et al. 1991), which, assuming = 72 , corresponds to a distance of Mpc and a distance modulus of 33.9 mag.
2 Observations, reduction and photometry
To derive the ages and masses of extragalactic YMC using photometry, multi-band observations spanning a wide range in wavelength are required (e.g. de Grijs et al. 2003a). To this end, we retrieved images taken with VLT-FORS1 of NGC 6872 in the B, V, and I bands from the ESO/VLT archive. The B band image was a single exposure of 600s, while the V and I band images consisted of two exposures each of 150s and 200s respectively. Additionally, Fabry-Perot observations of NGC 6872 were kindly provided by C.J. Mihos and used to corroborate our results (see Mihos et al. 1993 for a description of the observations).
As shown by Anders et al. (2004) U-band observations are essential for photometric investigations of young star clusters. We have therefore complemented the existing archival data with VLT-FORS1 U-band observations, taken on May 6th, 2004. Three U band images of 300s each were taken. All images were flat-fielded and the bias subtracted in the standard way.
Sources were identified using the DAOFIND routine in IRAF. Aperture photometry was performed with an aperture, inner background radius, and outer background radius of 5/7/9 pixels (1 pixel). Aperture corrections to a 50 pixel (10′′) radius were calculated using bright isolated sources. The applied corrections were , , , mag for the U, B, V, and, I respectively. The large difference between the aperture correction for the U band relative to the other bands was due to the differences in seeing. The seeing during the B, V, and I observations was arc seconds, while for the U band observations it was arc seconds. Photometric zero points were determined using Landolt (1992) standard fields.
Completeness limits were determined by adding artificial sources with magnitudes between 21 and 26 mag, using the IRAF task ADDSTAR. The sources and their magnitudes were found following the procedure described above. The 90% completeness limits are 23.75, 24.0, 23.5, and 22.75 for the U, B, V, and I bands respectively. We do not expect our sample to be contaminated by individual luminous stars in NGC 6872, as our completeness limit corresponds to MV = -10.4 (at the distance of NGC 6872) which is almost a magnitude and a half brighter than the cluster selection limit used by Whitmore et al. (1999). Foreground stars, however, may contaminate our sample, and will need to be accounted for.
We have corrected all observed sources for Galactic extinction (, Schlegel, Finkbeiner, & Davis 1998).
3 The cluster population
3.1 Colours
Figure 5 shows the colour-colour ( vs ) diagram for point-like sources in both tidal tails as well as in the central region of NGC 6872. The solid and dashed lines are the SSP model tracks (Bruzual & Charlot 1993 - 2000 version) for and respectively, and salpeter IMF. For comparison we also constructed the colour-colour diagram for the background sample (sources outside the labeled areas in Fig. 1), which is shown in the middle panel of Fig. 5. Presumably the sources in the background field are foreground stars and background galaxies. This is shown in the middle panel of Fig. 5 by also showing the stellar model tracks (Z = 0.008, , 100 Myr - Lejune & Schaerer 2001). Most of the bright sources follow the stellar tracks quite nicely (the small offset to the blue is caused by the correction for Galactic extinction).
We then removed the contamination from our sample by subtracting the ’background’ field from the ’galaxy’ field (normalizing to equal areas). This was done statistically by dividing the colour-colour plane for both the background and galaxy fields, into square regions ( & ), and then summing the number of sources within each colour box. The resulting background grid was then subtracted from the galaxy grid, and the result is shown as a contour plot in the bottom of Fig. 5.
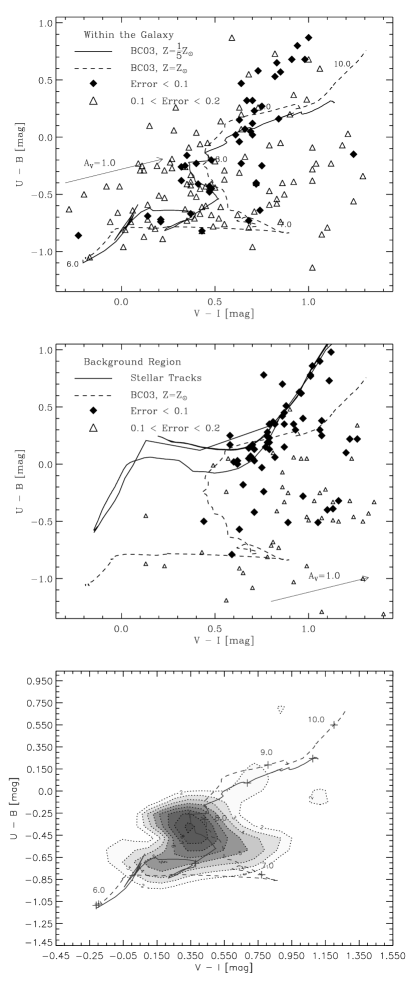
There is a clear over-density of very blue objects, with colours consistent with ages between 1 - 100 Myr, peaked at a few Myr (following the extinction vector), as shown by the contour plot (bottom panel in Fig. 5). The tails have ages of Myr (Mihos et al. 1993), and many of the very young clusters are found at a large distance from the main body of the galaxy. Hence these structures must have formed within the tail, and were not formed inside the main body of the galaxy and ejected into the tail.
3.2 Ages
In order to more quantitatively investigate the properties of these clusters, we attempt to derive the age, mass, and extinction of each cluster. To do this we employ the three dimensional spectral energy fitting algorithm (3DEF method) first proposed by Bik et al. (2003). A detailed description of the method is given there, and as such we shall only provide a brief summary here. The 3DEF method compares each cluster’s observed spectral energy distribution (SED) to that of a grid of simple stellar population (SSP) models of ages between 1 Myr and 11 Gyr, and extinctions ranging from in equal steps of 0.02. We adopt the models of Bruzual & Charlot (1993 - 2000 version) with a metallicity of . The metallicity was chosen to most nearly match the observed metallicity of tidal dwarf galaxies ( - Duc & Mirabel 1998), which are objects which also form in the tidal debris of merging galaxies. For a detailed description of the effects of an apriori metallicity assumption, see Anders et al. (2004). Here we note that if solar metallicity is used the derived ages become less, on average, and therefore so do the determined masses. We will discuss how our assumed metallicity affects our results where applicable.
Applying this technique to the clusters in NGC 6872, we derive ages between a few Myr to a few hundred Myr. No clusters older than 145 Myr (the age of the interaction) are found inside the tidal tails. Figure 6 shows the derived ages (divided into five age bins) as a function of position in the galaxy. From this we conclude that the youngest clusters are spread throughout the tidal tails, while the older clusters are concentrated towards the main body of the galaxy. Some caution must be taken in the interpretation of this figure (also Figs. 7 & 8) as foreground stars and background galaxies may be contaminating the sample. We have attempted to eliminate contaminating sources by applying a reduced criterion to the fits (Bik et al. 2003). For this we adopted the value from Bik et al. (2003) of a maximum of 3 between the observed cluster spectral energy distribution and that of the best fitting model. Adopting solar metallicity for the SSP model does not change the general properties of the spatial distribution, except for a larger number of sources with ages between 30 Myr and 100 Myr in the tidal tails.
From Fig. 6 we note that clusters with ages less than Myr (log (age/yr) = ) are spread throughout the galaxy, including the tidal tails. Clusters older than this are concentrated towards the center of the galaxy. This can be interpreted as a delay between the merger event which caused the tidal tails, and cluster formation inside the tidal tails.
Additionally, the 3DEF method solves for the extinction for each cluster simultaneously with the age. Most of the clusters in this study were fit with low extinction values ( - after correction for foreground extinction). Figure 7 shows the position in the galaxy for five different extinction bins. We do not find any strong correlation between position and extinction. In particular no increase is found in the average extinction along the tidal tails from HI gas poor to gas rich regions. However, the two groups of star clusters far into the tidal tails in the bin seem to be associated with peaks in the HI intensity map of Horellou & Koribalski (2003).

3.3 Masses
At a distance of Mpc, one FORS1 pixel corresponds to 63 pc, which leaves room to discuss to which degree our cluster detections might not refer to single clusters but to multiple, unresolved clusters. Given that young clusters seem to be themselves clustered (e.g. Larsen 2004) it is likely that some of our sources are made up of multiple clusters. This may cause us to over-estimate the mass of the observed clusters, as the mass that we measure is in fact the total mass of multiple clusters. Therefore our mass estimates for some sources represent the total mass of a complex of clusters, which, given the scale of the resolution ( pc), implies that these clusters formed within the same star forming complex. High resolution imaging is required to estimate to what degree our mass estimates are affected by this effect. Note, however, that this effect will have a negligible influence on our age and extinction results.
Figure 8 shows the position of the sources inside the galaxy and tails in five different mass bins. As in Fig. 6 we have attempted to remove foreground stellar contamination by applying a criterion. There are clusters with masses up to forming in the tails, and clusters with even larger masses forming inside the main galaxies and region between the two interacting galaxies. The assumption of solar metallicity for the template SSP models does not change the qualitative description of the spatial positions of the clusters for different mass ranges given above.
Although we are limited to rather low spatial resolution and are potentially biased towards identifying multiple, closely spaced clusters as a single massive clusters (see above), we move forward, and construct a mass distribution for the clusters in our sample. The mass of each cluster can be estimated by combining the derived age and extinction of each cluster, the measured brightness, the known distance modulus, and the predicted mass-to-light ratios of SSP models. Figure 9 shows the derived mass distribution for the young clusters ( Myr) in our sample. The assumed metallicity has almost no influence on the mass distribution. The dashed vertical line in the figure is the detection limit of our sample assuming an age of 10 Myr and no extinction. Presumably the mass function extends to much lower masses, and the observed turnover is simply caused by the detection limit. There is, however, a significant number of high mass () clusters. The shaded histogram is the mass distribution of the young clusters which were selected based on their H flux. This subsample will be discussed in more detail in § 4.

3.3.1 Cluster initial mass function
The mass function of young star cluster populations in many diverse environments can be well fit with a power-law of the form , where (data taken from Table 2 of de Grijs et al. 2003b111Note that the exponents of mass functions and luminosity functions have been combined here. If the cluster population is close to a single aged population then is the same for the mass and luminosity functions. For a detailed analysis of the luminosity function of young cluster systems see Gieles et al. (2005).). The error of 0.26 is calculated as the standard deviation from the mean. It is curious that this relation holds across many orders of magnitude and many different environments, such as the centers of galaxy mergers with strong starbursts or quiescent disk galaxies. This hints at a uniformity in the cluster formation process, independent of environment.
As tidal tails in galaxy mergers are an unexplored environment for this characteristic we derive the mass function for the detected clusters in our sample. We assume a fit of the form above, with as the free parameter. The results of this procedure are shown in Fig. 9. We find that , which is somewhat shallow for a young cluster population, but still within the standard deviation given above. The shallowness of the slope may be caused by crowding problems, as we may mistake a tight collection of clusters as a single cluster, hence overestimating the number of bright clusters and underestimating the number of faint clusters. Thus, we would expect that the cluster luminosity function would become somewhat steeper with higher resolution images. Even with this caveat it is clear that the population within NGC 6872 is very similar to other young cluster populations in terms of its mass function (see also review by Whitmore 2002).
4 The Youngest Clusters
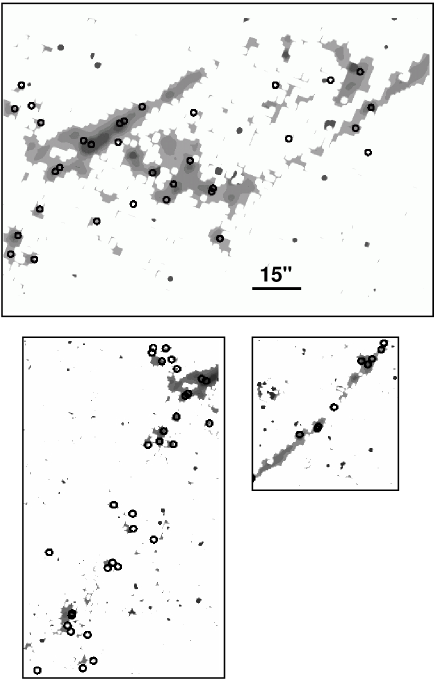
In order to test the reliability of our age estimates, we have compared the spatial distribution of the youngest ( Myr) clusters with the H emission Fabry-Perot intensity map of Mihos et al. (1993), which traces the massive stars in the galaxy. As shown in Fig. 10, the intensity (dark indicating the strongest emission), and the positions of the young ( Myr) massive () clusters, coincide. At almost every maxima of the intensity we find a young massive cluster. Strong H emission is evidence of a very young ( Myr) population of massive stars (e.g. Whitmore & Zhang 2002). Our results, based on colour fitting, are consistent with the emission.
In practice, the construction of a mass distribution of a population of clusters of many ages is difficult, as over-estimating the age of a cluster will also cause a significant over-estimate of the mass. This is especially the case for clusters with ages Myr, where the mass to light ratio of SSP models increases rapidly. In principle, if the cluster formation rate is high enough, one can construct a mass distribution of clusters whose ages are extremely young, which minimizes the chance of over-estimating their masses. We have carried out such an analysis with the sample generated above, i.e. those clusters which are spatially coincident with a peak in the H intensity and pass our criterion. The resulting mass distribution is shown as the shaded histogram in Fig. 9. We note that this distribution resembles that of the entire population, in particular all of the most massive young clusters are detected in H. The deviation below is presumably due to the fainter detection limit in H than in the broad band filters.

5 Specific U-band Luminosity
A useful tool to study populations of young clusters and their environments is the specific U-band luminosity, first proposed by Larsen & Richtler (2000). It is defined as
| (1) |
where is the total amount of light coming from clusters in the U-band, and is the total U-band light of the galaxy, or of a specific region. has been found to correlate with the area-normalized star formation rate, , and to be more or less insensitive to the low-luminosity tail of the young cluster luminosity function (Larsen & Richtler 2000).
Although the relation was defined for an entire cluster system with respect to the integrated luminosity of the host galaxy, the concept has been applied to individual cluster complexes within a galaxy (Larsen et al. 2002). In the present case we have sub-divided the galaxy into three distinct regions, the east tail (roughly regions A, B, and C in Fig. 1), the center (the central part of region F), and the west tail (the west part of region F and regions G and H). We then calculated the total U-band luminosity of each region, , as well as that for all point-like sources with . The colour cut is an attempt to homogenize our results with respect to Larsen & Richtler (2000) who use the same cut in order to eliminate foreground stars.
For the Larsen & Richtler (2000) relation between and the area normalized star formation rate, we used a fit through the data of Fig. 8 in Larsen (2000), namely
Inserting the derived values of into the Larsen & Richtler (2000) relation allows us to infer the star formation rates for the different regions of the galaxy.
While the Larsen & Richtler (2000) relation seems to hold for normal galaxies and for galaxies with high star formation rates, there is considerable scatter in the trend. Thus, while the absolute star formation rates estimated in this way are uncertain, the comparison of the SFR for different regions still allows a relative interpretation. Table 1 gives the resultant SFR for each region. We see that the star formation rate in the eastern tail is over twice that of the western tail and more than five times that of the central region of the galaxy. We note that the star formation rate in the central region of the galaxy is consistent with that of Mihos et al. (1993), who estimated the SFR using far infrared colours.
The eastern tail of NGC 6872 seems to dominate the star formation for the entire galaxy, while the central region has a rather low SFR. Mihos et al. (1993) speculate that the reason for this low SFR is a lack of gas in the central part of the galaxy. If most of the gas was located in the outskirts of the galaxy at the time of the interaction most of it would be lost into the tails. This scenario is consistent with the results of Reif et al. (1982) who did not detect HI in NGC 6872, as well as with the observations by Horellou & Koribalski (2003) which show large amounts of HI inside the tidal tails. As can be seen in Figures 6 & 10, the majority of the young star clusters are found in the tidal tails or the outer regions of the disk, consistent with the scenario above.
| Region | Area () | SFR () | ||
|---|---|---|---|---|
| East Tail | 6.6 (1.42) | 2.7 (0.5) | 605 | 16.5 (3.3) |
| West Tail | 4.8 (1.0) | 2.1 (0.4) | 375 | 7.6 (1.4) |
| Center | 2.3 (0.5) | 1.1 (0.2) | 291 | 3.1 (0.5) |
6 A Scenario for the Formation and Evolution of Star Clusters in Tidal Tails
6.1 Cluster formation
The age distribution as a function of position in the galaxy, as seen in Fig. 6, can be compared with models of structure formation in the tidal tails, in order to explore the formation history and triggers of star formation in the galaxy and tidal tails.
Mihos et al. (1993) have modeled the NGC 6872 interaction in detail, including a threshold for star formation. The authors argue that the coincidence of strong gas compressions with regions of high star formation rates, is evidence that collisionally induced star formation is the dominant mode of star formation. Our result that many of the YMCs are forming within the regions of strong gas compression and high star formation rate (see Fig. 10) agrees with the Mihos et al. (1993) scenario. Additionally, in both tails we observe a sudden drop in intensity and density of young clusters directly outside the regions with high star formation rate along the tails. After this decrease, we find sporadic single peaks in the intensity, coincident with young clusters. To explain this, we combine the results from the models of Mihos et al. (1993) with those of structure formation in the tails (e.g. Barnes & Hernquist 1992; Elmegreen et al. 1993).
By combining these models with our observations, we advance the following scenario. As the gas gets expelled into the tails, it collides with other gas clouds, causing an initial burst of collisionally induced star formation (Mihos et al. 1993). Following this initial burst of star/cluster formation the gas is allowed to cool, as it expands further into the tail. This explains the sudden drop in intensity along the tails after the large peak, at the base of the tail (i.e. the part of the tail closest to the galaxy). Due to cooling, the gas it will begin to form denser clouds and fragment, resembling those found in simulations of the formation of tidal tails (e.g. Barnes & Hernquist 1992 & Elmegreen et al. 1993). This collapse of clouds and structure in the tidal tails by self-gravity was also suggested by Hibbard & van Gorkom (1996) to explain regions of reduced surface brightness in tidal tails. These clouds, in turn, will be the sites of individual regions of cluster formation. Spatial peaks of cluster formation, separated by large gaps, have also been seen in the tidal tails of the “Tadpole” galaxy (UGC 10214 - Tran et al. 2003).
If this scenario is correct, we may expect older disk stars, that have been ejected into the tail, to act as seeds for the gravitational collapse of clouds (Barnes & Hernquist 1992). In this way, the structures formed are expected to be made up of an older disk population and a younger burst population that forms from the condensing gas. Evidence for this scenario has been given by Weilbacher et al. (2000, 2004), who find that the colours of Tidal Dwarf Galaxy candidates can be well fit by population synthesis models which contain both populations. As the Tidal Dwarf Galaxy candidates also presumably form in the tidal tails (Duc & Mirabel 1998, Weilbacher et al. 2000), it is tempting to consider a common formation mechanism, although this is not necessarily the case. Optical and near-infrared spectroscopy/photometry will be necessary to determine if there is a significant underlying old stellar population within the young clusters presented here (e.g. Weilbacher et al. 2004).
6.2 Fate of the Tidal Material
N-body simulations of galaxy interactions and the subsequent formation of tidal tails show that the majority of the material thrown into the tail will fall back onto the host galaxy within a few 100 Myr (Hibbard & Mihos 1995). This material though, is dissipative gas, while any non-dissipative structures (e.g. stars and clusters) will become ballistic, and in an isolated environment will orbit between the outer and inner turning points indefinitely (Hibbard & Mihos 1995). The orbits of this material may reach distances of several hundred kiloparsecs with periods of a few Gyr. Based on this, we expect much of the gas seen in the tails of NGC 6872 to fall back onto the main body of the galaxy, while the YMCs will continue to orbit far outside the galaxy.
The above mentioned simulations were carried out assuming that the galaxy interaction/merger took place in an isolated environment. NGC 6872 is, however, a member of the Pavo group, and as such, the tidal material will experience the potential of the group. As such, a set of more realistic simulations may be that of Mihos (2004a,b). In these N-body simulations, the author places the galaxy merger (and hence the tidal tails) in the potential of a rich, Coma-like cluster. The authors find that of the material thrown into the tidal tails is stripped from the host galaxy by the cluster potential, into the intra-cluster medium. The cluster potential of the simulated Coma-like cluster () over-estimates the potential of the much smaller Pavo group by about a factor of 50 to 100222The mass of the Pavo group was estimated using its measured temperature of 0.82 keV (Davis, Mulchaey, & Mushotzky 1999), which is typical of poor galaxy clusters with masses of a few times (Mulchaey et al. 1996).. Although the Pavo group is relatively small compared with the simulated Coma-like cluster, the same mechanism is likely to be at work. Due to the lower velocities in small galaxy groups, relative to galaxy clusters, the group potential may in fact be more efficient in stripping the tidal debris away from the host galaxy. In either case, we can expect many of the star clusters reported here to contribute to the intergalactic environment of the group.
As shown in Maraston et al. (2004), massive young star clusters have parameters (such as size, mass, and values) that resemble those of the so-called Ultra-Compact Dwarf Galaxies (UCDs) discovered in the Fornax cluster (Hilker et al. 1999; Drinkwater et al. 2000) and Abel 1689 (Mieske et al. 2004 - though for a discussion on the relevance of the name see Kissler-Patig 2004). Despite this similarity, the prevailing interpretation of the UCDs is that they are the nuclei of nucleated dwarf galaxies which have had the rest of the galaxy stripped off due to tidal interactions within the galaxy cluster, the ’threshing scenario’ (Bekki et al. 2003). On the other hand, it may be possible that the UCDs are star clusters which have been formed in the tidal tails of a galaxy merger/interaction. Due to the influence of the galaxy cluster potential (see above) many of the star clusters formed in this way would be expected to be stripped from the host galaxy, and contribute to a intra-galaxy cluster population of star clusters. These clusters would then follow the velocity/spatial distribution of dwarf galaxies, rather than that of the globular cluster system of the host galaxy. Thus, the observed velocity and spatial distribution of the UCDs in Fornax (Drinkwater et al. 2000) does not rule out the possibility of them being star clusters.
Although NGC 6872 is not currently forming any star clusters with masses comparable to that of the observed UCDs, larger mergers of gas-rich galaxies may be able to do so (e.g. NGC 7252, Maraston et al. 2004). This is due to the relation between the strength of the interaction/merger and the mass of structures that form in the tidal tails, with stronger encounters producing larger structures (Elmegreen et al. 1993).
7 Conclusions
We have investigated the star cluster population in the tidal tails and main body of NGC 6872 with , , , and observations, along with Fabry-Perot observations taken from the literature (Mihos et al. 1993). By the use of colour-colour diagrams and the 3DEF method we have derived the age distribution of the population along with the corresponding mass distribution. We find a rich population of young ( 10 Myr) massive clusters inside the tidal tails, which when compared with the dynamical timescale of the tidal tails themselves ( Myr) show that the clusters have formed in the tidal debris.
We find young ( Myr) and intermediate ( Myr) clusters spread throughout the tidal tails and main body of the NGC 6872. Clusters older than this are concentrated towards the main body of the galaxy. We interpret this as the cluster formation in the tidal tails being delayed by 50–100 Myr with respect to the event that triggered the formation of the tidal tails themselves. This will be the case if a significant time delay is required for clouds to contract under self-gravity in the expanding tidal tails. Additionally we do not find any strong correlation between the extinction of the clusters and the HI column density. Young massive () clusters are found throughout the tidal tails and in the region between the two galaxies. We find clusters with masses up to forming due to the interaction between NGC 6872 and IC 4970. We may expect even more massive clusters to form from stronger (e.g. equal mass) encounters/mergers (Elmegreen et al. 1993).
The mass function of the population is very similar to that of other young populations in various environments (e.g. galaxy mergers, nuclear starbursts, normal spirals), being well fit by a power-law of the form where . Due to the intrinsic low spatial resolution of ground based images, we may have slightly underestimated by mistaking a group of young clusters as one single cluster. Thus, we expect that would be somewhat larger on higher resolution images.
Using the specific U-band luminosity of the tidal tails and the main body of NGC 6872, and combining this result with the empirical vs. relationship (Larsen & Richter 2000), we have estimated the star formation rate for each area. While the actual numbers derived in this way are relatively uncertain, the relative star formation rates should hold. Using this method we find that the east tidal tail has the highest star formation rate () at present, with the west tail having about half of this value, and the star formation rate in the central region of the galaxy being about five times lower than the eastern tail.
By comparing the spatial position of the youngest clusters with observations of NGC 6872, we can get an independent constraint on the ages of the clusters and eliminate foreground stellar contamination. We find that the most massive () and youngest ( Myr) clusters coincide with peaks in the intensity supporting our age and the resulting mass estimates based on colours. The tidal tails show prominent large gaps in the intensity which coincide with large gaps in the cluster population. This is consistent with the scenario of Hibbard and van Gorkom (1996) who propose that clouds contract under self-gravity inside the tails, leaving areas of low surface brightness between the clouds. If we apply our analysis to only those clusters which coincide with peaks in the emission we find that these clusters account for all of the most massive young clusters in our sample. We find that there are many massive () clusters present in the tidal tails and the outer parts of the galactic disk.
Finally, we have qualitatively combined our observations with detailed models of structure formation in tidal tails as well as their evolution. These models conclude that a large fraction (%) of the material in the tidal tails, and a possibly larger fraction of the material in stars and star clusters, will be expelled into the intra-galaxy cluster environment. Although the Pavo group is a factor of 50–100 smaller than the simulated Coma-like cluster, the smaller velocities of the galaxies may make tidal stripping even more efficient. Since the same stripping mechanism is expected to be operating on both the galaxy cluster and galaxy group scales, NGC 6872 can be used as an interesting test case. We have shown that massive clusters can form in the tidal tails, far from the main body of the galaxy. This tidal debris will be stripped into the intra-cluster environment, and form a population of star clusters that follow the galaxy cluster potential in terms of velocities and spatial distribution. If the central cD galaxies of Fornax-like galaxy clusters were formed by the merging of galaxies which resulted in tidal tails, we expect a population of star clusters in the intra-cluster environment. The most massive clusters are expected to have similar properties to the observed ultra-compact dwarf galaxies found in Fornax and Abel 1689.
| id | x | y | Ua | dU | Ba | dB | Va | dV | Ia | dI | b | AVc | log (Age/yr)c | log Mass/M⊙c | MVd |
|---|---|---|---|---|---|---|---|---|---|---|---|---|---|---|---|
| 2 | 120.6 | 164.0 | 23.25 | 0.17 | 23.05 | 0.04 | 22.27 | 0.03 | 21.37 | 0.04 | 2.00 | 0.00 | 9.48 | 6.89 | -11.63 |
| 6 | 189.0 | 178.2 | 22.55 | 0.11 | 23.34 | 0.07 | 23.58 | 0.09 | 22.90 | 0.10 | 7.60 | 0.19 | 7.20 | 5.11 | -10.51 |
| 10 | 215.5 | 197.7 | 22.05 | 0.09 | 22.58 | 0.05 | 22.73 | 0.07 | 22.50 | 0.09 | 1.80 | 0.06 | 6.64 | 4.59 | -11.23 |
| 14 | 40.4 | 236.0 | 20.94 | 0.03 | 20.89 | 0.01 | 20.46 | 0.01 | 19.77 | 0.03 | 0.80 | 0.00 | 8.96 | 7.20 | -13.44 |
| 16 | 71.0 | 240.8 | 21.83 | 0.07 | 22.21 | 0.03 | 22.28 | 0.04 | 21.96 | 0.06 | 6.80 | 0.25 | 6.62 | 4.79 | -11.87 |
| 19 | 201.0 | 265.4 | 22.09 | 0.08 | 22.54 | 0.03 | 22.61 | 0.04 | 22.13 | 0.06 | 9.20 | 0.19 | 6.88 | 4.95 | -11.48 |
| 20 | 159.4 | 273.8 | 22.75 | 0.17 | 23.14 | 0.08 | 23.07 | 0.09 | 22.15 | 0.07 | 3.10 | 0.74 | 7.30 | 5.52 | -11.57 |
-
a
Magnitudes have only been corrected for foreground extinction.
-
b
The reduced value for the best fitting model.
-
c
Derived extinction, age, and mass using the 3DEF method. Sources with ages greater than 1 Gyr are most likely foreground stars.
-
d
Absolute magnitue of the source, correcting for the derived extinction.
Acknowledgements.
We thank Chris Mihos for providing his data in electronic form, as well as for many useful discussions. We also thank Søren Larsen for useful discussions concerning the specific U-band luminosity, and Henny Lamers for comments on the manuscript. Cees Bassa is gratefully acknowledged for providing the astrometry. Finally, we thank the VLT staff for their excellent help during the observations.References
- [1] Anders, P., Bissantz, N., Fritze-v. Alvensleben, U., de Grijs, R. 2004, MNRAS, 347, 196
- [2] Ashman, K.C., & Zepf, S.E. 1992, ApJ, 384, 50
- Barnes & Hernquist [1992] Barnes, J.E., & Hernquist, L. 1992, Nature, 360, 715
- [4] Bekki, K., Couch, W.J., Drinkwater, M.J., Shioya, Y. 2003, MNRAS, 344, 399
- Bik et al. [2003] Bik, A., Lamers, H.J.G.L.M., Bastian, N., Panagia, N., & Romaniello, M. 2003, A&A 397, 473
- [6] Bruzual, A.G., Charlot, S., 1993, ApJ, 405, 538
- [7] Davis, D.S., Mulchaey, J.S., Mushotzky, R.F. 1999, ApJ, 511, 34
- de Grijs et al. [2003a] de Grijs, R., Fritze-v. Alvensleben, U., Anders, P., Gallagher, J.S., Bastian, N., Taylor, V.A., & Windhorst, R.A. 2003a, MNRAS, 342, 259
- [9] de Grijs, R., Anders, P., Bastian, N., Linds, R., Lamers, H.J.G.L.M., & O’Neil, E.J. 2003b, MNRAS, 343, 1285
- de Vaucouleurs et al. [1991] de Vaucouleurs, G., de Vaucouleurs, A., Corwin, H.G., Buta, R.J., Paturel, G., & Foqué, P. 1991, Third Reference Catalogue of Bright Galaxies (New York: Springer-Verlag)
- [11] Drinkwater, M.J., Joens, J.B., Gregg, M.D., Phillipps, S. 2000, PASA, 17, 227
- Duc & Mirabel [1998] Duc, P.-A., & Mirabel, I.F. 1998, A&A, 333, 813
- Elmegreen et al. [1993] Elmegreen, B.G., Kaufman, M., Thomasson, M. 1993, ApJ, 412, 90
- [14] Hibbard, J.E., & Mihos, J.C. 1995, AJ, 110, 140
- Hibbard & van Gorkom [1996] Hibbard, J.E., & van Gorkom, J.H. 1996, AJ, 111, 655
- [16] Hilker, M., Kissler-Patig, M., Richtler, T., Infante, L., Quintana, H. 1999, A&AS, 134, 59
- Horellou & Koribalski [2003] Horellou, C., & Koribalski, B. 2003, A&SS, 284, 499
- [18] Gallagher, S.C., Charlton, J.C., Hunsberger, S.D., Zaritzky, D., & Whitmore, B.C. 2001, AJ, 122, 163
- [19] Gieles, M., Bastian, N., & Lamers, H.J.G.L.M. 2005, in prep.
- [20] Kissler-Patig, M. 2004, in ASP Conf. Ser. 322, The formation and evolution of massive young star clusters, eds. H.J.G.L.M. Lamers, L.J. Smith & A. Nota (San Francisco: ASP), 455
- [21] Knierman, K.A., Gallagher, S.C., Charlton, J.C. et al. 2003, AJ, 126, 1227
- [22] Landolt, A.U. 1992, AJ 104, 340
- [23] Larsen, S.S. 2000, MNRAS, 319, 893
- Larsen & Richtler [2000] Larsen, S.S., Richtler, T. 2000, A&A, 354, 836
- Larsen et al. [2002] Larsen, S.S., Efremov, Y.N., Elmegreen, B.G., Alfaro, E.J., Battinelli, P., Hodge, P.W., & Richtler, T. 2002, ApJ, 567, 896
- Larsen [2004] Larsen, S.S. 2004, A&A, 416, 537
- [27] Lejeune, T. & Schaerer, D. 2001, A&A, 366, 538
- [28] Maoz, D., Barth, A.J., Ho, L.C., Sternberg, A., & Filippenko, A.V. 2001, AJ, 121, 3048
- [29] Maraston, C., Bastian, N., Saglia, R.P., Kissler-Patig, M., Schweizer, F., Goudfrooij, P. 2004, A&A, 416, 467
- [30] Mieske, S., Infante, L., Benítez, N., et al. 2004, AJ 128, 1529
- [31] Mihos, C.J., Bothun, G.D., & Richstone, D.O. 1993, ApJ, 418, 82
- Mihos [2004] Mihos, C.J. 2004a, Clusters of Galaxies: Probes of Cosmological Structure and Galaxy Evolution (Cambridge: Cambridge Univ. Press)
- Mihos [2004] Mihos, C.J. 2004b, in IAU Symp., Recycling of Intergalactic and Interstellar Matter ed. P.-A. Duc, J. Braine & E. Brinks, Series Vol. 217
- Miller et al. [1997] Miller, B.W., Whitmore, B.C., Schweizer, F., & Fall, S. M. 1997, AJ, 114, 2381
- [35] Mulchaey, J.S., Davis, D.S., Mushotzky, R.F., Burnstein, D. 1996, ApJ, 456, 80
- [36] Reif, K., Mebold, U., Goss, W.M., van Woerden, H., & Siegman, B. 1982, A&AS, 50, 541
- Schlegel et al. [1998] Schlegel, D.J., Finkbeiner, D.P., & Davis, M. 1998, ApJ, 500, 525
- [38] Tran H.D., Ford, H.C., Illingworth, G.D. et al. 2003, ApJ, 585, 750
- Weilbacher et al. [2000] Weilbacher, P.M., Duc, P.-A., Fritze-von Alvensleben, U., Martin, P., & Fricke, K.J. 2000, A&A, 358, 819
- Weilbacher et al. [2004] Weilbacher, P.M., Fritze-von Alvensleben, U., & Duc, P.-A. 2004, in IAU Symp., Recycling of Intergalactic and Interstellar Matter ed. P.-A. Duc, J. Braine & E. Brinks, Series Vol. 217, p. 540
- Whitmore et al. [1999] Whitmore, B.C. Zhang, Q., Leitherer, C., et al. 1999, AJ, 118, 1551
- [42] Whitmore, B.C. 2002, STScI Symposium Series 14 ed. M. Livio (astro-ph/0012546)
- [43] Whitmore, B.C., & Zhang, Q. 2002, AJ, 124, 1418