RXTE observations of the dipping low-mass X-ray binary 4U 1624–49
We analyse ks of archival data from the Rossi X-Ray Timing Explorer (RXTE) of the 21 hr orbital period dipping low-mass X-ray binary 4U 1624–49. We find that outside the dips the tracks in the colour-colour and hardness-intensity diagrams (CDs and HIDs) are reminiscent of those of atoll sources in the middle and upper parts of the banana branch. The tracks show secular shifts up to . We study the power spectrum of 4U 1624–49 as a function of the position in the CD. This is the first time power spectra of this source are presented. No quasi-periodic oscillations (QPOs) are found. The power spectra are dominated by very low frequency noise (VLFN), characteristic for atoll sources in the banana state, and band limited noise (BLN) which is not reliably detected but may, uncharacteristically, strengthen and increase in frequency with spectral hardness. The VLFN fits to a power law, which becomes steeper when the source moves to the harder part of the CD.We conclude that 4U 1624–49 is an atoll source which in our observations is in the upper banana branch. Combining this with the high (0.5–0.7 ) luminosity, the long-term flux stability of the source as seen with the RXTE All-Sky Monitor (ASM), and with the fact that it is an X-ray dip source, we conclude that 4U 1624–49 is most likely a GX atoll source such as GX 3+1 and GX 9+9, but seen edge on.
Key Words.:
accretion, accretion disks – stars: individual: (4U 1624–49) – stars: neutron – X-rays: stars1 Introduction
The low-mass X-ray binary 4U 1624–49 was dubbed The Big Dipper because of the presence of periodic, 6 to 8 hr duration intensity dips in the X-ray lightcurve (Watson et al. 1985). No periodic dips longer than hr had been observed in other sources. This dipping is thought to be due to occultations of the central source by a thickened region of the accretion disc rim where the gas stream from the companion impacts upon the outer disc (see e.g. White & Swank 1982). Frank et al. (1987) suggested that the dips are due to cold clouds closer to the centre of the disc. However, their model predicts little dip activity for photon energies 6 keV, whereas the dips in 4U 1624–49 are detected up to 15 keV and even discernible above 15 keV (Smale et al. 2001). The orbital period of 4U 1624–49 is exceptionally long, 21 hr or 5–25 times longer than that of other dipping sources. This corresponds to a much larger stellar separation and accretion disc radius, and it can be assumed to also account for the long duration of the dips.
4U 1624–49 also shows strong flaring activity on timescales of a few thousand seconds. While dipping is most clear in the energies below keV, flaring is not significant at energies below 8 keV (Smale et al. 2001). Balucińska-Church et al. (2001) presented a hardness-intensity diagram exhibiting a branch which they interpreted as similar to a Z-source flaring branch (see Hasinger & van der Klis 1989, for definitions).
In atoll sources in the banana state, the very low frequency noise (VLFN) can be fitted with a power-law shape, (see Hasinger & van der Klis 1989), sometimes combined with a Lorentzian (e.g. Reerink et al. 2005; Di Salvo et al. 2003). The steepness of the power law increases as the source moves from the lower to the upper part of the banana. In this paper we study the colour-colour and hardness-intensity diagrams (CDs and HIDs) of 4U 1624–49 and look for features in the power spectra as a function of location in the CD. By investigating in particular the VLFN component, we find that 4U 1624–49 is consistent with being an atoll source which is in the banana state at the time of the observations.
2 Observations
In this work we analyse observations from the public RXTE archive. The data are from four proposals, spanning a period from January 1997 to November 1999. The log of these observations is presented in Table 1. We used data from the Proportional Counter Array (PCA; see Zhang et al. (1993) for instrument information, Jahoda et al. (1996) for in-orbit performance) on board RXTE, which consists of five co-aligned Proportional Counter Units (PCUs), sensitive in the energy range keV, with a total effective area of approximately 6,500 cm2 and a field of view, delimited by collimators, of FWHM. Each PCU contains three detector layers and in our analysis we used all the photons collected by the three layers taken together. We excluded data for which the source was less than 10 degrees above the horizon from the point of view of the satellite, and data for which the pointing offset was greater than 0.02 degrees. We also removed data drop outs and 1 s of data directly preceding and following them.
| Observation ID | Begin Time | Good | Rateb | Gain | Dip? |
|---|---|---|---|---|---|
| (UTC) | Timea | (c/s) | Epoch | ||
| (sec) | |||||
| 20068-01-03-00 | 05/01/97 00:22 | 2820 | 926 | 3 | no |
| 20068-01-04-00 | 05/01/97 03:44 | 1620 | 997 | 3 | no |
| 20068-01-05-00 | 05/01/97 07:36 | 1080 | 1039 | 3 | no |
| 20068-01-06-00 | 05/01/97 10:52 | 914 | 994 | 3 | no |
| 20068-01-07-00 | 05/01/97 14:19 | 2700 | 971 | 3 | no |
| 20067-01-01-000 | 06/01/97 11:14 | 25912 | 1021 | 3 | no |
| 20067-01-01-00 | 06/01/97 18:26 | 5468 | 1092 | 3 | no |
| 20067-01-01-01 | 06/01/97 20:44 | 24250 | 960 | 3 | no |
| 20071-02-01-00 | 04/05/97 15:57 | 19477 | 943 | 3 | no |
| 20071-02-01-02 | 06/05/97 10:46 | 5334 | 1001 | 3 | no |
| 20071-02-01-01 | 06/05/97 17:49 | 11720 | 928 | 3 | no |
| 20071-02-01-03 | 11/05/97 18:47 | 16828 | 890 | 3 | no |
| 30064-01-02-03 | 27/09/99 18:22 | 1269 | 865 | 4 | no |
| 30064-01-01-09 | 27/09/99 19:58 | 20529 | 990 | 4 | no |
| 30064-01-01-04 | 28/09/99 03:09 | 14792 | 1074 | 4 | no |
| 30064-01-01-08 | 28/09/99 09:13 | 15376 | 912 | 4 | part |
| 30064-01-01-000 | 28/09/99 14:09 | 28800 | 975 | 4 | part |
| 30064-01-01-00 | 28/09/99 22:09 | 2465 | 1108 | 4 | no |
| 30064-01-01-02 | 28/09/99 23:18 | 22084 | 1067 | 4 | no |
| 30064-01-01-03 | 29/09/99 07:32 | 13618 | 836 | 4 | part |
| 30064-01-01-010 | 29/09/99 12:30 | 28800 | 987 | 4 | no |
| 30064-01-01-01 | 29/09/99 20:30 | 12424 | 1025 | 4 | no |
| 30064-01-01-050 | 30/09/99 00:45 | 23997 | 916 | 4 | part |
| 30064-01-01-05 | 30/09/99 07:25 | 15547 | 974 | 4 | no |
| 30064-01-01-06 | 30/09/99 12:51 | 20077 | 1059 | 4 | no |
| 30064-01-01-07 | 30/09/99 23:22 | 2300 | 857 | 4 | no |
| 30064-01-02-01 | 01/10/99 00:01 | 1200 | 881 | 4 | no |
| 30064-01-02-000 | 01/10/99 02:44 | 28736 | 868 | 4 | part |
| 30064-01-02-00 | 01/10/99 10:43 | 8947 | 1067 | 4 | no |
| 30064-01-03-00 | 20/11/99 12:21 | 14400 | 594 | 4 | complete |
-
a
Total on-source observing time.
-
b
Average, not corrected for the background, normalised to 5 PCUs.
3 Analysis and results
3.1 Colour-colour and hardness-intensity diagrams
We produced background-subtracted lightcurves binned at 128 s using PCA Standard 2 mode data (16 s time resolution). The soft colour (SC) was defined as the ratio of the count rates in the bands keV and keV, the hard colour (HC) as the ratio of the count rates in the bands keV and keV. For the intensity, we took the total count rate in the keV range. Hardness and intensity were normalised to the Crab values, as obtained during calibration observations close in time and in the same gain epoch (see for details e.g. van Straaten et al. 2003).
To allow for a better comparison of 4U 1624–49 with known atoll sources, data obtained during dips (see, e.g., Fig. 2 in Smale et al. 2001), where colours and intensity are affected by the obscuration process producing the dips, were excluded from the analysis. The resulting CD and HID are shown in Fig. 1.
We grouped the data into 3 large segments well separated in time. The observations of P20067 and P20068 spanned only 2 days and were taken together in our analysis. The result was then compared with the observations of P20071 (spanning 8 days) and P30064 (spanning 4 days; 30064-01-03-00 was not used, since it mainly consists of a dip) in the CDs and HIDs.
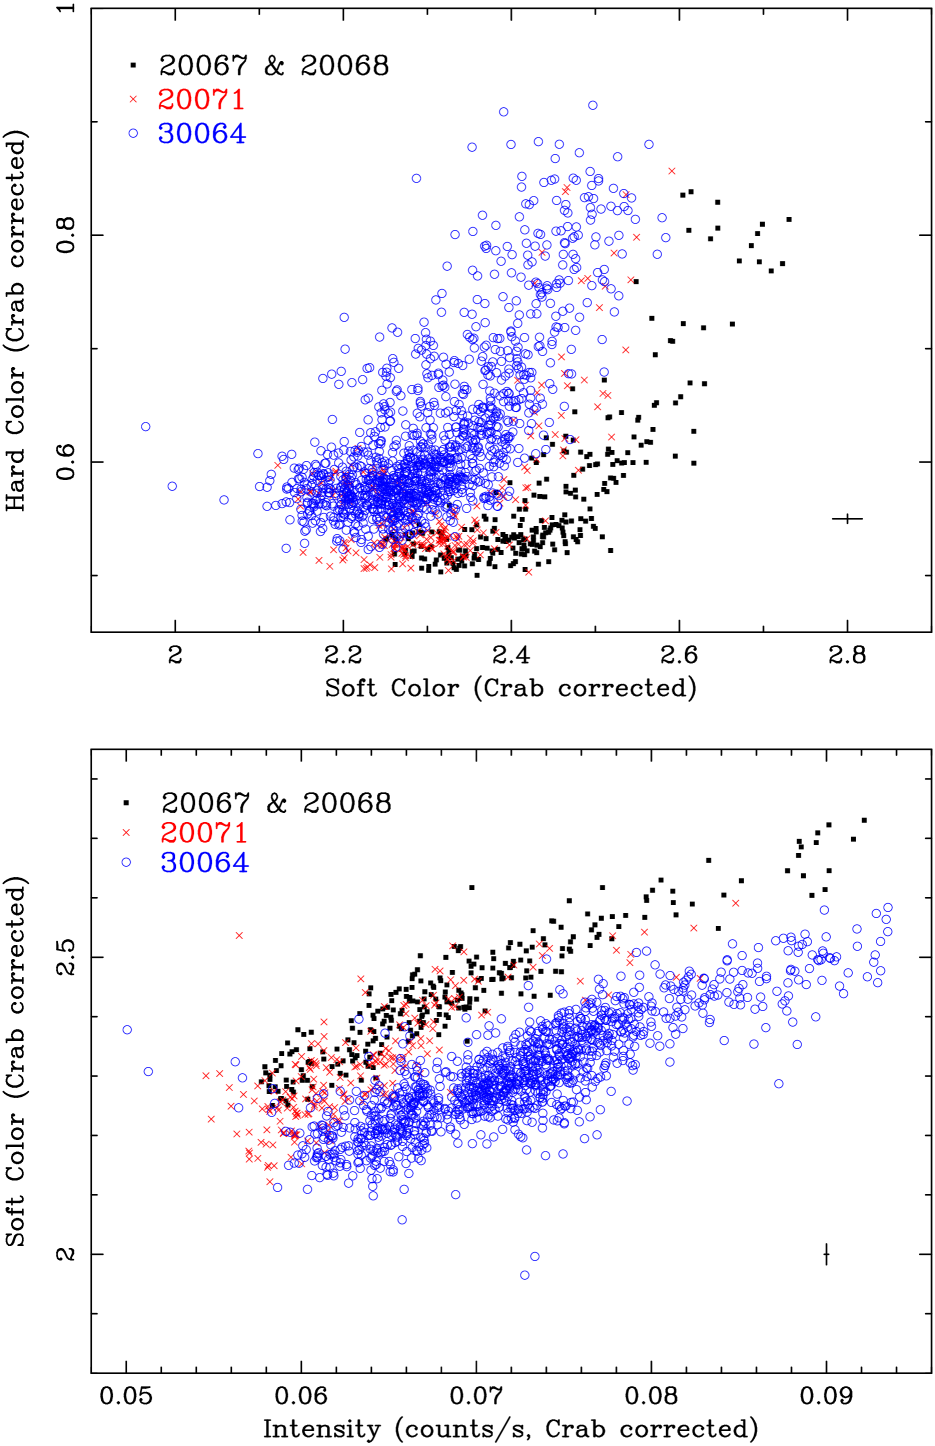
The shape of the CD suggests that the source is an atoll source in the banana state (Hasinger & van der Klis 1989). Most of the time, the source is in the lower banana (softer state); occasionally it moves through the banana to the harder upper banana region. By investigating the relation between the CD/HIDs and light curves, we found that the softer points in the lower banana are due to the persistent radiation that the source is normally emitting outside the dips, whereas the harder points come from occasional intensity flares.
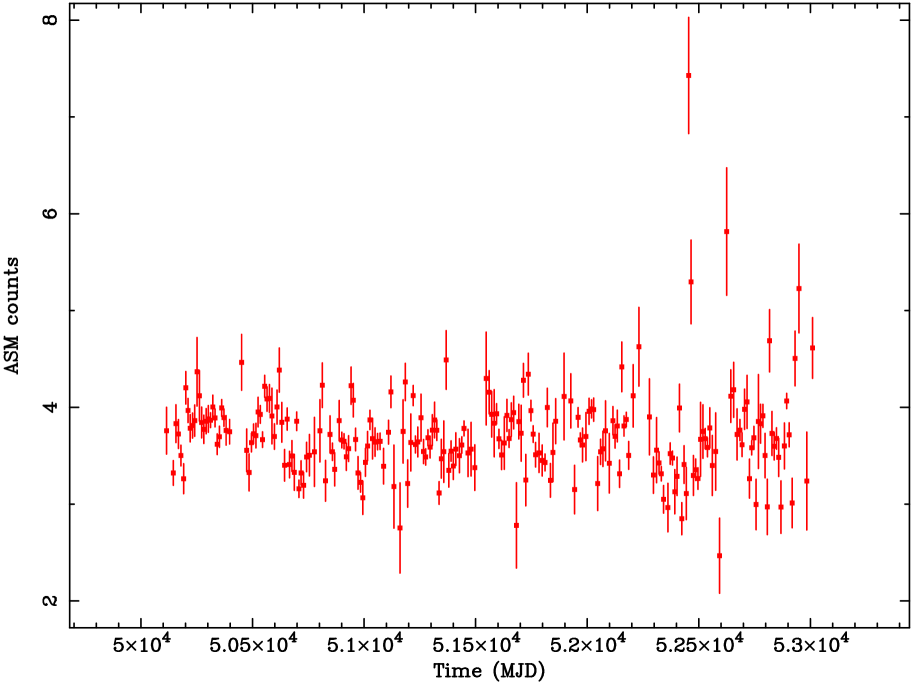
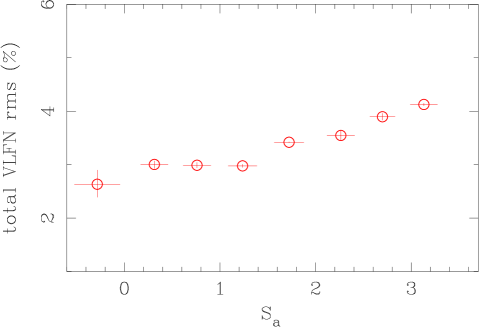
Both the CD and HID show secular shifts (e.g. Di Salvo et al. 2003) consistent with the SC decreasing, and the HC and/or the intensity gradually increasing over the almost 3-yr period of the observations. The RXTE All-Sky Monitor (ASM, see Fig. 2) lightcurve shows no clear increasing trend, so we attribute the shift in the HID to a shift in SC. The colours change up to .
3.2 Power spectra
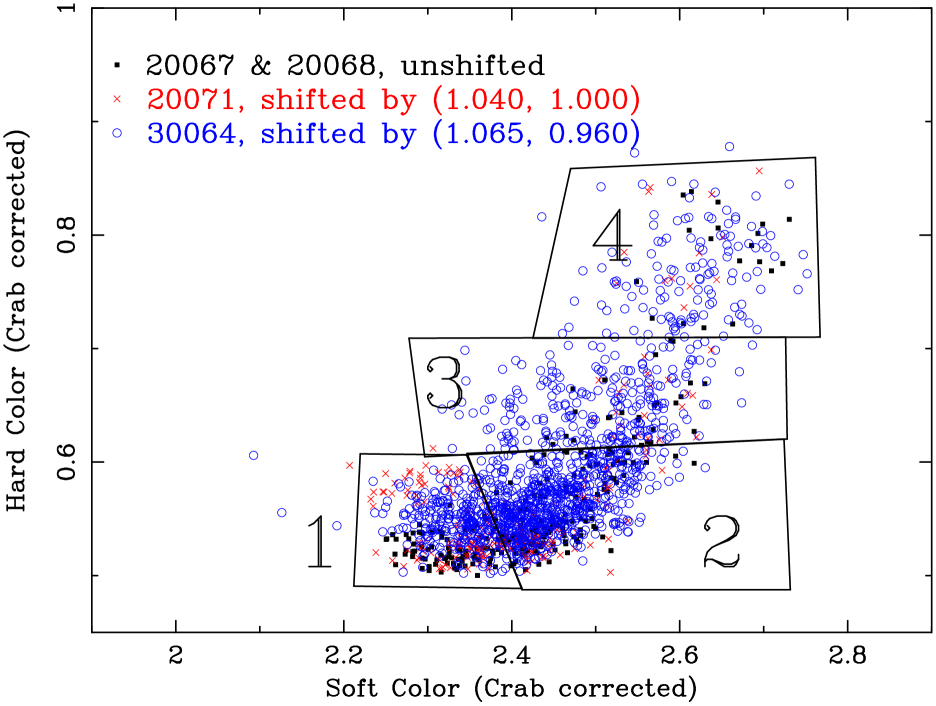
To study the power spectrum as a function of the position in the CD we created power spectra from all non-dip data obtained in the Good-Xenon mode. Previous experience with atoll sources shows (e.g. Di Salvo et al. 2003, 4U 1636–53) that the power spectra depend on the position of the source relative to the track but not on the track’s location in the CD, i.e., its secular shifts. On this basis we shifted the colour-colour points of P20071 and P30064 to approximately coincide with those of P20067 and P20068. The data points of P20071 were shifted in SC by 4%, but not shifted in HC. The data points of P30064 were shifted in SC by 6.5%, and by -4% in HC. The result is shown in Fig. 3. We divided the CD into four regions, 1, 2, 3, and 4 (Fig. 3). These regions were chosen because the power spectra of atoll sources are observed to change when the source moves from the lower banana to the upper banana and back (see Hasinger & van der Klis 1989). For statistical reasons, the regions are quite large. A region corresponds to between 142 and 791 power spectra. After confirming that the power spectra in each region do not depend on the data segment we calculated one average power spectrum for each region.
We used Good Xenon data, with data segments of 128 s and a time resolution of 1/8192 s (s), to produce Fourier power spectra, such that the lowest available frequency is 1/128 s and the Nyquist frequency is 4096 Hz. A Poisson noise level, estimated with the Zhang model (Zhang et al. 1995), was subtracted. For 4U 1630–47 it was found (Klein-Wolt 2004) that the Zhang model does produce the correct shape for the Poisson noise, but that the estimated level is slightly too high or too low. To correct for this, an aditional shift was introduced, where the scaling factor for the shift is determined in a (high) frequency range where no features are known to be present (see Klein-Wolt 2004, for the details of this method). In our analysis we determined the shift in the 3072–4096-Hz range and found it to be of order in power in all cases, having a negligible effect on the results. We checked for features in the 3 to 4 kHz range by also creating power spectra with a Nyquist frequency of 8192 Hz and found none, justifying this range for the noise estimate.
We then made a fit to the average power spectrum for each region. We used a power law, in most fits combined with a Lorentzian, to fit the noise below 1 Hz, the “total VLFN.” The power-law component is called VLFN as in Hasinger & van der Klis (1989), and the Lorentzian component is called “high VLFN” (see, e.g., Schnerr et al. 2003). In some cases another significant () Lorentzian was detected; this component is called the “band-limited noise (BLN)” (see, e.g., van Straaten et al. 2002). All high-VLFN and BLN features in the spectra are broad, and could be well described with zero-centered Lorentzians. Therefore we fixed the quality factor to . This results in the characteristic frequency of each Lorentzian component being equal to its half-width at half-maximum. The actual Lorentzian functions fitted were of the form
| (1) |
where [the fractional root-mean-square (rms) integrated from to ], and were the independent fit parameters.

| Region | 1 | 2 | 3 | 4 |
| Ratea ( c/s) | ||||
| power spectra | 416 | 791 | 262 | 142 |
| Backgroundb ( c/s) | ||||
| all parameters left free | ||||
| VLFN | ||||
| VLFN rmsc (%) | ||||
| high VLFN | ||||
| high VLFN rms (%) | ||||
| total VLFN rms (%) | ||||
| BLN | - | - | - | |
| BLN rms (%) | - | - | - | |
| 120/95 | 79/95 | 102/97 | 104/93 | |
| power law only | ||||
| rmsc (%) | ||||
| 145/95 | 129/95 | 100/95 | 127/95 | |
| fixed power law | ||||
| VLFN | 1.7 (fixed) | 1.7 (fixed) | 1.7 (fixed) | 1.7 (fixed) |
| VLFN rmsc (%) | ||||
| high VLFN (Hz) | ||||
| high VLFN rms (%) | ||||
| total VLFN rms (%) | ||||
| BLN (Hz) | ||||
| BLN rms (%) | ||||
| 130/94 | 81/94 | 104/94 | 107/94 | |
Errors correspond to .
-
a
PCA count rate, 5 PCUs, not corrected for the background. Counting statistics errors are quoted.
-
b
Averaged background. Counting statistics errors are quoted.
-
c
rms amplitude calculated in the frequency range 0.01–1.0 Hz.
-
d
95% confidence upper limit.
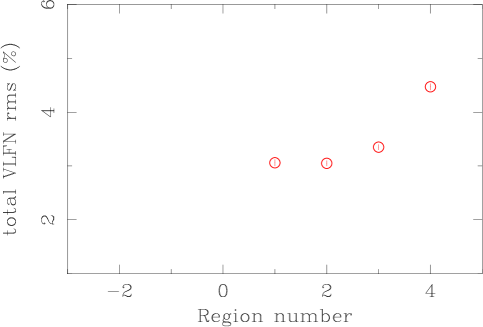
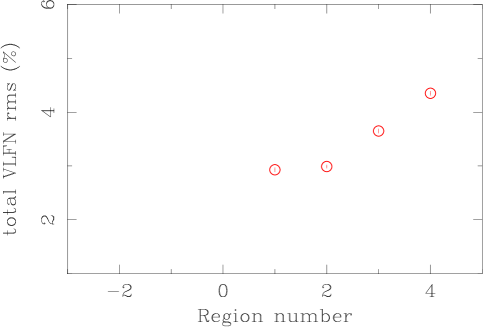
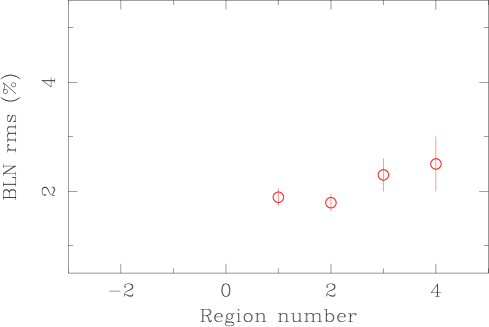
We plot the power spectra and the fit functions in the power times frequency representation where power spectral density is multiplied with its Fourier frequency. The results are shown in Fig. 4 and in Table 2. All power spectra are dominated by the VLFN, which is fitted with a power law and a Lorentzian. The Lorentzian in region 3 is not significant. For this feature we calculated an upper limit to the rms. Also the total VLFN rms was calculated and is shown in Table 2. The feature in region 3 around 3000 Hz is not real; it is due to aliasing and disappears when a Nyquist frequency of 8 kHz instead of our usual 4 kHz is used. In region 4, we found a significant feature around 10 Hz which we attribute to the BLN. There seems to be a feature around 3 Hz as well, but this feature is not significant.
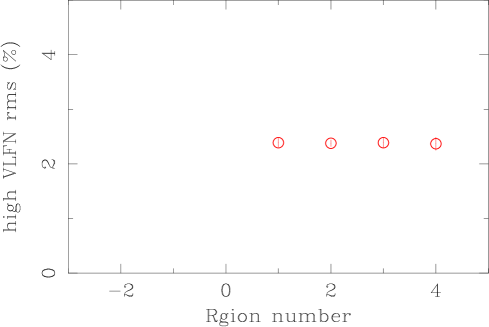
The steepness of the power law fitting the VLFN increases when the source moves from region 1 through to 4. This is what we expect from an atoll source in the banana state. Also the fractional rms is consistent with increasing as the hardness increases. The Lorentzian at 10 Hz in region 4 affects the index and rms of the power law only slightly. Fitting this region with a power law and only one Lorentzian gives and an rms of , making this still the steepest and strongest power law of the four. We also made fits to the power spectra using a power law and no Lorentzians. This allows for a better comparison between region 3, which has no significant Lorentzians, and the other regions. The results of this are shown in Table 2. Also in this case steepness and rms increase as the source moves from 1 to 4. The fact that does not increase when moving from region 1 to 2, may be a result of the choice of the regions, i.e., region 2 has the same hard colour as region 1. Finally we fitted the power spectra with the power-law steepness fixed to , thus assuring that the power law fitting the VLFN does not fit to features at higher frequencies. We then find two Lorentzians in each region. The results are shown in Table 2. The rms of the power law still increases when the source moves to the harder part of the CD. Besides we note that the characteristic frequencies of the Lorentzians significantly increase when the source moves from region 1 to region 4, from to and from to for the high VLFN and the BLN, respectively.
4 Discussion
We analysed ks of archival RXTE data of 4U 1624–49 taken between January 1997 and November 1999.
The shape of the CD suggests that 4U 1624–49 is an atoll source, which is in the banana state at the time of the observations. We will investigate this suggestion in the light of the paper by Hasinger & van der Klis (1989) in which the two classes of LMXBs, atoll and Z sources, are first defined. They find that atoll sources differ from Z sources in:
-
•
the absence of horizontal branch QPOs,
-
•
the fact that the VLFN is less steep,
-
•
the presence of clear wiggles in the VLFN,
-
•
the fact that they often show very strong high-frequency noise (BLN in this paper, after e.g. van Straaten et al. 2002), which is arguably different from normal-branch/flaring-branch QPOs in Z sources.
We first note that no QPO is detected in the power spectra of 4U 1624–49 (see also Smale et al. 2001), and that the power spectra also show wiggles (the high-VLFN components) in the VLFN. Balucińska-Church et al. (2001) argued that during flare evolution systematic changes clearly take place in the HIDs very similar to the flaring branch of Z-track sources displayed on similar diagrams. Hasinger & van der Klis find a VLFN power-law index in the range on the flaring branch, and on the banana branch. When we leave the power-law index free in our fits, we find it to be in the range (except in the case where also a significant BLN feature is found, see Section 3.2). From these arguments we conclude that 4U 1624–49 should be classified as an atoll source in the banana branch. Consistent with this, the values of and the fractional rms of the VLFN tend to increase when moving to the upper right in the CD, like other atoll sources moving up the banana branch.
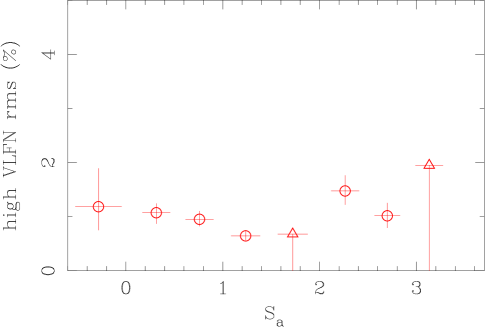
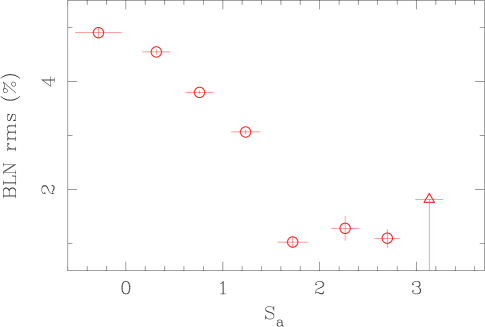
The banana branch is usually subdivided into the lower left banana (LLB), the lower banana (LB), and the upper banana (UB, see again Hasinger & van der Klis 1989, for definitions). Reerink et al. (2005) in their study of GX 3+1, GX 9+1, and GX 9+1 propose to define as a boundary between the LB and the UB the point where the trends of the power spectral components as a function of position in the branch change. The most notable trend changes in their study are those in the high-VLFN rms, which changes from a flat or slightly decreasing trend to an increasing trend, and that in the BLN rms, which changes from a decreasing trend to a flat or slightly increasing trend. Comparing our results to theirs (see Fig. 5), we find that 4U 1624–49 is in the UB.
GX 3+1 4U 1624–49 4U 1624–49
all parameters left free fixed power law
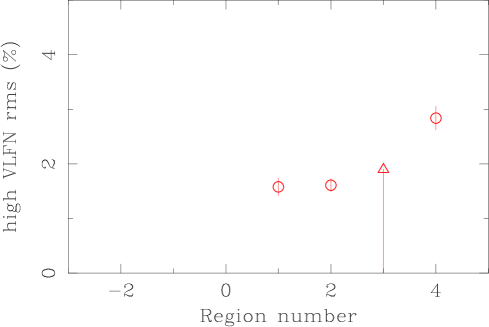
In regions 1, 2, and 4, we found a significant (larger than 3) Lorentzian with a characteristic frequency in the range of 0.11 to 0.16 Hz, a high-VLFN component. The fractional rms of this Lorentzian ranged from 1.6% to 2.8%. For region 3, we could set an upper limit to a similar Lorentzian with a fractional rms of 1.9% (95% confidence). These bumps in the VLFN are probably the same as those reported for the bright atoll sources GX 13+1 (Schnerr et al. 2003, 3% rms at 1 Hz), and e.g. GX 9+9 and GX 9+1 (Reerink et al. 2005, 2% up to 4% at 0.1 Hz). We also found a significant Lorentzian at 10 Hz in region 4. This is curious, since for other atoll sources, the BLN component at higher frequencies becomes weaker when the source moves to the upper banana. On the other hand, some atoll sources in the banana state show a QPO around 6 Hz when the source is at the tip of the upper banana. We searched for this QPO by applying the analysis outlined in § 3.2 to the top-most part of region 4, but did not find it.
When using a power law with index fixed to to fit the “low” VLFN, all four regions show a significant BLN component. However, whereas for other sources the characteristic frequency of the BLN tends to decrease as the source moves to the upper banana, in 4U 1624–49 this frequency increases. Also, the BLN frequency never reaches values of several 10 Hz, such as in most of the atoll sources (including GX 13+1 (Schnerr et al. 2003, up to 30 Hz), and GX 9+9 and GX 3+1 (Reerink et al. 2005, up to 60 Hz and 24 Hz, respectively)).
We observed secular shifts in the colour-colour and hardness-intensity diagrams. Shifts like these are also observed in some Z sources (Smale et al. 2003; Kuulkers et al. 1994, 1996, and references therein), and in the atoll sources 4U 1636–53 (Prins & van der Klis 1997; Di Salvo et al. 2003) and GX 13+1 (Schnerr et al. 2003). The shifts in 4U 1624–49 are most clear in the colours, up to , with little difference between HC and SC. The intensity of 4U 1624–49 is rather stable, as seen with the ASM (Fig. 2). In 4U 1636–53, the shifts in colours are only a few per cent, whereas the shift in intensity is up to . The shifts in GX 13+1 are up to in HC, in SC, whereas there is only a shift in intensity in the upper-most part of the banana (up to ). The shifts in 4U 1624–49 towards higher HC and/or lower SC seem to be rather gradual over the almost 3-yr period of the observations, whereas GX 13+1 moves back and forth between higher and lower HC on a time scale of weeks. The shift in 4U 1636–53 is not gradual at all, this source appears to “jump” from one state to another as is reflected in the lower kHz QPO frequency vs. count rate diagram (Fig. 2 in Di Salvo et al. 2003). This may indicate a different source for the secular shifts in 4U 1636–53 as opposed to GX 13+1 and 4U 1624–49. Schnerr et al. (2003) propose secular geometry changes such as precession as possible sources for the secular shifts, which would account for the gradual change. They assume a head-on view to GX 13+1 (and a jet scenario) to explain the large shift in HC. 4U 1624–49 is a dipping source and thus has a high inclination ( according to Frank et al. 1987), which might explain the much smaller shift in HC for this source. For more insight in the processes behind the secular shifts, more data on different sources and per source is necessary, and thus long-term X-ray observations of several sources are recommended.
5 Conclusion
Outside the dips, 4U 1624–49 shows properties that are mostly consistent with those of an atoll source at high luminosity: a “middle” and upper banana branch in CD/HIDs, secular shifts of the tracks, a power spectrum dominated by a few rms VLFN that becomes stronger and steeper at harder colours. All this is very similar to what is observed in “GX atoll sources” such as GX 3+1 and GX 9+9 (Reerink et al. 2005). However, to the extent that it can be detected the characteristic frequency of the BLN may increase, rather than decrease as in those sources. During our observations, the luminosity of 4U 1624–49 was ergs s-1 (Smale et al. 2001; Balucińska-Church et al. 2001), i.e., , which is in accordance with luminosities inferred for the GX atoll sources. Combining all this with the fact that 4U 1624–49 shows periodic dips and is rather stable in flux we conclude that 4U 1624–49 most likely is a GX atoll source seen edge on. The fact that the BLN in this source has a characteristic frequency that is atypically low and monotonically increasing may be related to this unusual inclination of the source, perhaps because the innermost region of the disk where the highest frequencies originate is obscured by structure slightly further out, e.g. a puffed-up disk region associated with the radiation-pressure dominated region.
Acknowledgements.
We would like to thank our colleagues of The X-ray/high-energy astrophysics group at the “Anton Pannekoek Institute” for their help and useful discussions. DL especially wishes to thank Thomas Reerink. This work was supported in part by the Netherlands Organisation for Scientific Research (NWO). This research has made use of data obtained through the High Energy Astrophysics Science Archive Research Center Online Service, provided by the NASA/Goddard Space Flight Center.References
- Balucińska-Church et al. (2001) Balucińska-Church, M., Barnard, R., Church, M. J., & Smale, A. P. 2001, A&A, 378, 847
- Di Salvo et al. (2003) Di Salvo, T., Méndez, M., & van der Klis, M. 2003, A&A, 406, 177
- Frank et al. (1987) Frank, J., King, A. R., & Lasota, J.-P. 1987, A&A, 178, 137
- Hasinger & van der Klis (1989) Hasinger, G. & van der Klis, M. 1989, A&A, 225, 79
- Jahoda et al. (1996) Jahoda, K., Swank, J. H., Giles, A. B., et al. 1996, in Proc. SPIE Vol. 2808, p. 59-70, EUV, X-Ray, and Gamma-Ray Instrumentation for Astronomy VII, Oswald H. Siegmund; Mark A. Gummin; Eds., 59–70
- Klein-Wolt (2004) Klein-Wolt, M. 2004, PhD thesis, University of Amsterdam
- Kuulkers et al. (1994) Kuulkers, E., van der Klis, M., Oosterbroek, T., et al. 1994, A&A, 289, 795
- Kuulkers et al. (1996) Kuulkers, E., van der Klis, M., & Vaughan, B. 1996, A&A, 311, 197
- Prins & van der Klis (1997) Prins, S. & van der Klis, M. 1997, A&A, 319, 498
- Reerink et al. (2005) Reerink, T. J., Schnerr, R. S., van der Klis, M., & van Straaten, S. 2005, submitted to A&A
- Schnerr et al. (2003) Schnerr, R. S., Reerink, T., van der Klis, M., et al. 2003, A&A, 406, 221
- Smale et al. (2001) Smale, A. P., Church, M. J., & Bałucińska-Church, M. 2001, ApJ, 550, 962
- Smale et al. (2003) Smale, A. P., Homan, J., & Kuulkers, E. 2003, ApJ, 590, 1035
- van Straaten et al. (2002) van Straaten, S., van der Klis, M., di Salvo, T., & Belloni, T. 2002, ApJ, 568, 912
- van Straaten et al. (2003) van Straaten, S., van der Klis, M., & Méndez, M. 2003, ApJ, 596, 1155
- Watson et al. (1985) Watson, M. G., Willingale, R., King, A. R., Grindlay, J. E., & Halpern, J. 1985, in International Astronomical Union Circular, 2–+
- White & Swank (1982) White, N. E. & Swank, J. H. 1982, ApJ, 253, L61
- Zhang et al. (1993) Zhang, W., Giles, A. B., Jahoda, K., et al. 1993, in Proc. SPIE Vol. 2006, p. 324-333, EUV, X-Ray, and Gamma-Ray Instrumentation for Astronomy IV, Oswald H. Siegmund; Ed., 324–333
- Zhang et al. (1995) Zhang, W., Jahoda, K., Swank, J. H., Morgan, E. H., & Giles, A. B. 1995, ApJ, 449, 930