Canonical Particle Acceleration in FRI Radio Galaxies
Abstract
Matched resolution multi-frequency VLA observations of four radio galaxies are used to derive the asymptotic low energy slope of the relativistic electron distribution. Where available, low energy slopes are also determined for other sources in the literature. They provide information on the acceleration physics independent of radiative and other losses, which confuse measurements of the synchrotron spectra in most radio, optical and X-ray studies. We find a narrow range of inferred low energy electron energy slopes n(E) E-2.1 for the currently small sample of lower luminosity sources classified as FRI (not classical doubles). This distribution is close to, but apparently inconsistent with, the test particle limit of n(E) E-2.0 expected from strong diffusive shock acceleration in the non-relativistic limit. Relativistic shocks or those modified by the back-pressure of efficiently accelerated cosmic rays are two alternatives to produce somewhat steeper spectra. We note for further study the possiblity of acceleration through shocks, turbulence or shear in the flaring/brightening regions in FRI jets as they move away from the nucleus. Jets on pc scales and the collimated jets and hot spots of FRII (classical double) sources would be governed by different acceleration sites and mechanisms; they appear to show a much wider range of spectra than for FRI sources.
1 Introduction
The acceleration of relativistic particles in radio galaxies occurs at multiple sites, and probably through multiple mechanisms. As we have long known, particles are first accelerated to relativistic energies near the nucleus, where they illuminate jets and other structures on pc scales (Cohen et al., 1977; Jones, O’Dell & Stein, 1974). At scales of - pc, in situ acceleration must also be present in some sources, in order to produce the short radiative lifetime relativistic particles seen in optical and X-ray synchrotron radiation (see review by Worrall (2004)). Finally, to pc away from the nucleus, powerful radio galaxies often contain compact radio and even optical “hot spots”, yet another site of relativistic particle acceleration (Meisenheimer et al., 1989) powered by the flow from the AGN (see Gopal-Krishna et al. (2001); Aharonian (2002) for alternative views).
In this paper, we investigate one key aspect of the acceleration processes, viz., what is the limiting logarithmic slope of the relativistic electron energy distribution at low energies. This slope is an indicator of the basic acceleration processes, although it represents the full acceleration history of the electrons through a variety of sites. At higher energies (higher observed synchrotron frequencies), the confusing effects of radiative and other losses set in and the original signatures of the acceleration process are usually obscured. At sufficiently low energies, the power law may be affected, e.g., by ionization losses, but no such effects are visible in the data presented here.
For practical reasons, most of the information available on low frequency energy slopes is for Fanaroff-Riley I (FRI) sources, those without bright peaks of emission at their ends (Fanaroff & Riley, 1974). This class includes the tailed radio galaxies as well as more diffuse sources, and they typically have low radio luminosities ( Watts/Hz at 1.4 GHz, dependent on the host optical luminosity (Owen & Ledlow, 1994)). We also include some brief references to the information available on FRII sources, which include the prototypical “classical doubles”.
1.1 Low energy/frequency slope measurement challenges
Although the importance of the low energy slope for understanding particle acceleration has been recognized for decades, these measurements are not easily done. Historically, integrated spectra have been assumed to reflect the low frequency power law (e.g. Alexander (1987)), but the two values are virtually unrelated as discussed further below. A second method has been to fit multi-frequency spectra with standard spectral models (Carilli et al., 1991). However, the models often provide poor fits to the data, and the low-frequency index is either allowed to float as a function of position (which would indicate fresh relativistic acceleration at each location) or is assumed to be some fixed value (Alexander, Brown & Scott, 1984).
In order to perform spectral measurements, maps at the different frequencies must be made at the same sufficiently high resolution. This may result in beam sizes that are larger than spectral variations in the source, as well as the more pernicious effects of variations along the line of sight. Such variations arise from a number of structures and processes in radio galaxies. FRI jet spectra are often contaminated by the presence of surrounding sheaths that have locally steeper spectra. These can be detected through tomographic analysis (Katz-Stone and Rudnick, 1997; Katz-Stone et al., 1999; Hardcastle, 1999b) or through polarization structure (Swain et al., 1998). FRII jets should sample the material emerging from the nucleus, but their spectra are often difficult to determine because they are embedded in locally steeper spectrum lobes (Treichel et al., 2001). The lobes themselves are difficult to use for determining the original low frequency index. As seen in the simulations of FRII sources by Tregillis, Jones & Ryu (2001, 2004), populations of lobe electrons with very different histories may be found along any given line of sight. A few will have passed through a strong terminal shock; many will have experienced acceleration in the network of weaker shocks in the hot spot region.
The general effect of these non-uniformities on the observed spectrum is to broaden it toward a power law, even if every volume element contained an exponentially cutoff electron distribution. The effect is worst for integrated spectra, which sum over all the emission in the source. As shown by Young et al. (2002), the resulting approximate power law is not simply related to the low frequency spectral index, and so integrated spectra are not reliable indicators of the original relativistic particle acceleration as mentioned above. Lower levels of contamination tend to preferentially flatten the steepest spectral indices for simple arithmetic reasons. Curiously, this can have the effect of steepening the derived low frequency index; this occurs because the flattening is more prominent at higher frequencies, and the reduction in spectral curvature forces the fits to assume that the observations are thus closer to the low frequency limit.
1.2 Methods for measuring low frequency slope
In this paper, we invoke three methods to isolate the low frequency spectral slope. In each case, we either avoid or take care to minimize problems with integration along the line of sight. The first method is the most direct, viz. that spatially resolved spectra are available at no less than three frequencies in the low-frequency asymptotic power law portion of the spectrum. This is rarely available, and only one example from the literature, M87, is used here.
The second method is the use of color-color (CC) diagrams. These are based on the ansatz that there is a single shape to the relativistic electron population throughout the source. The spectral shape is not affected by adiabatic or radiative losses or magnetic field strength variations; the observed two-point spectral indices are, of course, affected by these changes. Color-color diagrams provide an equivalent mapping of the spectrum, but allow one to put all the data from different positions in the source on one plot. Color- color diagrams effectively measure the local curvature of the spectrum () at different places along the spectrum (as characterized by ). This results from the shift of the spectrum from one location to another due to changes in local magnetic fields or radiative or adiabatic losses. The assumption of a single electron population is tested by looking for more than a single locus of points in the CC diagram, with a shape given by one of the standard models (Katz-Stone, Rudnick & Anderson, 1993). If an appropriate single locus is seen, then we perform a one parameter fit for the low frequency index using a standard model. This procedure works even if the low frequency index is not directly observed, although the errors will, of course, increase along with the required extrapolation. In the complicating case where multiple particle populations are present within each beam, the procedure will visibly fail, as noted further below.
In this paper, we perform least-square fits to the CC data by using the Jaffe-Perola (JP, Jaffe & Perola (1973) model which describes synchrotron loss spectra when the pitch angles of the radiating electrons are continuously re-isotropized. These give very similar low frequency slopes to fits using the alternative Kardashev-Pacholcyzk (Kardashev, 1962; Pacholczyk, 1970) spectral shape, which falls off more slowly, as long as the observed range in two-point spectral indices is . If the two-point spectra change by more than that across the source, then only the JP models will fit.
The third method for determining the low-frequency spectral slope is to use spectral tomography to isolate the spatial trends in jet spectral index (3C449: Katz-Stone and Rudnick (1997); 1231+674 and 1433+553: Katz-Stone et al. (1999)). Tomography simply involves the subtraction of images at two frequencies with a variety of scaling factors. One often observes the disappearance of a distinct structure (e.g., a jet) in one of these residual maps, with flux from a second component (e.g., a diffuse sheath) still present at the same location. In such cases, the spectral index derived from the two original maps is some mixture from the two overlapping components; the scaling factor responsible for a structure’s disappearance, however, directly gives the structure’s spectral index. The asymptotic spectral index observed as the jets approach the nucleus is most likely the low frequency power law. If instead, the underlying electron spectrum were actually curved in this region, then the observed local changes in jet brightness (including magnetic field) would have led to changes in observed spectral index between two fixed frequencies. Without tomography, regions of constant spectral index are very difficult to detect because of confusion from the steeper spectrum sheaths.
1.3 Acceleration mechanisms
A good review of possible particle acceleration mechanisms can be found in Eilek and Hughes (1991). The most popular scheme is Fermi acceleration (Fermi, 1949); in the case of first-order Fermi acceleration, (diffusive shock acceleration) particles cross a shock boundary where they can gain energy through head-on collisions (e.g., Eilek and Hughes, 1991; Drury, 1989; Kirk, 1989). Relativistic shocks (Achterberg et al., 2001) and shocks that are modified by the back-pressure of the accelerated cosmic rays (Baring & Kirk, 1991) change the shape of the synchrotron spectrum and its low frequency slope. Other acceleration mechanisms rely on a direct current electric field. In these cases, the energy required may come from magnetic field line reconnection (e.g., Eilek and Hughes, 1991; Litvinenko, 1999; Lesch and Birk, 1998). Other mechanisms involve the gross kinematics of the plasma; for example, Rieger and Mannheim (2002) (and references therein) describe shear and centrifugal acceleration of particles. In general, these “second order” processes are less efficient than diffusive shock acceleration. In all cases, the low frequency slope of the relativistic particles approaches a power law that reflects the acceleration physics (Blandford & Eichler, 1987; Ostrowski & Schlickeiser, 1993). In the case of test particle diffusive shock acceleration, the slope is simply related to the Mach number of the accelerating shock. For a power law distribution of electrons, N(E) Es there is a power law synchrotron spectrum, I(), where the logarithmic slopes are related by . In the strong shock, high Mach number limit, s=2 (=-0.50).
The low frequency spectral slope is also important for Inverse Compton studies of radio galaxy lobes (e.g. Feigelson et al. (1995); Kaneda et al. (1995)), where the synchrotron radiating relativistic electrons upscatter the cosmic microwave background photons to X-ray energies. In G fields, the keV X-rays are produced by electrons radiating at MHz, far below the observed range. Thus, an accurate extrapolation of the low frequency synchrotron spectrum (energy distribution) is important, e.g., in combining X-ray and synchrotron measurements to derive the magnetic field strength (Harris & Grindlay, 1979). The low frequency slope assumes even greater importance for recent calculations of beaming factors in relativistic jets, (Kraft et al., 2005), where a change in slope of 0.2 leads to an order of magnitude change in beaming factor.
1.4 Source selection
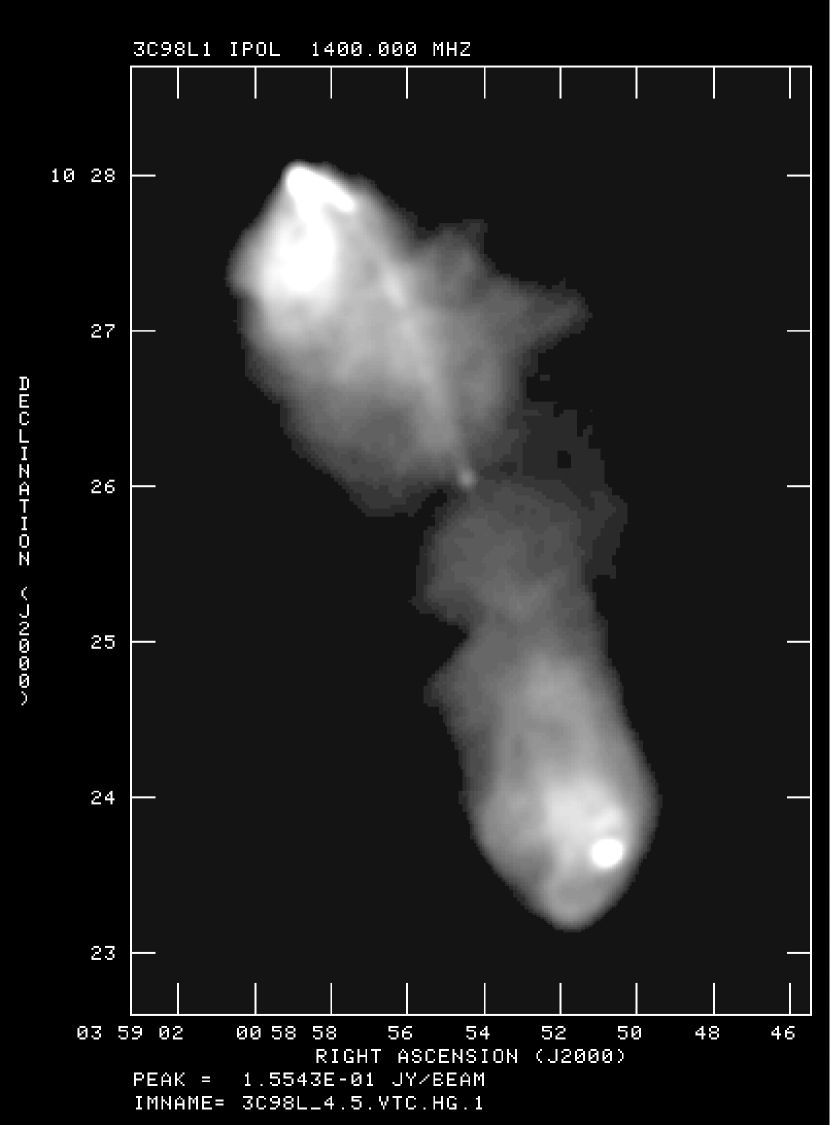
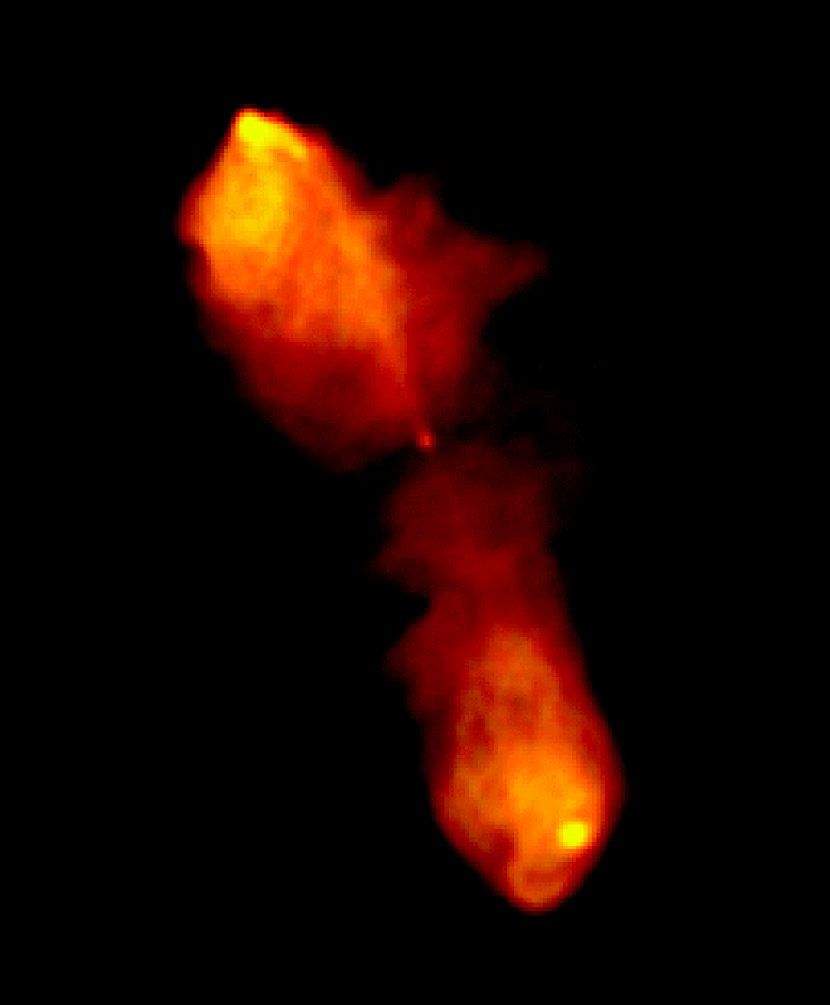
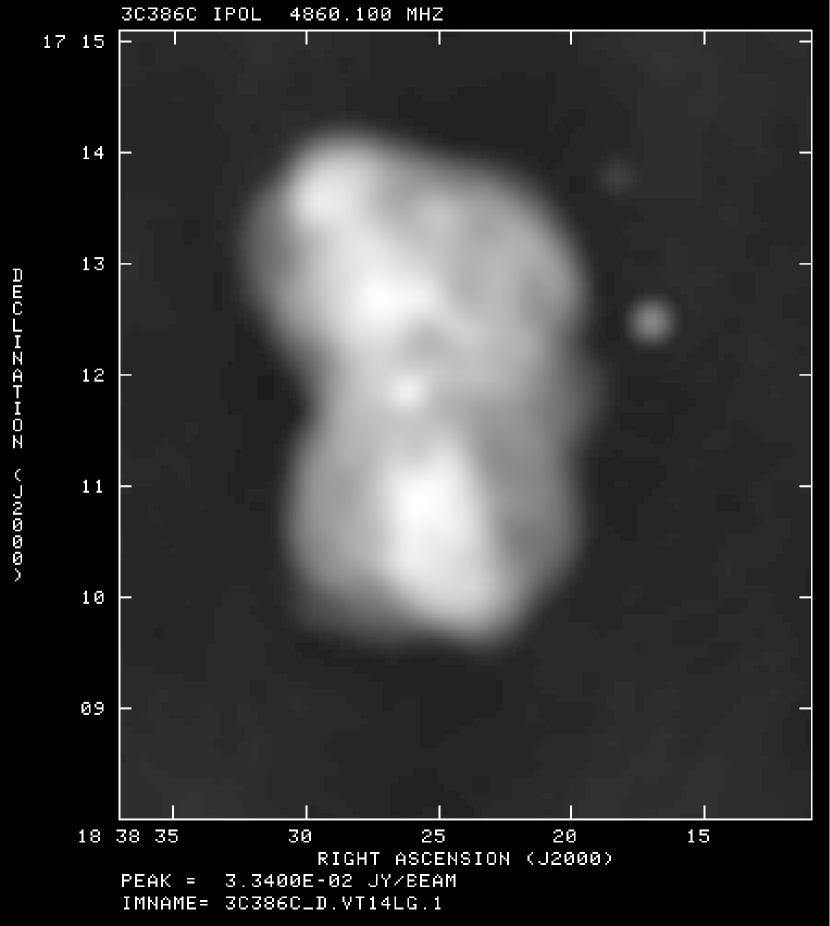
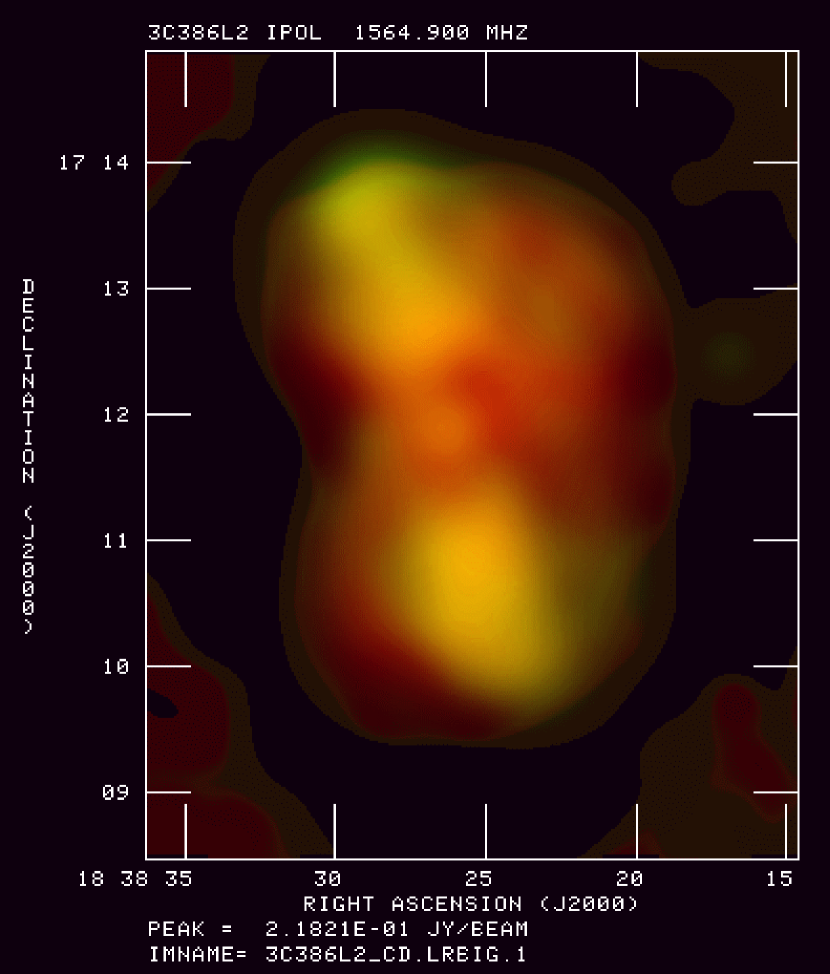
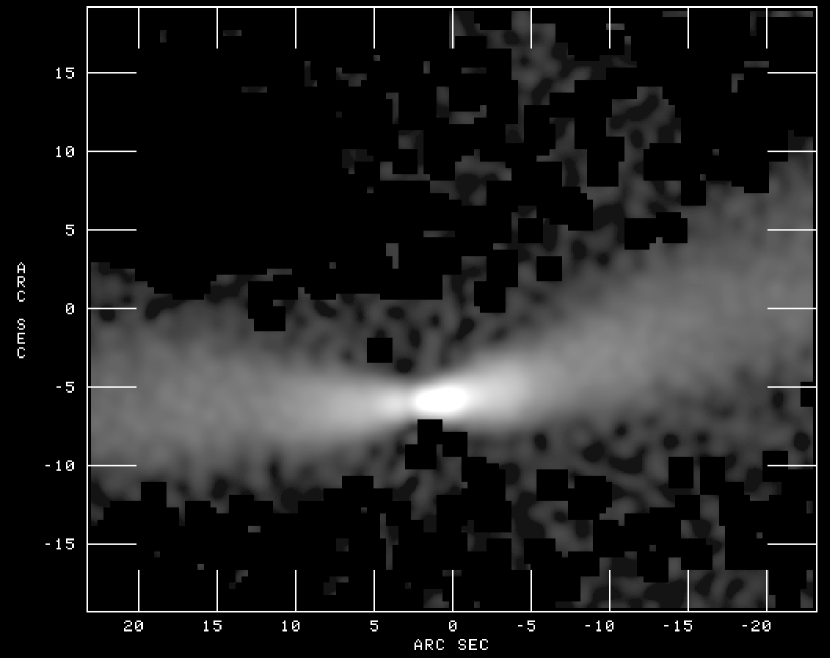
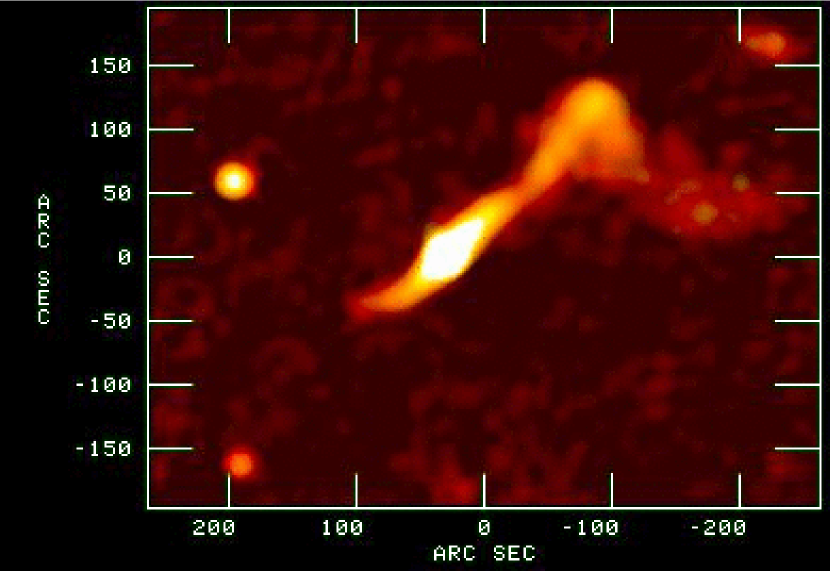
We present observations of three tailed sources (B2 1116+28, B2 1243+26 - itself two sources, and B2 1553+24), one “fat double” (3C386) and one “classical double” (3C98). The tailed sources are common at lower luminosities and are structurally classified as FRIs (Fanaroff & Riley, 1974). For tailed sources, most spectral observations in the literature are confused by the blending of emission from the jets with that of their steeper spectrum surrounding sheaths (Katz-Stone and Rudnick, 1997; Gizani & Leahy, 2003). The tailed sources studied here were chosen from the work of Morganti et al. (1997b) where the change in polarization direction from the inner jets (longitudinal field) to the outer sheaths (transverse) showed that these components could be isolated at reasonable resolutions. 3C98 was chosen as one representative of FRIIs because of its mixture of both high and low surface brightness material and preliminary indications of Inverse Compton X-rays (N. Isobe, private communication). 3C386, a “fat” or “relaxed” double, provides an example where the absence of jets and hot spots probably indicates no current relativistic particle acceleration. Although the images of 1553+24 are shown here, the spectral results were not reliable due to imaging artifacts, and are not included here.
2 Observations and Images
All sources were observed with multiple configurations and frequencies of the Very Large Array (VLA111The Very Large Array is a facility of the National Radio Astronomy Observatory, operated by Associated Universities, Inc., under contract with the National Science Foundation.) between November 1998 and August 2001. Table 1 provides the observational details. Our data were supplemented by archived data at the National Radio Astronomy Observatory (see Table 3). For the new observations of sources 1116+28, 1243+26 and 1553+24, the bandwidth was 50 MHz at all wavelengths. For 3C98 and 3C386, the bandwidth was 3.13 MHz at 90 cm, 25 MHz at 20 cm, and 50 MHz at 6 cm. The bandwidths were consistent for all configurations. While the nominal bandwidth at 90 cm was 3.13 MHz, the effective bandwidth is reduced through the editing process. Except as noted, all observations were taken using two IFs. For 1243+26, one IF at 20 cm in A array was dropped due to poor quality. For 3C98 and 3C386, the two IFs at 20cm provided maps of different qualities, so only one IF was used for each. At 90cm, only one IF was used for mapping. When more than one object was accessible at a given time, cycling snapshot observations between sources were employed to maximize hour angle and related uv-plane coverage.
| B2 1116+28 | Map Freq. (MHz) | 1464.9 | 4860.1 | 8460.1 |
|---|---|---|---|---|
| Dates | Configuration | 20 cm | 6 cm | 3.6 cm |
| Sep 1999 | A | 0.96 | - | - |
| Feb 2000 | B | 0.52 | 0.75 | - |
| May 1984; Apr 1992; Nov/Dec 1998 | C | 0.47 | 0.62 | 1.52 |
| Aug 1992; Apr 1999 | D | - | 0.6 | 0.7 |
| B2 1243+26 | Map Freq. (MHz) | 1410.9 | 4860.1 | 8460.1 |
| Dates | Configuration | 20 cm | 6 cm | 3.6 cm |
| Sep 1999; Jun 1990 | A | 0.99 | 1.29a | - |
| Feb 2000;, Aug 1990 | B | 0.48 | 1.03 | - |
| Dec 1998 / Jan 1999 | C | 0.35 | 0.14 | 2.67 |
| Apr 1999; Dec 1989 & Apr 1999; Apr 1999 | D | 0.20 | 0.99 | 0.5 |
| B2 1553+24 | Map Freq. (MHz) | 1425 | 4860.1 | 8460.1 |
| Dates | Configuration | 20 cm | 6 cm | 3.6 cm |
| Sep 1999 | A | 0.98 | - | - |
| Feb 2000 | B | 0.51 | 1.59 | - |
| Multipleb | C | 1.41 | 0.74 | 3.47 |
| Apr 1999 | D | - | 0.38 | 0.5 |
| 3C98 | Map Freq. (MHz) | 327.45 | 1564.9 | 4860.1 |
| Dates | Configuration | 90 cm | 20 cm | 6 cm |
| Jan 2001 | A | 3.93 | - | - |
| Mar 2001 | B | 2.77 | 1.43 | - |
| Aug 2001 | C | 0.49 | 0.41 | 1.22 |
| Sep 1990 | D | - | 0.33 | 0.57 |
| 3C386 | Map Freq. (MHz) | 327.45 | 1400 | 4860.1 |
| Dates | Configuration | 90 cm | 20 cm | 6 cm |
| Mar 2001 | B | 2.17 | - | - |
| Aug 2001 | C | 1.10 | 0.32 | - |
| Sep 2000 | D | - | 0.24 | 1.79 |
The entries under each wavelength are the integration times in hours.
Single dates apply to all entries on the row. Multiple dates refer to the observations at different frequencies (separated by semicolons) in column order.
a BnA hybrid array.
b All three frequencies were observed in Dec 1998 and Jan 1999; additional observations were taken in Sept 1998 (20cm), Jul 1985 (6cm), and May 2000 (3.6cm).
All maps were created using standard calibration, mapping and self-calibration techniques in common use at the Very Large Array. However, given the significance of the spectral results, we include a more detailed discussion of the flux calibration below. Data were obtained at 74 MHz (4m) and 330 MHz (90cm) in spectral line mode, which facilitated removal of radio frequency interference. Afterward the data were averaged in frequency, with effective bandwidths up to 30% smaller than the nominal bandwidths listed above.
In producing maps for all spectral index determinations, the uv coverage was matched, as well as the restoring convolution beams. The “clean” algorithm (IMAGR in AIPS) was used for all maps except for the 90cm maps of 3C98 and 3C386. In those cases, the maximum entropy routine VTESS was used because it reduced the amount of ’striping’ artifacts in the final maps.
Table 2 contains the basic parameters for these
sources. Throughout this paper we have assumed a flat cosmology and a
Hubble constant of = 75 km/s/Mpc.
| Parameter | 1116+28 | 1243+26 | 1553+24 | 3C98 | 3C386 |
| RA (2000) | 11 18 59.392 | 12 46 21.8210 | 15 56 3.929 | 3 57 54.444 | 18 38 26.285 |
| Dec (2000) | 27 54 7.8 | 26 27 16.4 | 24 26 53.236 | 10 26 2.52 | 17 11 49.392 |
| z | 0.0672a | 0.0872b | 0.0426c | 0.0305d | 0.0170d |
| Major Axis (kpc) | 358 | 711 | 248 | 236 | 99 |
| Integrated (Jy) | - | - | - | 28.9 | 16.4 |
| Integrated (Jy) | 0.44 | 0.32 | 0.19 | 11.1 | 6.3 |
| Integrated (Jy) | 0.19 | 0.15 | 0.13 | 3.45 | 2.55 |
| Integrated (Jy) | 0.11 | 0.11 | 0.11 | - | - |
| Integrated | - | - | - | -0.61 | -0.66 |
| Integrated | -0.69 | -0.62 | -0.31 | -1.03 | -0.73 |
| Integrated | -0.92 | -0.51 | -0.22 | - | - |
| Fit Low Freq. Index | -0.54 0.04 | -0.50 0.04 | - | -0.65 .01 | -0.55 0.02 |
| Chi-squared / d.o.f. | 0.8 | 1 | - | 3.1 | 3.4 |
| Source | Wavelength | Configuration | Observer | Year |
|---|---|---|---|---|
| 1116+28 | 20 cm | C | P. Parma | 1984 |
| 1116+28 | 6 cm | C | P. Parma | 1992 |
| 1116+28 | 6 cm | D | P. Parma | 1992 |
| 1243+26 | 6 cm | BnA | S. Capetti | 1990 |
| 1243+26 | 6 cm | B | S. Capetti | 1990 |
| 1243+26 | 6 cm | D | S. Capetti | 1989 |
| 1553+24 | 6 cm | C | P. Parma | 1985 |
| 1553+24 | 3.6 cm | C | R. Laing | 2000 |
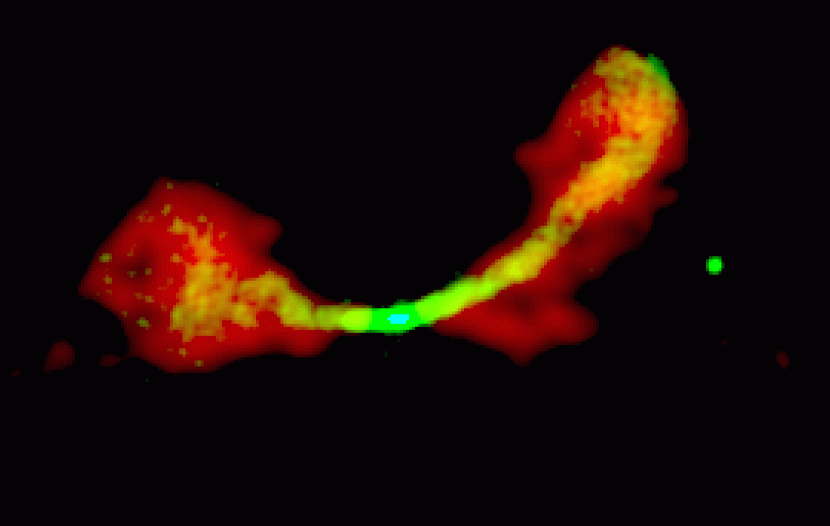
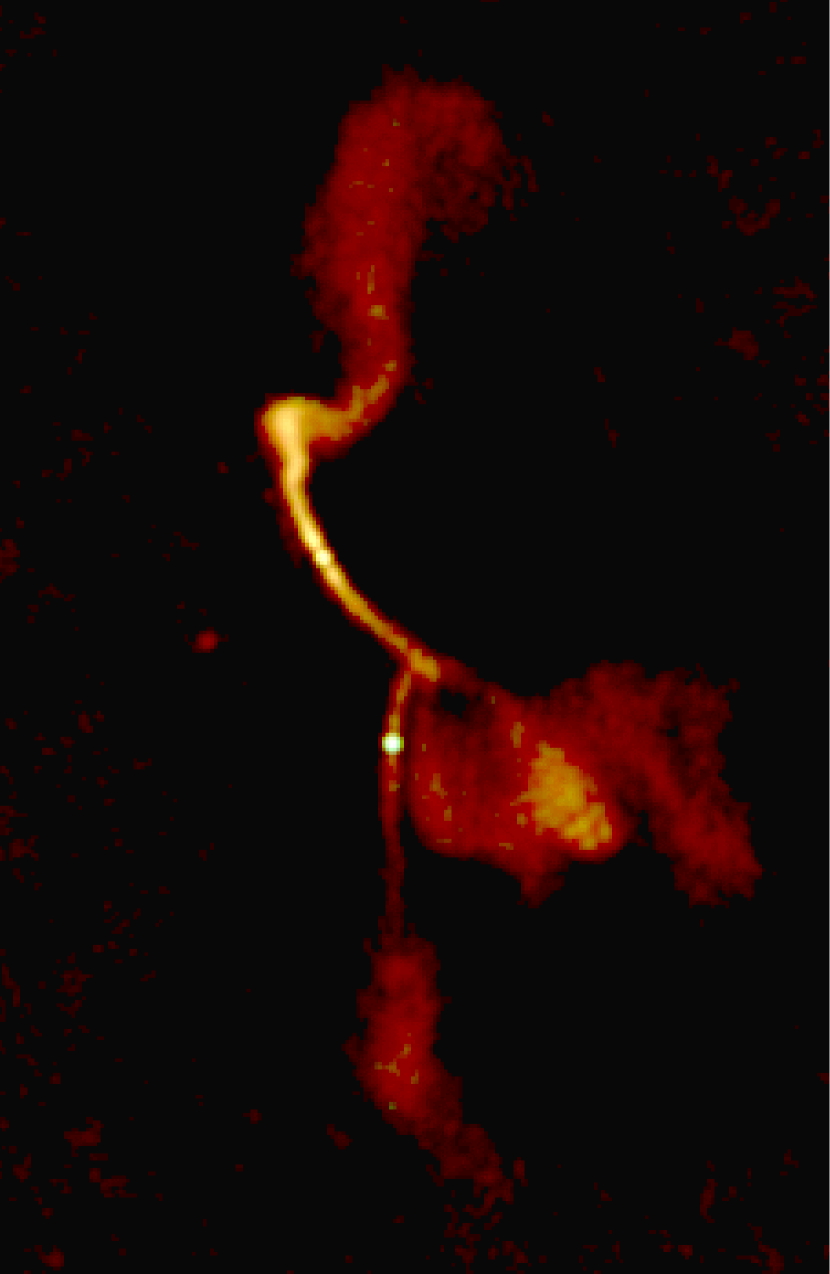
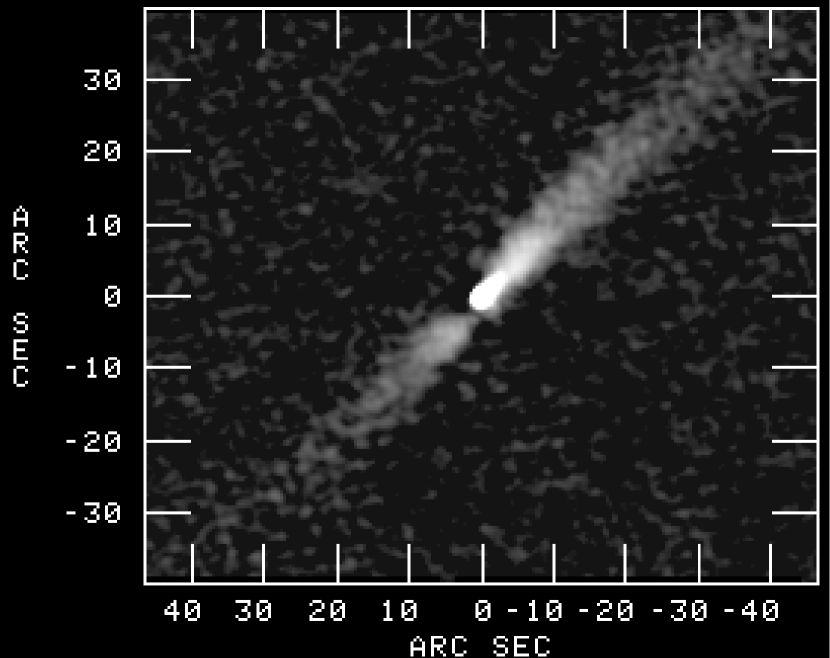
Images of the five sources are presented in Figures 1-10. For the tailed sources, we show both high and low resolution images. Single resolution images of 3C386 and 3C98 are shown along with color images indicating the spectral variations within the sources.
3 Spectral Analysis and Results
Matched maps at three frequencies were used to create pairs of spectral index maps (e.g., and ). The pairs of indices were then sampled to construct color-color diagrams (Katz-Stone, Rudnick & Anderson, 1993), as shown in Figure 11. See Section 1.2 for the description of how color-color diagrams are used to determine the low frequency slopes.
Several quality checking procedures were employed to improve the reliability of the spectral index measurements used here. Maps were first intensity scaled and subtracted in pairs to inspect for small spatial misalignments; several small corrections ( beam size) were made. Scatter plots of intensity at one frequency vs. intensity at the second frequency were inspected to ensure that there was no low-level bias on the images at a level that would contribute spectral errors comparable to those due to the random noise.
For 3C98 and 3C386, the spectral index maps were sampled at one point per independent beam and used to construct the color-color diagrams. Only those points with spectral errors between the low pair of frequencies less than 0.035 were included for 3C98 (less than 0.02 for 3C386). We performed a tomography analysis (Katz-Stone and Rudnick, 1997) to assess the possible confusion from overlapping regions of different spectral indices. In 3C98, there appeared to be only minor confusion (within the errors) for the brighter regions used in the color-color diagrams. The hot spots, for example, completely dominate their locally measured spectral indices and fall in the same region of the color-color diagram as the lower brightness regions.
The situation for 3C386 is more complicated, since there are gentle spectral gradients throughout the lobes, and it is difficult to cleanly isolate distinct spectral components (see Figure 10). Therefore, some blending of spectra is probably occurring; this will broaden the spectral shapes and move the data towards and more parallel to the power law line. Given our fitting procedure with JP shapes, this would have the effect of steepening the inferred low frequency index. However, since the slope of the data in the color-color diagram still closely follows the expected JP slope, it appears that any bias is within the errors.
For 1116+28, 1243+26 and 1553+24, the fluxes in boxes along the jet were used for the spectral measurements. The use of boxes slightly wider than the jets reduced the sensitivity to any residual misalignments between the images. Jet boxes were used only where any possible contamination from overlapping steeper spectrum diffuse emission (as assessed using tomography) would be less than the errors due to random noise. The spectral shape results for 1553+24 appear to be strongly influenced by imaging artifacts and are not presented here. For example, the spectra were dependent on the exact choice of boxes, and for some box choices, even showed concave shapes.
3.1 Sources from the literature
We examined the literature for data matching the criteria for determination of low frequency indices as described above – high resolution spectra with at least three points in the low frequency power law region, matched resolution images at three frequencies suitable for color-color analysis, and asymptotic two point spectra approaching the nucleus. Following is a brief description of the sources so identified and our determination of the low frequency power law. The derived low frequency indices for the literature sources are listed in Table 4.
For two sources, we performed a color-color analysis using published data to determine the low frequency index. Hercules A has recently been mapped by Gizani & Leahy (2003) at three frequencies, and the jet spectra separated from the steeper background using a tomographic analysis. Taking the spectral measurements from their Table 5, we found a best fit of -0.62 0.03 in color-color space (Figure 12). There are several points far from the best fit line, which may indicate residual contributions from steep spectrum material.
Hydra A was observed at 74, 330, and 1415 MHz by Lane et al. (2004). They made no attempt to separate the emission into flatter and steeper components. The spectral indices were read from their Figure 5, and plotted in color-color space in our Figure 12. Note that their errors, which we reflect, correspond to 3, so the deviation from a simple JP shape is quite significant. We therefore fit only the data with spectral indices flatter than -1.3, which yield a low-frequency index of -0.59 0.08. The steeper data could be modeled using a second component with a lower cutoff frequency, but would not add useful information about the low frequency slope.
In a number of cases, spectra corresponding to the low frequency slope had already been identified. These include the jets isolated through a tomography analysis: 1231+674 and 1433+553 Katz-Stone et al. (1999), 3C449 (Katz-Stone and Rudnick, 1997) and 3C130 (Hardcastle, 1999b). In these cases, the two point spectra of the jets asymptote to a constant spectral index as they approach the nucleus. (For 3C449 this behavior is seen between two pairs of frequencies, so the color-color diagram is also useful.)
The spectrum of the inner kpc of 3C264 was measured by Lara et al. (1997) using a least-squares fit to four frequencies, after subtracting the contribution from the flat spectrum core. 3C264 shows a clear one-sided jet, and is noted in Figure 13 as “other FRI” because of its unusual amorphous large-scale emission (Lara et al., 1997). The radio data for M87 at 1.46, 4.89 and 14.96 GHz, are consistent with a power law, which Biretta, Stern & Harris (1991) cite as in their abstract. We have used their data to recalculate the spectra of knots A-I to yield a value of -0.53 0.04.
| Source Name | Spectral Index | Reference |
|---|---|---|
| 1231+674 | -0.55 0.05 | Katz-Stone et al. (1999), Young et al. (2002) |
| 1433+553 | -0.55 0.05 | Katz-Stone et al. (1999),Young et al. (2002) |
| M87 | -0.53 0.04 | Biretta, Stern & Harris (1991) |
| 3C130 | -0.55 0.05 | Hardcastle (1999a) |
| 3C449 | -0.53 0.05 | Katz-Stone and Rudnick (1997) |
| Hydra A | -0.59 0.08 | Lane et al. (2004) |
| Hercules A | -0.62 0.03 | Gizani & Leahy (2003) |
| 3C264 | -0.58 0.03 | Lara et al. (2004) |
Other maps and information about the optical environments of these sources are available in the literature, and starting points for interested readers include: 1116+28 (Morganti et al., 1997a; Parma et al., 1985; Carrillo and Cruz-González, 1997); 1243+26 (Morganti et al., 1997a; González-Serrano et al., 1993; Colina and de Juan, 1995; González-Serrano et al., 1994); 1553+24 (Morganti et al., 1997a; Stocke and Burns, 1987; Parma et al., 2003; Canvin & Laing, 2004); 3C98 (Aretxaga et al., 2001; Leahy et al., 1997; Miller et al., 2002); 3C98 (Leahy, 1991; Baum & McCarthy, 2000; Freudling et al., 2003); 3C386 (Miller et al., 2002; Simpson et al., 1996)
3.2 Flux calibration
The low frequency index of FRIs appears to have a characteristic value of -0.55, and not the limiting -0.50 test particle case. Given the scientific implications of this difference, we present a brief discussion of calibration issues to assess its reliability.
Following the standard flux calibration procedures at the Very Large Array, we included observations of “primary” calibrators in each observing session. The fluxes of these calibrators are monitored every few years and normalized to 3C295, with its value set to the Baars et al. (1977) scale, for frequencies between 327 MHz and 15 GHz (VLA Calibration Manual, 2004). The uncertainties of the primary calibrator fluxes determined by Baars et al. (1977) at each frequency are no more than , and our best estimate of the final uncertainties in the VLA flux scale at each frequency are thus less than . This is a potentially important systematic effect; if 3C295 were incorrect at the level at one frequency, this would lead to a spectral index error of 0.05 when the second frequency is a factor of three away. Ultimately, the quite difficult task of doing an absolute recalibration at better than the few percent level would be needed to resolve this issue.
In the meantime, we have another indicator that the flux scale accuracy is sufficient to distinguish between -0.55 and -0.50, viz., the observed power law spectra of Cassiopeia A. The original Baars et al. (1977) work was designed to measure the integrated spectrum of Cas A, and they show that it is a power law, with a mean error in scale of between 300 MHz and 30 GHz. In another program, we have also been making careful spectral index maps of Cas A using the VLA. We find that there is a narrow, but very well-defined range of spectral indices across the remnant (Anderson et al., 1991; Anderson & Rudnick, 1996). Our more recent work (Bowden et al., 2005) extends these studies to longer wavelengths. We find that the spectra at different locations in Cas A are each well-described by power laws between wavelengths of 90, 20, and 6cm, and extending to 4m in locations where absorption is not important. Below, we describe the procedures leading to this result, and its significance for the accuracy of the flux scales.
We followed the standard flux calibration procedures for Cas A, except that an additional correction is required at 90cm because of the saturation of the digital samplers due to the high correlated fluxes at short baselines. We determined the amplitude of this “Van Vleck” correction (van Vleck & Middleton, 1966) to be by measuring the change in total flux on the images when the short baseline data were removed. Applying this correction to the 90cm data, we found that the data were consistent within the errors with for the remnant’s exterior, while (i.e. flatter at long wavelengths) for the interior, where absorption is important (Kassim et al., 1995). This gives some confidence that the flux scales are correct, but is based on the assumption, for example, that there is no absorption for the exterior regions of the remnant.
Much tighter constraints are seen when we compare the spectral indices between 90, 20, and 6cm. We find local power laws (i.e., ) ranging from -0.82 to -0.73 at 240 independent locations. We find that had a mean of 0.0006 with an rms scatter per point of 0.014. To understand the significance of this, suppose that the flux scale at wavelength is incorrect by some factor . Then the error in spectral index between and , is given by:
Since we observe that , this implies that
It is thus possible that our flux scales are all incorrect, but that the correction factors fortuitously preserve power laws between 90, 20 and 6cm. It seems more likely that each of the flux scales is correct, yielding spectral indices accurate to within 2%, and thus enabling us to distinguish between -0.50 and -0.55.
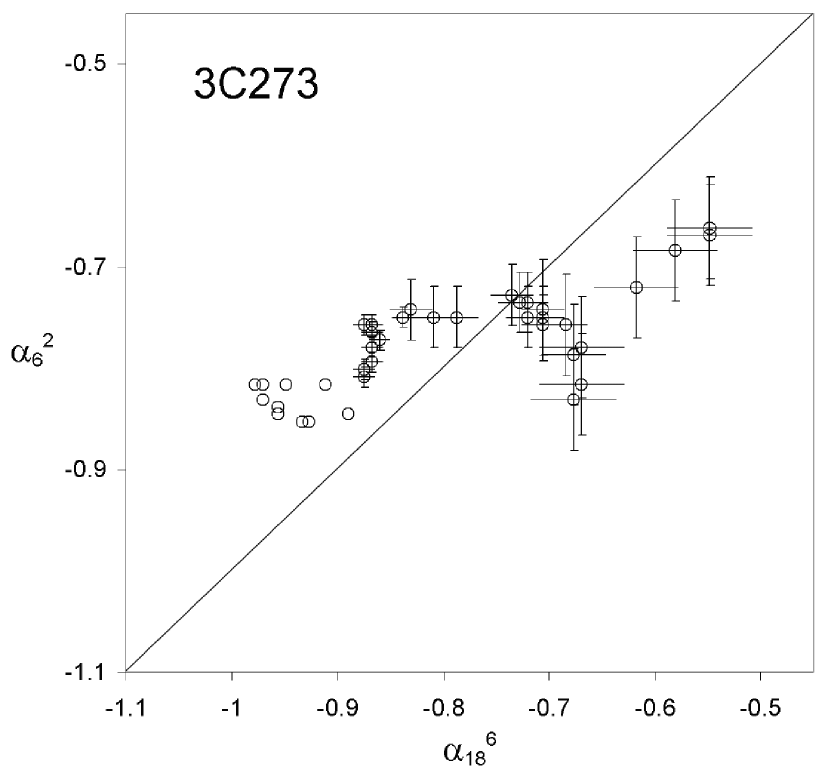
3.3 Other jet spectra
A number of additional sources had some multi-frequency data available, but were not included in our summary, due to a variety of different problems. The well-studied radio jet in 3C273, for example, has matched multi-frequency measurements (Conway et al., 1993) but can not be described in terms of a single electron population, as can be seen in Figure 14. The points above the power-law line (where ) represent places in the spectrum with concave curvature, i.e., flatter at higher frequencies. This would result, e.g., from a combination of two different power law spectra. Multiple components are also suggested by the radio, (Conway et al., 1993), UV and X-ray measurements of 3C273 by Jester et al. (2001).
Extensive multi-frequency data are also available for the tailed radio galaxy 3C31 (Laing and Bridle, 2002, 2004), who suggested an approximate spectral index of -0.55 for the jets. Based on fits from 1.4 GHz to 8.4 GHz at 1.5 arcsecond resolution, the regions close to the nucleus in the North (South) show power laws of -0.59 (-0.60) respectively (R. Laing and A. Bridle, private communication). Further from the nucleus, the spectra retain a power law shape, but with generally steeper spectra. Therefore, the steepening along these jets is not simply due to synchrotron losses from a homogeneous electron distribution, which would show curved spectra, and so a unique low frequency slope cannot be derived.
The presence of multiple and distinct power laws can arise in two ways. First, it could represent the low energy spectral slope from different acceleration conditions at different positions along the jets/tails. Second, power laws over less than a decade in frequency can result from a mixture of different magnetic fields and/or losses within the integration region. Given the clear presence of a spine/sheath structure Laing (1994), or, more generally, a non-uniform transverse velocity profile (Laing and Bridle, 2002) the mixture scenario is more likely. Again, in this case, it is not yet possible to isolate a unique low frequency slope.
Other examples of ambiguous spectral shapes include 3C66B, where Hardcastle et al. (1996) describe the inner jet spectra ranging from -0.5 to -0.6, while Hardcastle, Birkinshaw & Worrall (2001) cite much steeper spectral indices for Knot A. Three frequency data at a common resolution have not been published for this source, and would be especially useful because of the infrared and X-ray emission from the jet (Tansley et al., 2000; Hardcastle, Birkinshaw & Worrall, 2001). The BL Lac object PKS 0521-365 has three-frequency radio data with a spectral index of -0.6 (Birkinshaw, Worrall & Hardcastle, 2002), but the authors suggest that this is contaminated by surrounding steeper spectrum emission.
Of the three tailed sources studied here, only 1553+24 has a detected optical jet (Parma et al., 2003). For the brightest knot, -0.67. Radio-optical spectral indices are generally not useful for examining the low-energy slope of the electron distribution, since they can be easily dominated by radiative losses and possible later acceleration processes (Parma et al., 2003). These problems are even more severe for electrons radiating in X-rays. M87 illustrates the confusion from losses and reacceleration. Its average is -0.53, while the average is -0.67, and using optical measurements alone, = -0.9 Perlman et al. (2001). This steepening is not simply related to radiative losses, because there is a poor correlation between and , and flattens and steepens all along the jet. Perlman et al. (2001) believe that the variations are evidence of ongoing particle acceleration at the brightest points in the jet.
A 1 kpc optical jet has also been found in 3C264 (NGC3862, Baum et al. (1997); Lara et al. (1997)). varies only slightly along the jet, although the overall spectrum steepens dramatically from to (Lara et al., 1999). They suggest that local reacceleration of relativistic electrons along the jet may be responsible. No low frequency index can currently be identified.
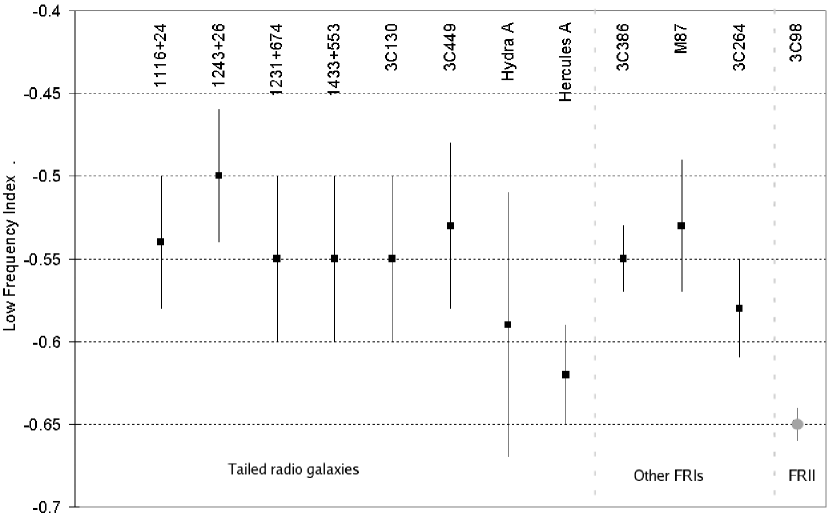
3.4 Summary of low frequency spectra
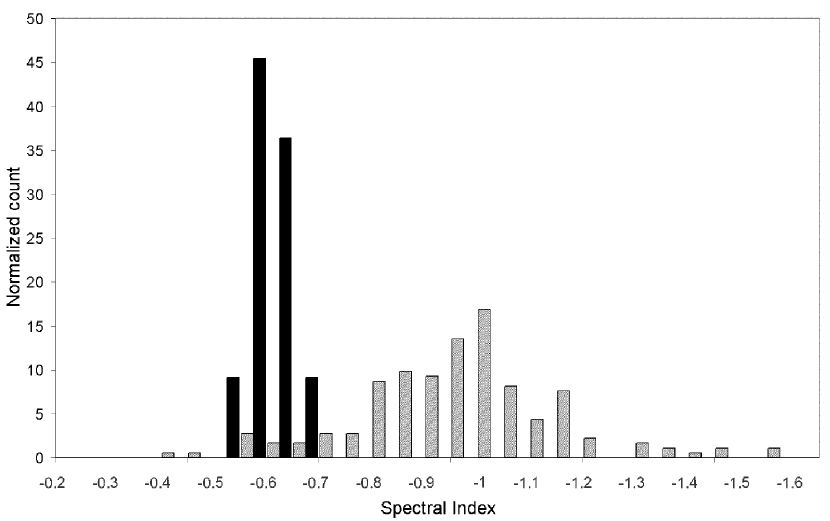
The low frequency spectra currently available are summarized in Figure 13 with our best estimates of their errors. Almost all of the FRIs are consistent with a low frequency value of -0.55. This is seen in sharp distinction to the distribution of integrated spectral indices for sources from the B2.3 catalog (Kulkarni & Mantovani, 1985a), as shown in Figure 15. The latter have a median value of , which varies slightly with flux density (Kulkarni & Mantovani, 1985b) and a very broad spread. These integrated spectral indices depend on the long-term history of particle injection, reacceleration and the losses in magnetic fields of varying strength, as well as the current distribution of magnetic fields strengths, which broadens the spectral shape. The narrow range of low frequency indices suggests a canonical acceleration process, at least for the existing small sample of FRIs.
It is important that these results be confirmed using a larger sample. Partial data exist for a number of sources, and matched resolution observations at other frequencies are practical. Such sources include well-known tailed radio galaxies such as NGC1265 (O’Dea & Owen, 1986), 3C465 (Eilek & Owen, 2002), and 3C129 (Taylor et al., 2001). In addition, there are a number of other sources accessible to current instruments that could be selected from published works (e.g., J0448-2025 in Abell 514, Govoni et al. (2001), and NGC326 at 1” resolution, Murgia et al. (2001)). We note, however, that great care must be done in the analysis to remove subtle artifacts and especially to isolate overlapping spectral components, as discussed earlier. In addition, even with careful work, some of these may not yield a single well-defined low frequency index, such as 3C31 and 3C66B, as discussed above.
3.5 A note regarding FRIIs
The results on 3C98, the sole FRII in our sample, show the steepest apparent low frequency synchrotron slope of -0.65 0.01 (energy index of -2.3 0.02). Its small range in observed spectral indices, far from the power law line, leaves open the possibility of a more complicated spectral shape than modeled here. This can only be determined with lower frequency measurements. If we assume a simple spectral shape, we find that each hot spot shows two-point spectra steeper than the inferred low frequency index. At the same time, the spectral curvatures of the hot spots are consistent with a single electron population for both them and the lobes. This poses a dilemma for the northern hot spot, which has steeper two point spectra than the lobes (at the lower end of the color-color distribution). If, as commonly assumed, the lobes are populated by electrons that have passed through the hot spot region, then adiabatic and radiative losses should steepen the spectra in the lobes. In addition, any reduction in magnetic field strength into the lobes implies that we are observing higher energy electrons at a fixed frequency, which should show steeper spectra. It is thus not clear how the northern hot spot and lobe electron populations are related.
The limited data on other hot spot spectral shapes also presents a confusing picture. The spectra of Cygnus A’s hot spots show curvature at the low end, so there is no clear low energy power law slope (Carilli et al., 1991; Katz-Stone, Rudnick & Anderson, 1993). As another example, 3C295’s hot spots have power-law spectral indices of -1.0 and -0.89 (Taylor and Perley, 1992). However, it is not possible to connect these with the rest of the source spectra because of the combination of free-free absorption and radiative losses. Unpublished work by Grundstrom et al. (2001), using data from Blundell and Rawlings (2000) yields inferred low frequency indices of -0.85 for 3C356, no suitable fit for steep spectrum hot spots in 3C171, and an index of -0.5 for one hot spot in 3C172. Hot spot spectra probably result from both acceleration and high losses (Meisenheimer et al., 1989). In addition, a range of spectral indices is probably produced through acceleration in the ’shock web’ discussed by Tregillis, Jones & Ryu (2001), instead of a simple jet terminal shock.
Other multi-frequency data on jets in FRII sources, which are less prominent than the FRI jets, are rare and difficult to disentangle from the surrounding emission. In the studies of 3C401 by Treichel et al. (2001), the south jet maintains a constant two-frequency spectral index of -0.55, while the north jet varies from -0.4 to -0.9. The south jet of 3C438 also varies from -0.5 to -0.8. From the work of Schilizzi et al. (2001), the jet of 3C326 varies from -0.5 to -1.5.
4 Discussion
As introduced earlier, the need for (re-) acceleration on kpc scales is well-established from observations of X-ray synchrotron jets. The key result presented here is that the low frequency indices of FRI jets appear to have a fairly narrow distribution around a value of -0.55. In particular, the average value appears to be steeper than the -0.50 test particle strong shock limit for diffusive shock acceleration in non-relativistic shocks. The challenge, then, is to find an acceleration process that is robust to differences in physical conditions in different sources and that yields synchrotron spectra (energy index) slopes of -0.55(-2.1).
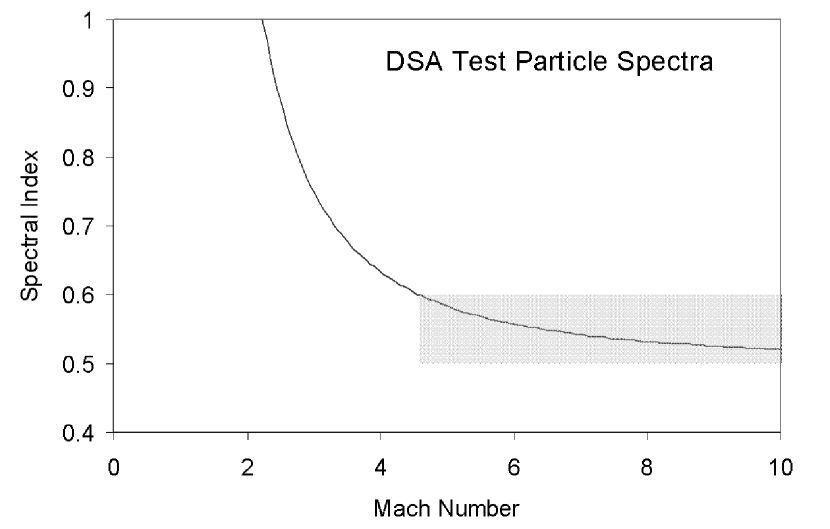
Non-relativistic diffusive shock acceleration alone, with low Mach numbers to generate the steeper spectral indices, is not an attractive option. To produce spectra with requires a distribution that can extend to high Mach numbers, but must cut off sharply below 4.5 (see Figure 16). There is no obvious reason why this cutoff should exist.
Ultra-relativistic shocks provide one mechanism for producing steeper spectra from diffusive shock acceleration. Achterberg et al. (2001) describe simulations and semi-analytic calculations that show a ‘nearly universal’ slope to the momentum distribution of -2.2 to -2.3, equivalent to spectral indices of -0.6 to -0.65. For the trans-relativistic case explored by the Monte Carlo calculations of Ellison & Double (2002), the equivalent spectral index is , as long as the scattering is sufficiently ’fine’. Although this looks very promising, these results apply only to the case of flows parallel to the shock normal. Oblique shocks produce spectra that asymptote to this value, but can be much steeper depending on the obliquity angle and the scattering parameters (Ellison & Double, 2004).
Modification of the shocks by the back pressure of accelerated cosmic rays provides another mechanism for steepening the low-energy spectra (Ellison & Reynolds, 1991; Malkov & Drury, 2001; Ellison & Double, 2002). The resulting spectra are concave, although the curvature is small enough that at low energies they mimic a power-law over ranges of order 10 in energy. Outside of the acceleration region, radiative losses would become important. The small curvature at the low frequency end would be hard to detect in the color-color diagram, and we would fit the data with standard JP spectra with low-frequency power laws. Subshock Mach numbers are typically around 3, yielding synchrotron slopes of -0.7, steeper than observed. One possibility deserving further exploration is the ’self-regulating’ mechanism discussed by Gieseler, Jones & Kang (2000), which operates through the amount of ’injection’ into the relativistic particle population. This injection is very sensitive to the high energy tail of the thermal distribution of electrons, but the more particles removed from the tail (strengthening the modification), the lower the temperature of the thermal distribution (lowering the injection). Of course, mechanisms other than diffusive shock acceleration might be the important ones, as mentioned in the Introduction. A discussion of these is beyond the scope of this paper.
Assuming that there is a common low frequency index of -0.55 for FRI radio galaxies, where might it arise? One possibility is that it represents the initial acceleration of particles in the jet as they emerge from the nucleus. This runs into serious difficulties for Hydra A, for example. On pc scales its jet has an integrated spectrum that peaks around 5 GHz, probably because of free-free absorption at low frequencies (Taylor, 1996). The optically thin part of the spectrum has a slope of . A power law this steep is inconsistent with the flattest points observed at arcsec scales (Figure 12), and so particle reacceleration is necessary. This situation is exacerbated by the much weaker magnetic fields on kpc, as opposed to pc scales, as inferred from minimum energy calculations. Lower magnetic fields require higher energy relativistic particles to produce the observed GHz emission, so if anything, the kpc scale emission should be much steeper. Other support for in situ acceleration comes from energetic or dynamical arguments (Eilek, 1996; Sijbring & de Bruyn, 1998). Thus, reacceleration on kpc scales seems unavoidable.
Spectra on pc scales for the other sources presented here are not available. However, Compact Symmetric Objects like 2352+495, which are currently thought to be young precursors of larger objects (FRIs?, FRIIs?) also illustrate the reacceleration challenge. Its lobes have spectral indices of -1.0 in the 5-10 GHz range (Readhead et al., 1996), under conditions of strong minimum energy fields (5mG). Nearby BL Lac objects such as Markarian 501 suggest that steep spectra are also found in pc scale jets, at least outside of the brightness enhancements.
One possible site for particle reacceleration for FRIs is where the jets flare and dramatically brighten away from the nucleus. The pre-brightening regions were historically referred to as “gaps” (Miley, 1980); they are clearly visible, e.g., in 3C449 (see Figure 1 in Katz-Stone and Rudnick (1997)). Measurements at higher resolution and frequency show that these gap regions actually contain faint emission (e.g., again for 3C449, see Figure 6 in Feretti et al. (1999)). The flaring and brightening have been long suggested to arise from entrainment of external material coupled with the rapid deceleration of the jet, perhaps from relativistic speeds (DeYoung, 1993; Bicknell, 1995; Bowman, Leahy & Komissarov, 1996). In their re-analysis of 3C31 Laing and Bridle (2004) conclude that adiabatic models of the deceleration produce too steep of a decline in brightness along the jets, and that the distributed injection of relativistic particles would provide a remedy. The presence of decelerating relativistic jets and the need for non-adiabatic inputs is also inferred for two other low-luminosity jets, B2 0326+39 and B2 1553+24 (one of the sources studied here) by Canvin & Laing (2004).
Two future investigations could test whether the relativistic electron populations are regulated by particle acceleration in regions where entrainment, deceleration, and flaring of FRI jets occurs. From an observational standpoint, the low frequency index of emission in the fainter inner jet (gap) regions needs to be measured. If it were steeper than the canonical -0.55 that we have found, this would provide strong support for particle (re)acceleration. Theoretically, we need to know whether the population of shocks and turbulence expected in the flaring region would statistically result in a narrow range of indices around -0.55. Manolakou, Anastasiadis & Vlahos (1999) investigate the effects of acceleration in the turbulent eddies and shocks of jets, both for second-order Fermi and shock-drift processes. They conclude that the emergent energy distributions closely reflect the initial ones, so that the special -0.55 value would still need to be explained. Models involving shear, as opposed to shocks, have also been explored (Jokipii & Morfill, 1990; Stawarz and Ostrowski, 2002; Rieger & Duffy, 2004) as well as models producing acceleration through magnetic reconnection (Lesch and Birk, 1998).
Since FRII jets do not undergo the rapid flaring seen in FRIs (which is why they can produce compact hot spots far downstream), the above type of particle acceleration would not be expected. Acceleration in the relativistic portions of the jets (Stawarz et al., 2004) and/or in the hot spot regions (Manolakou & Kirk, 2002; Brunetti et al., 2003) would then dominate, and presumably lead to different spectral behaviors. Particle acceleration in these locations is necessary, in any case, to explain the very short lived emission seen at optical and X-ray wavelengths.
5 Conclusions
A canonical low frequency spectral slope of -0.55 is found in the small existing sample of FRI radio galaxies with suitable data. If confirmed in larger samples, this would indicate a common acceleration mechanism for the relativistic particles that likely occurs outside of the nuclear regions. One possible site for such acceleration is the brightening and flaring region on kpc scales, where entrainment may be decelerating the jets. The specific acceleration mechanism cannot yet be identified. The behavior of FRIs appears to be different than the particle acceleration found in FRII jets and hot spots, although more work in this area is needed.
References
- Achterberg et al. (2001) Achterberg, A., Gallant, Y. A., Kirk, J. G. & Guthmann, A. W. 2001, MNRAS, 328, 393
- Aharonian (2002) Aharonian, F. A. 2002, MNRAS, 332, 215
- Alexander (1987) Alexander, P. 1987, MNRAS 225, 27
- Alexander, Brown & Scott (1984) Alexander, P., Brown, M. T. & Scott, P. F. 1984, MNRAS 209, 851
- Anderson et al. (1991) Anderson, M. C., Rudnick, L., Leppik, P., Perley, R. & Braun, R. 1991, ApJ 373, 146
- Anderson & Rudnick (1996) Anderson, M. C. & Rudnick, L. 1996, ApJ 456, 234
- Aretxaga et al. (2001) Aretxaga, I., Terlevich, E., Terlevich, R. J., Cotter, G., & Ángeles I. Díaz 2001, MNRAS, 325, 636
- Baars et al. (1977) Baars, J. W. M., Genzel, R., Pauliny-Toth, I. I. K., & Witzel, A. 1977, A&Ap, 61 99
- Baring & Kirk (1991) Baring, M. G. & Kirk, J. G. 1991, A&A 241, 329
- Barton, De Carvalho & Geller (1998) Barton, E., De Carvalho, R. R. & Geller, M. 1998, AJ 116, 1573
- Baum et al. (1997) Baum, S., O’Dea, C., Giovannini, G., Cotton, W. B., de Koff, S., Feretti, L., Golumbek, D., Laral, L, Machettto, F. Miley, G.K., Sparkes, W., Venturi, T. & Komissarov, S. S. 1997, ApJ, 483, 178
- Baum & McCarthy (2000) Baum, S. A. & McCarthy, P. J. 2000, AJ 119, 2634
- Bicknell (1995) Bicknell, G. V. 1995, ApJS, 101, 29
- Biretta, Stern & Harris (1991) Biretta, J. A., Stern, C. P., & Harris, D. E., 1991, AJ, 101, 1632
- Birkinshaw, Worrall & Hardcastle (2002) Birkinshaw, M., Worrall, D. & Hardcastle, M. 2002, MNRAS 335, 142
- Blandford & Eichler (1987) Blandford, R. & Eichler, D. 1987, Ph.Rep. 154, 1
- Blundell and Rawlings (2000) Blundell, K. M. & Rawlings, S. 2000, AJ, 119, 1111
- Bowden et al. (2005) Bowden, J., DeLaney, T., Rudnick, L. et al. 2005, in preparation
- Bowman, Leahy & Komissarov (1996) Bowman, M., Leahy, J. P., & Komissarov, S. S. 1996, MNRAS 279, 899
- Brunetti et al. (2003) Brunetti, G., Mach, K.-H., Prieto, M. A. & Varano, S. 2003, MNRAS, 345, L40
- Canvin & Laing (2004) Canvin, J. R. & Laing, R. A. 2004, MNRAS, 350, 1342
- Carilli et al. (1991) Carilli, C. I., Perley, R. A., Dreher, J. W., & Leahy, J. P. 1991, ApJ, 383, 554
- Carrillo and Cruz-González (1997) Carrillo, R. & Cruz-González, I. 1997, 33, 31
- Cohen et al. (1977) Cohen, M. H., et al., 1977, Nature, 268, 405
- Colina and de Juan (1995) Colina, L. & de Juan, L. 1995, ApJ, 448, 548
- Condon et al. (1998) Condon, J. J., Cotton, W. D., Greisen, E. W., Yin, Q. F., Perley, R. A.; Taylor, G. B., & Broderick, J. J. 1998, AJ 115, 1693 (NVSS)
- Conway et al. (1993) Conway, R. G., Garrington, S. T., Perley, R. A. & Biretta, J. A. 1993, AAp, 267, 347.
- de Vaucoleurs et al. (1991) de Vaucoleurs, G. et al. 1991, Third Reference Catalog of Bright Galaxies, Version 3.xxx
- DeYoung (1993) DeYoung, D. S. 1993, ApJ, 405, L13
- Drury (1989) Drury, L. O’C., Hot Spots in Extragalactic Radio Sources, K. Meisenheimer, H.-J. Röser Berlin: Springer-Verlag 1989, 231
- Eilek (1996) Eilek, J. A. 1996, IAU Symposium 175, 483
- Eilek and Hughes (1991) Eilek, J. A. and Hughes, P. A., Beams and Jets in Astrophysics, P. A. Hughes, Cambridge: Cambridge University Press, 1991, 428
- Eilek & Owen (2002) Eilek, J. A. & Owen, F. N. 2002, ApJ 567, 202
- Ellison & Double (2002) Ellison, D. C. & Double, G. P, 2002, APh., 18, 213
- Ellison & Double (2004) Ellison, D. C. & Double, G. P, 2004, APh., 22, 323
- Ellison & Reynolds (1991) Ellison, D. C. & Reynolds, S. P. 1991, ApJ 382, 242
- Fanaroff & Riley (1974) Fanaroff, B. L. and Riley, J. M. 1974, MNRAS 167, 31
- Feigelson et al. (1995) Feigelson, E. D., Laurent-Muehleisen, S. A., Kollgaard, R. I, & Fomalont, E. B. 1995, ApJ 449, 149
- Feretti et al. (1999) Feretti, L., Perley, R., Giovannini, G., & Andernach, H. 1999, A&A 341, 29
- Fermi (1949) Fermi, E. 1949, Phys. Rev., 75, 1169
- Freudling et al. (2003) Freudling, W., Siebenmorgen, R. & Haas, M., 2003, ApJ 599, L13
- Gieseler, Jones & Kang (2000) Gieseler, U., Jones, T. W., Kang, H. 2000, A&A 364, 911
- Gizani & Leahy (2003) Gizani, N. & Leahy, J. P. 2003, MNRAS 342, 399
- González-Serrano et al. (1993) González-Serrano, J. I., Carballo, R., & Pérez-Fournon, I. 1993, AJ, 105, 1710
- González-Serrano et al. (1994) González-Serrano, J. I., Pérez-Fournon, I., & Morganti, R. 1994, MNRAS, 267, 424
- Gopal-Krishna et al. (2001) Gopal-Krishna, Subramanian, P., Wiita, P. J, and Becker, P. A. 2001, A&A, 377, 827
- Govoni et al. (2001) Govoni, F., Taylor, G. B., Dallacasa, D., Feretti, L., & Giovannini, G. 2001, A&A 379, 807
- Grundstrom et al. (2001) Grundstrom, E., Rudnick, L., & Blundell, K. 2001, Bull. American Astron. Soc., 199, 5107
- Hardcastle (1999a) Hardcastle, M. J. 1999a, MNRAS, 298, 569
- Hardcastle (1999b) Hardcastle, M., 1999b, A&A, 349, 381
- Hardcastle et al. (1996) Hardcastle, M. J., Alexander, P., Pooley, G. G., & Riley, J. M. 1996, MNRAS, 278, 273
- Hardcastle, Birkinshaw & Worrall (2001) Hardcastle, M., Birkinshaw, M, & Worrall, D. M., 2001, MNRAS, 326, 1499
- Harris & Grindlay (1979) Harris, D. E. & Grindlay, J. E. 1979, MNRAS 188, 25
- Jaffe & Perola (1973) Jaffe, W. J. & Perola, G. C. 1973, A&A 26, 423
- Jester et al. (2001) Jester, S., Röser, H.-J., Meisenheimer, K., Perley, R., & Conway, R. 2001, A&A, 373, 447
- Jokipii & Morfill (1990) Jokipii, R. & Morfill, C. E. 1990, ApJ 356, 255
- Jones, O’Dell & Stein (1974) Jones, T. W., O’Dell, S. L. & Stein, W. A., 1974, ApJ 192, 261
- Kaneda et al. (1995) Kaneda, H., Tashiro, M., Ikebe, Y., Ishisaki, Y., Kubo, H., Makishima, K., Ohashi, T., Saito, Y., Tabara, H. & Takahashi, T., 1995, ApJ 453, 13
- Karachentsev & Kopalov (1990) Karachentsev, I. D. & Kopalov, A. I., 1990, MNRAS 243, 390
- Kardashev (1962) Kardashev, N. S. 1962, Sov.Astron.–AJ 6, 317
- Kassim et al. (1995) Kassim, N. E., Perley, R. A., Dwarakanath, K. S. & Erickson, W. C. 1995, ApJ 455, L59
- Katz-Stone and Rudnick (1997) Katz-Stone, D. M. & Rudnick, L. 1997, ApJ, 488, 146
- Katz-Stone, Rudnick & Anderson (1993) Katz-Stone, D. M., Rudnick, L., & Anderson, M. C. 1993, ApJ, 407, 549
- Katz-Stone et al. (1999) Katz-Stone, D. M., Rudnick, L., Butenhoff, C., & O’Donoghue, A. A. 1999, ApJ, 516, 716
- Kirk (1989) Kirk, J. G. 1989, in Hot Spots in Extragalactic Radio Sources, ed. K. Meisenheimer & H.-J. Röser, (Berlin: Springer-Verlag), 241
- Kraft et al. (2005) Kraft, R. P., Hardcastle, M. Y., Worrall, D. M. & Murray, S. S. 2005, astro-ph/0501031
- Kulkarni & Mantovani (1985a) Kulkarni, V. K., & Mantovani, F. 1985a, A&ApSS 61, 1
- Kulkarni & Mantovani (1985b) Kulkarni, V. K., & Mantovani, F. 1985b, A&Ap 153, 13
- Laing (1994) Laing, R. A. 1994, in The First Stromlo Symposium: The Physics of Active Galaxies, (eds. G. V. Bicknell, M. A. Dopita & P. J. Quinn), ASP Conf. Series 54, 227
- Laing and Bridle (2002) Laing, R. A. & Bridle, A. H. 2002, MNRAS, 336, 1161
- Laing and Bridle (2004) Laing, R. A. & Bridle, A. H. 2004, MNRAS, 348 1459
- Lane et al. (2004) Lane, W., Clarke, T. E., Taylor, G. B., Perley, R. A. & Kassim, N. E., 2004, AJ, 127, 48
- Lara et al. (1997) Lara, L., Cotton, W. D., Feretti, L., Giovannini, G., Venturi, T., & Marcaide, J. M. 1997, ApJ, 474, 179
- Lara et al. (1999) Lara, L., Feretti, L., Giovannini, G., Baum, S., Cotton, W. D., O’Dea, C. P., & Venturi, T. 1999, ApJ 513, 197
- Lara et al. (2004) Lara, L., Giovannini, G., Cotton, W. D., Feretti, L.,, & Venturi, T., 2004, A&A 415, 905
- Leahy (1991) Leahy, J. P. 1991, In Beams and Jets in Astrophysics, ed. P. A. Hughes, (Cambridge: Cambridge University Press), 100–186
- Leahy et al. (1997) Leahy, J. P., Black, A. R., Dennett-Thorpe, J., Hardcastle, M. J., Komissarov, S., Perley, R., Riley, J. M., & Scheuer, P. A. G. 1997, MNRAS, 291, 20
- Lesch and Birk (1998) Lesch, H. & Birk, G. T. 1998, ApJ, 499, 167
- Litvinenko (1999) Litvinenko, Y. E. 1999, A&A, 349, 685
- Malkov & Drury (2001) Malkov, M., A., & Drury, L. O’C. 2001, Rep. Prog. Phys. 64, 429
- Manolakou, Anastasiadis & Vlahos (1999) Manolakou, K., Anastasiadis, A. & Vlahos, L., 1999, A&A 345, 653
- Manolakou & Kirk (2002) Manolakou, K. & Kirk, J. G. 2002, A&A 391, 127
- Meisenheimer et al. (1989) Meisenheimer, K., Röser, H.-J., Hiltner, P. R., Yates, M. G., Longair, M. S., Chini, R., & Perley, R. A. 1989, A&A, 219, 63
- Miley (1980) Miley, G. K. 1980, ARAA 18, 165
- Miller et al. (1999) Miller, N. A., Owen, F. N., Burns, J. O., Ledlow, M. J., & Voges, W. 1999, ApJ, 118, 1988
- Miller et al. (2002) Miller, N. A., Ledlow, M. J., Owen, F. N., & Hill, J. M. 2002, AJ, 123, 3018
- Morganti et al. (1997a) Morganti, R., Parma, P., Capetti, A., Fanti, R., & de Ruiter, H. 1997a, A&A, 326, 919
- Morganti et al. (1997b) Morganti, R., Parma, P., Capetti, A., Fanti, R., de Ruiter, H., & Prandoni, I. 1997b, A&AS, 126, 335
- Murgia et al. (2001) Murgia, M., Parma, P., de Ruiter, H. R., Bondi, M., Ekers, R. D., Fanti, R. & Fomalont, E. B. 2001, A&A 380, 102
- O’Dea & Owen (1986) O’Dea, C. P. & Owen, F. N. 1986, ApJ 301, 841
- Ostrowski & Schlickeiser (1993) Ostrowski, M. & Schlickeiser, R. 1993, A&A 268, 812
- Owen & Ledlow (1994) Owen, F. & Ledlow, M. 1994, in The First Stromlo Symposium: The Physics of Active Galaxies, eds. G. V. Bicknell, M. A. Dopita & P. J. Quinn, ASP Conference Series 54, 319.
- Pacholczyk (1970) Pacholczyk, A. G. 1970, Radio Astrophysics (San Francisco: Freeman)
- Parma et al. (1985) Parma, P., Ekers, R., & Fanti, R. 1985, Astr. Astrophys. Suppl. Ser., 59, 511
- Parma et al. (2003) Parma, P., de Ruiter, H. R., Capetti, A., Fanti, R., Morganti, R., Bondi, M., Laing, R. A., & Canvin, J. R. 2003, A&A, 397, 127
- Perlman et al. (2001) Perlman, E. S., Biretta, J. A., Sparks, W. B., Macchetto, Duccio, F. & Leahy, J. P. 2001, ApJ, 551, 206
- Readhead et al. (1996) Readhead, A. C. S., Taylor, G. B., Xu, W., Pearson, T. J., Wilkinson, P. N. & Polatdis, A. G. 1996, ApJ 460, 612
- Rieger & Duffy (2004) Rieger, F. M. & Duffy, P. 2004, ApJ 617, 155
- Rieger and Mannheim (2002) Rieger, F. M., and Mannheim, K. 2002, A&A, 396, 833
- Schilizzi et al. (2001) Schilizzi, R. T., Tian, W. W., J. E. Conway, J. E., Nan, R., Miley, G. K., Barthel, P. D., Dallacasa, M. N. D., & L. I.Gurvits, L. I. 2001, A&A, 368, 398
- Sijbring & de Bruyn (1998) Sijbring, D. & de Bruyn, A. G. 1998, A&A 331, 901
- Simpson et al. (1996) Simpson, C., Ward, M., Clements, D., & Rawlings, S. 1996, MNRAS, 281, 509
- Stawarz and Ostrowski (2002) Stawarz, L. & Ostrowski, M. 2002, ApJ 578, 763
- Stawarz et al. (2004) Stawarz, L., Sikora, M., Ostrowski, M. & Begelman, M. 2004, ApJ, 608, 95
- Stocke and Burns (1987) Stocke, J. T. & Burns, J. O. 1987, ApJ, 319, 671
- Swain et al. (1998) Swain, M. R., Bridle, A. H., & Baum, S. A. 1998, ApJ, 507, L29
- Tansley et al. (2000) Tansley, D., Birkinshaw, M., Hardcastle, M, & Worrall, D. M. 2000, MNRAS, 317, 623
- Taylor (1996) Taylor, G. B. 1996, ApJ 470, 394
- Taylor et al. (2001) Taylor, G. B., Govoni, F., Allen, S. W. & Fabian, A. C. 2001, MNRAS 326, 2
- Taylor and Perley (1992) Taylor, G. B. & Perley, R. A. 1992, A&A, 262, 417
- Tregillis, Jones & Ryu (2001) Tregillis, I. L., Jones, T. W., & Ryu, D. 2001, ApJ, 557, 475
- Tregillis, Jones & Ryu (2004) Tregillis, I. L., Jones, T. W., & Ryu, D. 2004, ApJ 601, 778
- Treichel et al. (2001) Treichel, K., Rudnick, L., Hardcastle, M. J., & Leahy, J. P. 2001, ApJ, 561, 691
- van Vleck & Middleton (1966) van Vleck, J. H. & Middleton, D. 1966, Proc. IEEE, 54, 2
- VLA Calibration Manual (2004) VLA Calibration Manual: “http://www.aoc.nrao.edu/ gtaylor/calman/fluxscale.html”
- Worrall (2004) Worrall, D. M., 2004, astro-ph/0412532
- Young et al. (2002) Young, A., Rudnick, L., Katz-Stone, D. M., & O’Donoghue, A. A. 2002, NewARev, 46, 105

.