The Angstrom Project: a microlensing survey of the structure and composition of the bulge of the Andromeda galaxy
Abstract
The Andromeda Galaxy Stellar Robotic Microlensing Project (The Angstrom Project) aims to use stellar microlensing events to trace the structure and composition of the inner regions of the Andromeda Galaxy (M31). We present microlensing rate and timescale predictions and spatial distributions for stellar and sub-stellar lens populations in combined disk and barred bulge models of M31. We show that at least half of the stellar microlenses in and around the bulge are expected to have characteristic durations between 1 and 10 days, rising to as much as 80% for brown-dwarf dominated mass functions. These short-duration events are mostly missed by current microlensing surveys that are looking for Macho candidates in the M31 dark matter halo. Our models predict that an intensive monitoring survey programme such as Angstrom, which will be able to detect events of durations upwards of a day, could detect around 30 events per season within arcminutes of the M31 centre, due to ordinary low-mass stars and remnants. This yield increases to more than 60 events for brown-dwarf dominated mass functions. The overall number of events and their average duration are sensitive diagnostics of the bulge mass, in particular the contribution of low-mass stars and brown dwarfs. The combination of an inclined disk, an offset bar-like bulge, and differences in the bulge and disk luminosity functions results in a four-way asymmetry in the number of events expected in each quadrant defined by the M31 disk axes. The asymmetry is sensitive to the bar prolongation, orientation and mass.
keywords:
gravitational lensing – stars: low mass, brown dwarfs – galaxies: bulges – galaxies: individual: M31 – galaxies: structure1 Introduction
Over the last decade the microlensing effect has been used to constrain the abundance of compact dark matter in the Milky Way halo (e.g. Alcock et al., 2000a; Afonso et al., 2003a). However, some of the most spectacular results have come not from the dark matter surveys but from stellar microlensing surveys directed towards the Galactic bulge, where thousands of events involving ordinary stars have been detected (e.g. Alcock et al., 2000b; Udalski et al., 2003; Afonso et al., 2003b; Sumi et al., 2003). The optical depth measured by these surveys has shown that the Milky Way bulge is bar-like and oriented almost towards us, a conclusion supported by near-infrared surveys of the bulge (Dwek et al., 1995). There remains some spread in the reported optical depth of the Milky Way bulge by the different survey teams, and this uncertainty partly reflects the difficulty involved in separating foreground disk and bulge lensing populations, as well as the fact that the number of lines of sight through the bulge is severely restricted due to dust obscuration. Follow-up survey teams, which monitor events alerted in real-time by the main survey teams, have also obtained high signal-to-noise ratio lightcurves for many events, including the spectacular binary event EROS BLG-2000-5, which allowed an accurate mass determination to be made of the lens (An et al., 2002), as well as a detailed limb-darkening profile of the source (Fields et al., 2003). These surveys have also produced the first microlensing detection of a planet (Bond et al., 2004). Microlensing in our own galaxy is now an established tool for planetary, stellar and galactic astrophysics.
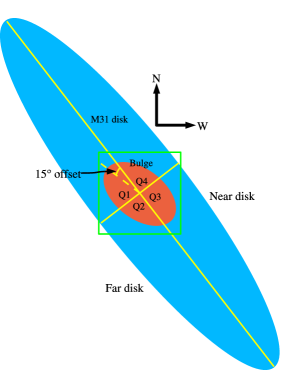
With the advent of techniques like difference imaging (Alard & Lupton, 1998) it has become possible to look for microlensing events in other galaxies where the sources are unresolved, the so-called pixel-lensing regime. Several teams (Paulin-Henriksson et al., 2003; Calchi Novati et al., 2003; Riffeser et al., 2003; de Jong et al., 2004; Uglesich et al., 2004; Joshi et al., 2005) are already exploiting this and similar techniques to look for Macho dark matter candidates in the halo of the Andromeda Galaxy (M31). In this paper we consider how an intensive stellar pixel-lensing survey of the bulge of M31 can be used to probe the stellar mass function and the inner M31 galactic structure. In some respects we have a better view of the M31 bulge than of our own. The M31 disk is inclined at , so we have a relatively unobscured view of the bulge. M31 is believed to be of earlier type than our own galaxy, and therefore thought to possess a more prominent bulge component. Intriguingly, surface brightness measurements of the central regions of M31 reveal a twisting of the inner optical isophotes (Walterbos & Kennicutt, 1987), consistent with a bar-like bulge that is misaligned from the disk major axis by about on the sky (Stark & Binney, 1994). The relationship between the M31 disk and bulge is shown schematically in Figure 1.
The Andromeda Galaxy Stellar Robotic Microlensing (Angstrom) Project aims to detect stellar microlensing events in the bulge region of M31. By obtaining upwards of three epochs per 24-hour period the survey will be sensitive to short-duration stellar microlensing events due to low mass stars and brown dwarfs, which are missed by current M31 microlensing surveys looking for dark matter. Angstrom is using three telescopes in the Northern hemisphere at widely separated longitudes. A pilot season has already begun with the robotic 2m Liverpool Telescope on La Palma, the 1.8m Doyak telescope at the Bohyunsan Observatory in Korea and the 2.4m Hiltner at the MDM Observatory in Arizona. This paper considers how many events a survey like Angstrom should see, and how their number, timescales and spatial distribution are sensitive to the low-mass end of the stellar mass function, and to the bulge mass and geometry. Previous studies (e.g. Gould, 1994; Han, 1996) have considered the optical depth and event rate from simple disk and spheroidal bulge populations. In this study we make a detailed examination of the pixel-lensing signal expected from a barred bulge, based on the survey sensitivity of the Angstrom Project.
The format of the paper is as follows. In Section 2 we discuss the basics of pixel-lensing theory and derive an expresion for the pixel-lensing rate for simple analytic distribution functions. In Section 3 we construct a set of five stellar microlensing models comprising a disk and barred bulge. The models reproduce the observed M31 surface brightness and are carefully constructed using consistent assumptions regarding the stellar mass function, luminosity function and resulting mass-to-light ratio. The microlensing predictions from the models are presented in Section 4 and we end with a discussion of the results in Section 5.
2 Pixel-lensing theory
Pixel lensing differs from classical microlensing in that the sources are unresolved at baseline. Pixel-lensing events are observed as transient local flux enhancements against the background surface brightness. An event is detectable when the lens approaches sufficiently close to the line of sight to an unresolved source. When the lens passes within a fraction of its Einstein radius the background source becomes magnified by a factor , which approximates to for the high-magnification events that comprise the large majority of pixel-lensing lightcurves. A detection is possible when the excess photon count due to the microlensed source star exceeds the local noise, which for bright regions of galaxies is dominated by the galaxy count . For purely Poisson noise we require
| (1) |
where is a typical theorists choice. Let us define to be the threshold impact parameter whereby events with a minimum impact parameter satisfy equation (1) and so are detectable. These events are detectable for a timescale
| (2) |
with
| (3) |
the angular size of the Einstein radius, the lens mass, the distance to the source star and the distance to the lens in units of . Here and denote the standard physical constants. In equation (2) is the relative proper motion of the lens across the line of sight and is the Einstein radius crossing time. We call the visibility timescale of the pixel-lensing event. To characterise an event we must sample with a frequency that is much higher than . In this case each of our observations of the event around peak has a significance of at least and the significance of the event detection as a whole is much greater.
The differential rate of pixel microlensing for lenses of mass against a given source star can be expressed as
| (4) |
where is the lens distribution function, is the lens velocity along the line of sight, is the lens impact parameter, is the lens mass function and describes the random orientation of the lens and source on the sky. Using equation (2) to change variables from to we can re-write equation (4) as
| (5) |
from which the event timescale distribution can be obtained.
For the models discussed in this paper we shall assume simple distribution functions comprising an analytic density function and an isotropic Maxwellian velocity distribution. That is
| (6) |
where has a functional form yet to be specified, is the velocity across the line of sight and is the one-dimensional velocity dispersion. Equation (5) can then be integrated to give the timescale distribution
| (7) | |||||
where is the zeroth-order modified Bessel function, and , with the proper motion of the line of sight. When considering a range of lens masses we must integrate the timescale distribution over the lens mass function :
| (8) |
where and are the lower and upper lens mass cut-offs, respectively. The integral of over then provides the pixel-lensing event rate per source, .
From equation (1) we can see that depends upon both the source luminosity and the background surface brightness. Moreover, is also sensitive to the source distance . Therefore a full evaluation of at a single timescale and along a single line of sight involves solving a five-dimensional integral over , , , and source luminosity. An evaluation of over the whole bulge region requires two further integrals over and galaxy surface brightness. We evaluate the integrals over , , and surface brightness via direct numerical integration, whilst the integrals over , and source luminosity are performed using Monte-Carlo techniques.
A further complication is that equation (1) and subsequent formulae strictly hold only if the source star can be assumed to be point-like, that is to say its angular size . This approximation may break down when bright giant stars are microlensed by low-mass brown dwarfs in the disk or bulge. In this finite-source regime there is differential magnification across the face of the source star and so the overall magnification is evaluated by integrating the microlensing magnification over the source. In our calculations we explicitly take account of finite source effects when necessary.
3 Simple models for the M31 inner galaxy
Microlensing predictions necessarily depend upon the choice of model one adopts for the lens and source populations. There is a good deal of uncertainty in some of the key parameters, which in itself presents one of the prime drivers for the Angstrom Project. Given this uncertainty, it is sufficient for us to adopt relatively simple models for the M31 stellar population that contain the key parameters we are interested in exploring. To this end we consider a simple two-component model for the stellar populations in M31 comprising an exponential disk and a barred bulge.
At first sight stellar pixel lensing predictions appear to be at the mercy of several theoretical distributions, many of which are ill-constrained or unknown for M31. These include (for both the disk and bulge components) the density and velocity distributions, the stellar and remnant mass functions, and the source luminosity functions. However these distributions are tightly linked with one another and we can exploit this in order to reduce the parameter space. Firstly, we demand that our bulge and disk models are able to satisfactorily reproduce the observed M31 surface brightness profile along both the major and minor axes. Secondly, we demand that our assumed luminosity and mass functions are consistent with one another, that is to say our assumed luminosity functions fix the shape of the upper end of our mass functions where the bulk of the light is produced. Thirdly, the low mass end of our mass functions fix the density normalisations for the disk and bulge and thereby their mass-to-light ratios, since the light is fixed by the observed surface brightness profile.
We proceed by investigating “heavy” and “light” disk and bulge models. The heavy models assume stellar mass functions that extend into the brown dwarf regime and that contain a significant density in such objects. The light models comprise just ordinary hydrogen burning stars with a mass distribution similar to Milky Way stellar populations. All disk and bulge models also comprise a stellar remnant contribution and the disk models are assumed to comprise a significant amount of gas which neither provides sources nor lenses for microlensing. The mass-to-light ratio implied by the adopted mass functions, along with the gas and remnant contributions, sets the density normalisation for each component by the requirement that the combined light from the disk and bulge satisfactorily reproduces the M31 surface brightness profile along the major and minor axes.
3.1 Density and velocity distributions
Our first component is the disk, for which we adopt a conventional double-exponential profile:
| (9) |
where is the central disk density, kpc is the disk scale-length, kpc is the scale-height, and and are cylindrical coordinates. For our heavy disk we find pc-3 gives an -band mass-to-light ratio and reproduces well the M31 surface brightness away from the bulge, whilst for the light disk model we set the normalisation a factor 3.4 times lower.
Disk lenses and sources are assumed to orbit the disk with a circular speed of 235 km s-1 beyond 1.25 kpc (5 arcminutes) of the M31 centre. Inside 1.25 kpc the disk is taken to be a solid body rotator. Stars in the heavy disk are assumed to have random motions described by the Maxwellian velocity distribution in equation (6), with a mean one-dimensional dispersion in the transverse direction of km s-1 at , a position roughly equivalent to the location of the Sun in the Milky Way; for the light disk we assume a dispersion that is a factor lower than this. For other cylindrical distances the velocity dispersion is scaled by , that is by the square root of the mid-plane density.
The second component is the bulge. The twisting of the optical isophotes in the inner regions of M31 clearly indicates that the M31 bulge is barred and with a major axis which is offset by some on the sky from the M31 disk major axis (Stark & Binney, 1994), as illustrated schematically in Figure 1. The surface brightness profile of galactic bulges and elliptical galaxies is typically observed to follow the de Vaucouleur exponential law (Wyse, Gilmore & Franx, 1997). However, in the inner regions a power-law profile with surface brightness is often observed (Binney & Merrifield, 1998), implying a volume density fall-off . We shall consider two possible profiles, one an exponential and one a power law. Both distributions are modelled as bars that are offset from the M31 disk major axis.
For the exponential bulge we adopt the following distribution:
| (10) |
where kpc is the bulge scale length, is a power-law index, defines the bar prolongation and , and are Cartesian coordinates aligned along the bar principal axes, with normal to the disk plane. The choice of and provides a good fit to the surface brightness profile within 10 arcminutes, the region in which we are interested, though the fit becomes poorer at larger radii (see top panel of Figure 2). For the heavy bulge we fix pc-3 giving and a bulge mass of , which is towards the upper end of favoured mass estimates (c.f. Kent, 1989; Widrow, Perrett & Suyu, 2003). For the light bulge the density is 3.4 times lower, which is at the lower end of the range of mass estimates and is comparable to the inferred mass of the Milky Way bulge (Dwek et al., 1995).
For the power-law distribution we take
| (11) |
Here we adopt kpc, and a power-law index . The parameters and are chosen to allow a good match to the shape of the observed major- and minor-axis surface brightness profiles (bottom panel of Figure 2).. The density normalisation for the power-law bulge is fixed at pc-3, giving a total mass of , intermediate to the heavy and light exponential bulge, though which is the same as for the light exponential bulge.
| Model | Description | Bulge parameters | Disk parameters | Remarks |
|---|---|---|---|---|
| 1 | Light exponential | pc-3, km s-1 | pc-3, km s-1 | |
| bulge, light disk | , | , | ||
| kpc, | ||||
| 2 | Heavy exponential | pc-3, km s-1 | pc-3, km s-1 | |
| bulge, heavy disk | , | , | ||
| kpc, | ||||
| 3 | Light exponential | pc-3, km s-1 | pc-3, km s-1 | |
| bulge, heavy disk | , | , | ||
| kpc, | ||||
| 4 | Light exponential | pc-3, km s-1 | pc-3, km s-1 | Uses disk LF and |
| bulge, heavy disk | , | , | MF for both bulge | |
| kpc, | and disk | |||
| 5 | Power-law bulge, | pc-3, km s-1 | pc-3, km s-1 | |
| light disk | , | , | ||
| kpc, |
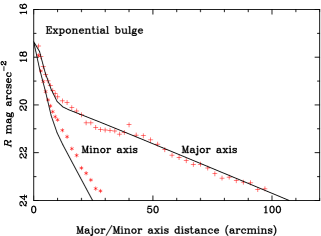
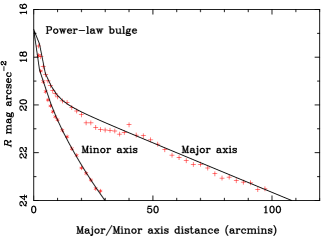
The -band surface brightness distribution predicted by the combined disk and exponential bulge model is shown in the upper panel of Figure 2, whilst the lower panel shows the combined disk and power-law bulge profile. Also shown are -band surface brightness measurements along the major and minor axis of the M31 disk made by Walterbos & Kennicutt (1987). The distributions in equations (10) and (11) differ dramatically at large distances from the bulge centre. The exponential profile gives a considerably poorer fit than does the power-law profile at distances beyond 10 arcminutes along the M31 minor axis. However, the two distributions are necessarily similar at smaller distances within the region of interest to us, with the power-law bulge having a slightly brighter peak.
The bulge stars are taken to have Maxwellian random motions according to equation (6) with km s-1 for the light exponential bulge, a factor higher for the power-law bulge and a factor higher for the heavy exponential bulge. The dispersions are consistent with the range of km s-1 observed by McElroy (1983). The bulge velocity dispersion could well differ significantly along each of the principal axes of the bar, so our chosen represents the square root of the mean two-dimensional transverse dispersion. We also adopt a bar pattern speed of 57 km s-1 kpc-1 out to 3.2 kpc (Stark & Binney, 1994), capping the circular speed at 180 km s-1 outside of this.
3.2 Source luminosities
From equation (1) the intrinsic luminosity of the sources is a key factor in detecting pixel-lensing events. Fainter sources are more numerous but require higher magnification in order to be detected. The expected rate of pixel lensing therefore depends on the luminosity function of the sources, but tends to be dominated by the brighter stars.
The luminosity function of the M31 bulge region has been explored in several studies (e.g. Davies, Frogel & Terndrup, 1991; Rich & Mighell, 1995; Jablonka et al., 1999; Stephens et al., 2003). The high stellar densities cause severe blending problems, which hamper accurate calibrations of the bright end of the stellar luminosity function. In so far as this can be corrected, recent studies find no significant evidence for differences between the bright end of the stellar luminosity function in the M31 and Milky Way bulge regions (Stephens et al., 2003).


We use synthetic colour-magnitude data to model the M31 source stars. These have been generated to match the chemical composition and the mass and luminosity functions observed for stars in the Milky Way disk and bulge and we assume they provide an adequate description of stars in the M31 disk and bulge. The synthetic datasets are based upon the theoretical stellar isochrones of the Padova group (Girardi & Salaris, 2001). The disk and bulge datasets each comprise around a million simulated stars with tabulated masses, ages, bolometric luminosities, effective temperatures and absolute magnitudes in several passbands. The versus colour–magnitude diagrams for a subset of the disk and bulge stars are shown in Figure 3.
The main advantage in using synthetic datasets for microlensing calculations is that the radius of each star can be readily computed and so we can allow for finite source effects in a consistent way. For all but one of our microlensing models we shall assume the M31 bulge sources are described by the synthetic Milky Way bulge stars and the M31 disk sources by the synthetic Milky Way disk stars. For the other model we assume both bulge and disk sources are described by the synthetic Milky Way disk stars. This allows us to assess the impact of our choice of luminosity function upon the pixel lensing rate predictions.
We allow for for a combined foreground and internal M31 -band extinction of mag when computing the mass-to-light ratio of the source stars. This is equivalent to three times the foreground value (Schlegel, Finkbeiner & Davis, 1998) and is consistent with extinction measurements of Sb galaxies using background galaxy counts (Holwerda, Gonzalez, Allen & van der Kruit, 2005).
3.3 Stellar and remnant mass functions
For our light models we assume that the bulge and disk mass functions in M31 are similar to those of the Milky Way disk and bulge but do not extend into the brown dwarf regime. We assume a mass function of the form , where and are the mass functions of the stars and remnants, respectively. The remnant mass function is taken to be a superposition of three Dirac delta functions peaked at 0.6, 1.35 and , corresponding to white dwarfs, neutron stars and black holes, respectively. The ratio of their mass density contributions is set at 0.7:0.2:0.1, respectively. This prescription is a slight simplification of the remnant mass function advocated by Gould (2000).
The stellar mass function is modelled by a broken power law:
between lower and upper mass limits and . We set the transition mass at . The power law index and are fixed to be consistent with our synthetic stellar population models. Accordingly we take for bulge stars and for disk stars, whilst for both populations. This is the case for both the heavy and light models. For the light bulge and disk we take and , which is consistent with observations of the Milky Way bulge mass function (Zoccali et al., 2000). For the heavy models we instead let and extend the mass function down to for the bulge and for the disk. Different values of are needed in order to reproduce the correct values for each component, though we could just as easily have used a single value of and different values for .
The normalisation constant is fixed by the overall stellar mass density, which contributes a fraction of the overall density, where and are the remnant and gas density contributions, respectively. We assume in the bulge and 0.3 in the disk, whilst in the bulge and 0.15 in the disk. The values of both and directly affect the computed for each population as there is no light contribution from the remnants or the gas. They therefore affect the way in which changes to the stellar mass function translate into changes in the overall density normalisation of a given component. Also, the larger the value of then the greater the microlensing contribution from remnant lenses at the expense of stellar lenses, whereas a larger value of reduces the overall microlensing signal since it is at the expense of both the remnant and stellar density contributions.
3.4 The microlensing models
The models we use to compute the pixel-lensing rate are presented in Table 1. Model 1 is the most conservative comprising a light disk and light exponential bulge. Model 2 considers a heavy disk and heavy exponential bulge. Model 3 examines the effect of a light exponential bulge combined with a heavy disk. The purpose of Model 4 is to allow us to explore the effect of the luminosity function on pixel-lensing predictions. It assumes a disk luminosity function and heavy disk mass function for both the bulge and disk populations, though the bulge has the same gas and remnant fraction as for the other bulge models. The resulting mass-to-light ratio is , slightly lower than the heavy disk value. So, whilst the bulge mass function in Model 4 is similar to the heavy bulge model, the bulge mass is closer to that of the light bulge because of the low mass-to-light ratio of the disk-like stellar population. Finally, Model 5 considers a light disk and power-law bulge to allow a comparison between different functional forms for the bulge.
4 Microlensing yields
We base our rate calculations on the parameters of the Angstrom Project, assuming a distance to M31 of 780 kpc (Stanek & Garnavich, 1998) and a foreground extinction of (Schlegel, Finkbeiner & Davis, 1998). The Angstrom Project uses three telescopes, one with a 11 arcminute field of view, the other two with 5 arcminute fields of view. The data is being analysed using difference imaging techniques (Alard & Lupton, 1998), in which an optimal reference image is constructed from images taken under good seeing conditions and then subtracted from each target image after they have been convolved to match the seeing characteristics of the reference image. The resulting difference images record only objects that have varied in their flux. For our calculations we assume observations are made in the band and the reference image has a seeing of 1 arcsec. The typical -band exposure time is set at 600 sec and the detector has a zero point of mag. For a Gaussian source point spread function (PSF), and assuming the noise within the PSF is dominated by the galactic background, the optimal signal-to-noise ratio is obtained by measuring the difference flux out to 71.5% of the encircled energy in the PSF, corresponding to a radius of 0.67 arcsec for our reference image. For guidance, the dashed lines in Figure 3 indicate the limiting source magnitude assuming the parameters above for the detection of a pixel-lensing event with and a background surface brightness mag arcsec-2.
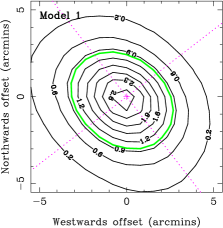
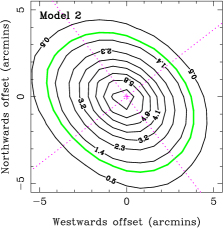
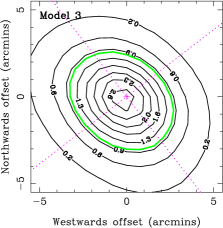
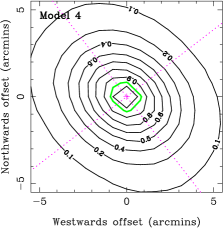
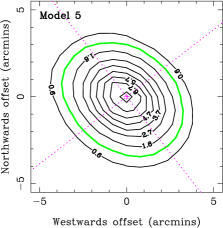
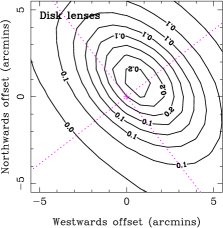
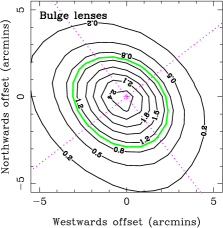
Figure 4 shows the spatial distribution of pixel-lensing events with for the five models in Table 1. The plots cover a field of view of 11 arcminutes centred on the bulge. The cross denotes the centre of M31 and the dotted lines show the orientation on the sky of the major and minor axes of the M31 disk. The contours show the expected number of events per square arcminute per year. For all models the event distribution is strongly dominated by bulge lenses, as can be seen in Figure 5, which shows the spatial distribution separately for disk and bulge lenses. The number of events involving disk lenses is typically around 3 events per season, so it is around order of magnitude lower than the bulge rate even for the heavy disk models. The spatial distributions in Figure 4 therefore trace the bulge structure and so are noticeably rotated away from the disk axes for all models. Additionally, models 1–3 clearly show an excess of events towards the far (South-Eastern) side of the M31 disk. For these models a significant fraction of all events involve bulge lenses and disk sources, so we expect their distribution to be skewed towards the far disk. Models 4 and 5 are dominated by events involving bulge lenses and sources, so their distributions appear more symmetric and more closely trace the bar profile.
| Model | (d) | (1-100 d) | (1-10 d) | ||||
| Q1 | Q2 | Q3 | Q4 | Total | |||
| 1 | 16 | 8 | 8 | 6 | 5 | 27 | 13 |
| 2 | 7 | 19 | 17 | 16 | 12 | 64 | 51 |
| 3 | 14 | 8 | 8 | 7 | 5 | 28 | 15 |
| 4 | 7 | 3 | 3 | 3 | 3 | 12 | 10 |
| 5 | 13 | 14 | 13 | 13 | 10 | 50 | 28 |
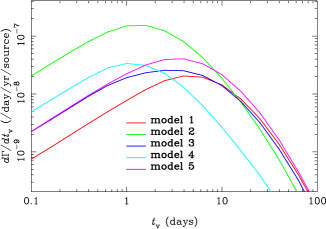
Figure 6 shows the timescale distributions for models 1–5. The separation between the model predictions is most evident at timescales days, emphasising the need for short-timescale sensitivity. In general the heavier models produce a higher rate of events and peak at shorter durations. The rate for all models tails off sharply for days.
Table 2 shows the average duration and the number of events with visibility timescales between 1 and 100 d expected from a five-month observing season for an 11 arcminute field centred on the M31 bulge. The average duration lies between 7 and 16 days, with heavier bulge models giving rise to shorter events. The shorter durations arise because the mass function for the heavier models extends into the low-mass brown dwarf regime, and also because the velocity dispersion for the heavier models is larger.
Excluding model 4, the total number of events with durations between 1 and 100 d ranges from 27 up to 64, with the larger yields coming from the heavier, brown-dwarf rich models. The number of short-duration events ( d) is also shown in Table 2, ranging from 13 events per season for the lighter models through to 50 events per season for the heavy exponential bulge. For the lighter models about half of all events have durations below 10 days, whilst for the heavier models they comprise up to of all events.
Model 4 assumes a disk luminosity function and heavy disk mass function for the bulge stars. Observations clearly exclude such a luminosity function for the M31 bulge, but the purpose of this hybrid model is simply to assess the affect of changes to the luminosity function on pixel-lensing predictions. It is evident from Figure 4 and Table 2 that the yield from this model is significantly less than for the others; it is a factor two below the conservative model 1. Naively this seems a very surprising result given that the bulge sources are brighter for model 4. Equation (1) indicates that brighter sources can be detected at larger impact parameters and therefore the rate per source is larger from equation (4). However, the low mass-to-light ratio of the disk-like stars means that we must adopt a brown-dwarf dominated mass function to give a bulge mass which is compatible with at least the lower end of the preferred M31 bulge mass estimates, whilst satisfying the observed M31 surface brightness. Even with a brown-dwarf dominated mass function, a heavier bulge would be too bright to be consistent with surface brightness observations. The combination of low-mass lenses and bright giant stars typically gives rise to finite source effects which dilute the overall microlensing magnification. For a lens lying at a typical distance of 1 kpc in front of the source, a lens–source angular separation of less than arcsec is required to produce a magnification . At the distance of M31 this corresponds to a separation of just 6 R☉, so finite source effects are dominant at these lens masses, resulting in a significant suppression of the microlensing rate for this model. This model is obviously rather extreme, but the basic point is that the boost in the microlensing rate per source due to brighter stars is cancelled out by the lower density normalisation required to satisfy surface brightness constraints. So, even if there are no constraints on the permitted mass of the bulge, a boost in the number of bright stars does not result in a gain in the overall microlensing rate.
The number of events expected within each quadrant Q1–4 defined in Figure 1 is also given in Table 2. For models 1–3 the ratio of the number of events in each quadrant is about 1.6:1.5:1.2:1 (Q1:Q2:Q3:Q4), whilst for model 4 it is 1.2:1:1.2:1 and for model 5 (the power-law bulge) it is 1.5:1.3:1.3:1. The number of events in quadrants Q1 and Q2 generally outnumber those in Q3 and Q4 because the M31 disk inclination skews the distribution of bulge lens–disk source events towards the far disk. This along with the offset of the barred bulge away from the disk axis introduces an enhanced asymmetry between events at either end of the bar in Q1 and Q3, giving rise overall to a four-way asymmetry. The asymmetry is much less evident for model 4 because the source luminosity and lens mass functions are the same for the disk and bulge, so the rate of bulge lens–disk source events is similar to the rate of disk lens–bulge source events. For the other models, the strength of this four-way asymmetry depends upon the bar offset, the degree of bar prolongation, and the mass of the bar, so it is a good signature with which to probe the bar geometry. For the models 1–3, a sample of around 28 events would be needed in Q4 in order to detect a difference with Q1 at the confidence level. Such a difference should therefore be detectable within three to six seasons, depending on the model. However, a much more efficient strategy is simply to undertake a likelihood analysis of the positions and timescales of the entire sample in order to constrain the bar parameters.
One factor which can affect the observed event rate is extinction. We have allowed for both foreground and internal extinction in calibrating our M31 models (see Section 3.2). We have also allowed for foreground extinction in computing the M31 distance modulus, but we have ignored internal M31 extinction for our rate calculations. Holwerda, Gonzalez, Allen & van der Kruit (2005) have obtained internal extinction estimates for several nearby spiral galaxies by studying background galaxy counts. They find that extinction estimates are relatively independent of the galaxy inclination angle, which suggests that the dust is confined to a thin sheet in the disk plane. In this case it is easy to quantify the affect of extinction on microlensing rates. The half of the source population which lies in front of the dust screen is unaffected by the dust. The other half is dimmed by a factor for an internal extinction of mag. From equation (1) we see that, for a fixed galaxy brightness, a reduction in source flux demands a similar reduction in the maximum impact parameter in order for the microlensed source to be detected. Since from equation (4) the microlensing rate scales with then an internal M31 extinction of results in an overall reduction of in the observed rate.
5 Discussion
The Angstrom Project is using three telescopes to conduct a high time resolution survey of the bulge of the Andromeda Galaxy (M31). The principal aim of the survey is to detect microlensing events with durations above one day due to low mass stars and brown dwarfs in the bulge of M31.
We have shown in this study that M31 presents a ripe target for a high time resolution microlensing survey. Using simple analytic models for the disk and bulge of M31 we have shown that a survey like Angstrom should detect around 27 events per season over an 11 arcminute field of view for a standard stellar mass function which is truncated at the hydrogen burning limit. Half of these events have durations below 10 days. If the stellar mass function contains a substantial brown-dwarf population the expected yield raises to around 64 events per season, with some having durations less than 10 days.
The underlying mass function of the lenses can be probed through the average duration of detected events, as well as through the number of events. Mass functions with dominant brown dwarf populations produce shorter events but also necessarily imply a larger mass-to-light ratio and so heavier bulge or disk mass, giving rise to more events.
We find that the events are dominated by bulge lenses and that their spatial distribution provides a good tracer of the bulge geometry. In particular, if the bulge is barred and orientated away from the disk major axis, as suggested by surface brightness measurements, then this should be evident in the spatial distribution of the events. The importance of this is that microlensing directly traces the underlying mass distribution, rather than the light distribution, and so provides a completely independent probe of the underlying bar geometry. Lastly, the combination of an offset barred bulge, a highly inclined disk, and different stellar luminosity functions in the disk and bulge is predicted to give rise to a four-way asymmetry in the number of events. Different numbers of events are expected in each of the four quadrants defined by the major and minor axes of the M31 disk.
Aside from probing the M31 bulge structure and mass function, the high time resolution data from the Angstrom Project should allow for a more efficient detection of exotic microlensing phenomena, such as binary lensing events (Baltz & Gondolo, 2001), than is possible with current surveys. It will also be uniquely sensitive to variable stars and transients which undergo outbursts on timescales of less than 10 days.
Acknowledgements
We thank Maurizio Salaris for running the synthetic colour magnitude simulations which were employed in this work. The work of EK is supported by an Advanced Fellowship from the Particle Physics and Astronomy Research Council. MJD and JD are supported by PhD studentships from the Particle Physics and Astronomy Research Council. Work by AG is supported by NSF grant 02-01266. Work by CH is supported by the Astrophysical Research Center for the Structure and Evolution of the Cosmos (ARCSEC) of the Korea Science and Engineering Foundation, through the Science Research Center Program. BGP is supported by the Ministry of Science and Technology of Korea.
References
- Afonso et al. (2003a) Afonso C. et al., 2003a, A&A, 400, 951
- Afonso et al. (2003b) Afonso C. et al., 2003b, A&A, 404, 145
- Alard & Lupton (1998) Alard C., Lupton R., 1998, ApJ, 503, 325
- Alcock et al. (2000a) Alcock C. et al, 2000a, ApJ, 542, 281
- Alcock et al. (2000b) Alcock C. et al, 2000b, ApJ, 541, 734
- An et al. (2002) An J., 2002, ApJ, 572, 521
- Baltz & Gondolo (2001) Baltz E., Gondolo P., 2001, ApJ, 559, 41
- Binney & Merrifield (1998) Binney J., Merrifield M., 1998, Galactic Astronomy, Princeton, New Jersey, p192
- Bond et al. (2004) Bond I., et al., 2004, ApJ, 606, L155
- Calchi Novati et al. (2003) Calchi Novati S., et al., 2003, A&A, 405, 851
- Davies, Frogel & Terndrup (1991) Davies R., Frogel J., Terndrup D, 1991, AJ, 102, 1729
- de Jong et al. (2004) de Jong J., et al., 2004, A&A, 417, 461
- Dwek et al. (1995) Dwek E., et al., 1995, ApJ, 445, 716
- Fields et al. (2003) Fields D., et al., 2003, ApJ, 596, 1305
- Girardi & Salaris (2001) Girardi L., Salaris M., 2001, MNRAS, 323, 109
- Gould (1994) Gould A., 1994, ApJ, 435, 573
- Gould (2000) Gould A., 2000, ApJ, 535, 928
- Han (1996) Han C., 1996, ApJ, 472, 108
- Holwerda, Gonzalez, Allen & van der Kruit (2005) Holwerda B., Gonzalez R, Allen R., van der Kruit P., 2005, AJ, in press (astro-ph/0411663)
- Jablonka et al. (1999) Jablonka P. et al., 1999, ApJ, 518, 627
- Joshi et al. (2005) Joshi Y., Pandey A., Narasimha D., Sagar R., 2005, A&A, in press (astro-ph/0412550)
- Kent (1989) Kent S.M., 1989, AJ, 97, 1614
- McElroy (1983) McElroy D., 1983, ApJ, 270, 485
- Paulin-Henriksson et al. (2003) Paulin-Henriksson S., et al., 2003, A&A, 405, 15
- Rich & Mighell (1995) Rich R., Mighell K., 1995, ApJ, 439, 145
- Riffeser et al. (2003) Riffeser A., Fliri J., Bender R., Seitz S., Gössl C., 2003, ApJ, 599, 17
- Schlegel, Finkbeiner & Davis (1998) Schlegel D., Finkbeiner D., Davis M., 1998, ApJ, 500, 525
- Stanek & Garnavich (1998) Stanek K., Garnavich P., 1998, ApJ, 503, 131
- Stark & Binney (1994) Stark A., Binney J., 1994, ApJ, 426, L31
- Stephens et al. (2003) Stephens A., et al., 2003, AJ, 125, 2473
- Sumi et al. (2003) Sumi T., et al., 2003, ApJ, 591, 204
- Udalski et al. (2003) Udalski A., et al., 2003, AcA, 53, 291
- Uglesich et al. (2004) Uglesich R., et al., 2004, ApJ, 612, 877
- Walterbos & Kennicutt (1987) Walterbos R., Kennicutt R., 1987, A&AS, 69, 311
- Widrow, Perrett & Suyu (2003) Widrow L., Perrett K., Suyu S., 2003, ApJ, 588, 311
- Wyse, Gilmore & Franx (1997) Wyse R., Gilmore G., Franx M., 1997, ARA&A, 35, 637
- Zoccali et al. (2000) Zoccali M., et al., 2000, ApJ, 530, 418