11email: [pere.blay;ascension.camero;victor.reglero]@uv.es 22institutetext: Service d’Astrophysique and AIM, CEA Saclay, Bât. 709, L’Orme des Merisiers, 91191 Gif-sur-Yvette, Cedex, France
22email: mribo@discovery.saclay.cea.fr 33institutetext: Departamento de Física, Ingeniería de Sistemas y Teoría de la Señal, Escuela Politécnica Superior, Universitat d’Alacant, Ap. 99, 03080 Alicante, Spain
33email: [ignacio;jmt]@dfists.ua.es 44institutetext: IESL, Foundation for Research and Technology, 71110 Heraklion, Crete, Greece 55institutetext: University of Crete, Physics Department, PO Box 2208, 710 03 Heraklion, Crete, Greece
55email: pau@physics.uoc.gr 66institutetext: European Southern Observatory, Alonso de Córdova 3107, Vitacura, Casilla 19001, Santiago 19, Chile
66email: fmirabel@eso.org
Further evidence for the presence of a neutron star in 4U~2206+54. INTEGRAL and VLA observations††thanks: Based on observations with INTEGRAL, an ESA project with instruments and science data centre funded by ESA member states (especially the PI countries: Denmark, France, Germany, Italy, Switzerland, Spain), Czech Republic and Poland, and with the participation of Russia and the USA.
The majority of High Mass X-ray Binaries (HMXBs) behave as X-ray pulsars, revealing that they contain a magnetised neutron star. Among the four HMXBs not showing pulsations, and that do not show the characteristics of accreting black holes, there is the unusual HMXB 4U~2206+54. Here we present contemporaneous high-energy and radio observations of this system conducted with INTEGRAL and the VLA in order to unveil its nature. The high-energy spectra show clear indications of the presence of an absorption feature at 32 keV. This is the third high-energy observatory which reveals marginal evidence of this feature, giving strong support to the existence of a cyclotron resonance scattering feature, which implies a magnetic field of 3.61012 G. On the other hand, the source is not detected at centimetre radio wavelengths with a 3 upper limit of 0.039 mJy. The expected radio emission for an accreting black hole in the low/hard state, inferred from X-ray flux measurements, would be at least 60 times greater than the measured upper limit. Both results firmly indicate that, in spite of the absence of pulsations, 4U~2206+54 hosts a magnetic accreting neutron star, the first one not to be observed as an X-ray pulsar.
Key Words.:
stars: individual: 4U~2206+54 – X-rays: binaries – radio continuum: stars – stars: variables: general1 Introduction
The vast majority of High Mass X-ray Binaries (HMXBs) harbour X-ray pulsars (c.f. Bildsten et al. bildsten97 (1997)), believed to be young neutron stars with relatively strong magnetic fields ( G). An important fraction of them are wind-fed systems, in which the pulsar accretes from the radiative wind of an OB supergiant (perhaps, in some cases, a Wolf-Rayet star).
Among the handful of HMXBs not displaying X-ray pulsations, only three show the typical characteristics of accreting black holes (LMC~X-1, LMC~X-3 and Cyg~X-1). In four other HMXBs, pulsations have not been discovered in spite of intensive searches, but there is no strong evidence identifying the accreting object as a black hole. In principle, there is no reason to attribute the lack of pulsations in all these systems to any particular characteristic and different models have indeed been proposed to explain some of them. There have been suggestions that 2E~0236.6+6101, whose counterpart is the B0 Ve star LS~I~$+61^∘$303, and RX~J1826.2$-$1450, identified with the O6.5 V((f)) star LS~5039, may not be accreting binaries after all, but X-ray sources powered by rotational energy from a young non-accreting neutron star (Maraschi & Treves maraschi81 (1981); Martocchia et al. martocchia05 (2005)), although the presence of relativistic radio jets points towards the accretion scenario (Massi et al. massi04 (2004); Paredes et al. paredes00 (2000)). In the case of 4U~1700$-$37, optically identified with the O6.5 Iaf+ star HD~153919, a compact object of unknown nature and mass accretes material from the wind of the massive supergiant (Clark et al. clark02 (2002)).
The fourth HMXB not displaying pulsations is 4U~2206+54, identified with the O9p star BD~$+53°$2790 (Negueruela & Reig negueruela01 (2001); henceforth NR01). The relatively high X-ray luminosity of 4U~2206+54, erg s-1 (at an estimated distance of 3 kpc; NR01), combined with its spectral shape, makes the presence of a neutron star or a black hole in the system almost unavoidable. There are reasons to believe that the compact object in this system is a neutron star (NR01; Torrejón et al. torrejon04 (2004); Masetti et al. masetti04 (2004)), but the possibility of a black-hole has not been ruled out completely by previous observations. Analysis of the RXTE/ASM X-ray lightcurve revealed a 9.6 d periodicity, which is likely to be the orbital period of a compact object (Corbet & Peele corbet01 (2001); Ribó et al. ribo05 (2005)). Moreover, the X-ray lightcurve displays short aperiodic variability, with changes in the flux by a factor 10 over timescales of minutes (Saraswat & Apparao saraswat92 (1992); NR01), which are typically seen in wind-fed systems, presumably as a consequence of stochastic variability in the wind.
Interestingly, many high-energy sources not showing pulsations are microquasars (containing either black holes or neutron stars), while pulsating sources do not show significant radio-emission (Fender & Hendry fender00 (2000)). 4U~2206+54 shares many characteristics with the well-known microquasar LS~5039 (Paredes et al. paredes00 (2000), paredes02 (2002)). Both systems contain a non-supergiant late O-type star (Clark et al. clark01 (2001)) and a compact object that does not show pulsations (Ribó et al. ribo99 (1999); Reig et al. reig03 (2003)) orbiting in a relatively close orbit when compared to the majority of HMXBs, and both systems show evidences of wind-fed accretion (NR01; McSwain et al. mcswain04 (2004)) with X-ray luminosities in the range – erg s-1. However, an inspection of the VLA Sky Survey (NVSS, Condon et al. condon98 (1998)) reveals no radio emission up to a 3 upper limit of 1 mJy from 4U~2206+54. The apparent lack of both radio emission and pulsations does not fit within either the typical scenario of a pulsar in a HMXB or the microquasar scenario, and a deeper multi-wavelength approach is necessary.
In this work we present new INTEGRAL and VLA observations of the source during the periods 2002 December–2004 September and 2003 May–June, respectively. The possible presence of a cyclotron line, already suggested by the data from RXTE and BeppoSAX (Torrejón et al. torrejon04 (2004); Masetti et al. masetti04 (2004)), and the absence of radio emission are discussed.
2 Observations and data analysis
2.1 High-energy observations
INTEGRAL is a joint European mission in flight from 2002 October, with three on-board high-energy instruments: the Imager on Board INTEGRAL Spacecraft (IBIS), coupled with the INTEGRAL Soft Gamma-Ray Imager (ISGRI) and the Pixellated Imaging Caesium Iodide Telescope (PICsIT), sensitive to -rays from 15 keV up to 10 MeV; the SPectrometer in INTEGRAL (SPI), optimised for spectroscopy in the keV– MeV energy range; and the Joint European Monitor-X (JEM-X), consisting of twin X-ray monitors, which provides information at lower energies (3–35 keV). An Optical Monitoring Camera (OMC) gives source fluxes in the (550 nm) band and complements the 3 high-energy instruments. All 4 instruments are co-aligned, allowing simultaneous observations in a very wide energy range. A detailed description of the mission can be found in Winkler et al. (winkler03 (2003)).
INTEGRAL observed the region around 4U~2206+54 on several occasions during its first 22 months of Galactic Plan Survey scans (GPSs), i.e., from 2002 December to 2004 September. We present in Table 1 a summary of all the INTEGRAL revolutions during which the source was inside the Field Of View (FOV) of ISGRI. In total, the source was observed by ISGRI for 337 ks, but it was significantly detected only for 27 ks111A detection is considered for ISGRI when the detection level, which is given by the software package and is not directly related to the number of above background, lies above a value of 8. For the typical exposure times of GPS pointings ( ks), the sensitivity limit of ISGRI lies around 2.5 count s-1 at 20–40 keV energy range.. For revolutions 70, 74, 145 and 189 only an upper limit is given because the source had quite a marginal position in the FOV of ISGRI and the detection is not significant enough. The JEM-X FOV is smaller and thus data were only collected during those revolutions when INTEGRAL pointed close enough to the source (marked in Table 1 with the symbol)222A detection is considered for JEM-X when the detection level, which is given by the software package and is not directly related to the number of above background, lies above a value 20.. Only a few pointings in 2003 May and June fulfill this requirement. Although SPI has the largest FOV, it cannot acquire enough information with one exposure due to the detector design. To achieve a S/N10 for a source like 4U~2206+54, SPI would need around 300 ks. Nevertheless, using SPIROS in TIMING mode (see Skinner & Connell skinner03 (2003)) a light curve has been attained in the 20–40 keV energy range. The obtained flux values are in good agreement with the ISGRI data, but they have larger uncertainties compared to them. Therefore, no data from SPI have been used in this analysis. Data reduction has been performed with the standard Offline Analysis Software (OSA) version 4.0, available from the INTEGRAL Science Data Centre (ISDC)333http://isdc.unige.ch/index.cgi?Soft+download. A detalied description of the software can be found in Goldwurm et al. (goldwurm03 (2003)), Diehl et al. (diehl03 (2003)), Westergaard et al. (westergaard03 (2003)) and references therein.
| Rev. | Date | MJD | On-source time | Detected time | Mean count rate | Detection level |
|---|---|---|---|---|---|---|
| (ks) | (ks) | (count s-1) | ||||
| 26 | 2002 Dec 30–2003 Jan 1 | 52638.43–52640.07 | 14 | — | — | — |
| 31 | 2003 Jan 14–16 | 52653.32–52655.90 | 12 | — | — | — |
| 47 | 2003 Mar 03–05 | 52701.15–52701.27 | 8 | — | — | — |
| 51 | 2003 Mar 15–17 | 52714.85–52714.96 | 8 | 2.2 | 4.10.4 | 9.0 |
| 54 | 2003 Mar 24–26 | 52722.85–52722.93 | 6 | 2.3 | 4.10.4 | 8.0 |
| 55 | 2003 Mar 27–29 | 52727.64–52727.67 | 4 | — | — | — |
| 59 | 2003 Apr 08–10 | 52737.03–52737.10 | 4 | — | — | — |
| 62 | 2003 Apr 17–19 | 52746.01–52746.04 | 10 | 7.3 | 3.90.4 | 8.6 |
| 67 | 2003 May 01–04 | 52761.26–52762.45 | 8 | 6.5 | 5.90.5 | 12.6 |
| 70 | 2003 May 10–13 | 52769.93–52770.10 | 12 | — | 4.1 | |
| 74 | 2003 May 22–25 | 52781.92–52782.12 | 14 | — | 2.7 | |
| 79 | 2003 Jun 06–09 | 52796.88–52797.07 | 14 | — | — | — |
| 82 | 2003 Jun 15–18 | 52805.94–52806.15 | 14 | 2.1 | 3.20.3 | 9.5 |
| 87 | 2003 Jun 30–Jul 03 | 52820.92–52821.08 | 12 | 6.5 | 5.10.4 | 11.2 |
| 92 | 2003 Jul 15–18 | 52835.84–52836.00 | 12 | — | — | — |
| 142 | 2003 Dec 12–14 | 52985.44–52985.60 | 12 | — | — | — |
| 145 | 2003 Dec 21–23 | 52994.41–52994.62 | 12 | — | 2.9 | |
| 153 | 2004 Jan 14–16 | 53019.25–53019.45 | 14 | — | — | — |
| 162 | 2004 Feb 10–12 | 53045.49–53045.69 | 14 | — | — | — |
| 177 | 2004 Mar 26–29 | 53090.55–53091.48 | 16 | — | — | — |
| 181 | 2004 Apr 07–10 | 53102.88–53103.05 | 15 | — | — | — |
| 185 | 2004 Apr 19–22 | 53114.56–53114.70 | 13 | — | — | — |
| 189 | 2004 Apr 30–33 | 53126.47–53126.63 | 15 | — | 4.8 | |
| 193 | 2004 May 12–15 | 53138.39–53138.42 | 4 | — | — | — |
| 202 | 2004 Jun 08–11 | 53165.48–53165.67 | 15 | — | — | — |
| 210 | 2004 Jul 02–05 | 53189.33–53189.51 | 15 | — | — | — |
| 229 | 2004 Aug 29–Sep 01 | 53246.96–53247.13 | 15 | — | — | — |
| 233 | 2004 Sep 09–12 | 53258.01–53258.80 | 8 | — | — | — |
| 234 | 2004 Sep 12–15 | 53260.99–53261.92 | 17 | — | — | — |
Archived RXTE/PCA lightcurves of four long observations made between 2001 October 12 and 20 have also been used. The Proportional Counter Array, PCA, consists of five co-aligned Xenon proportional counter units with a total effective area of 6000 cm2 and a nominal energy range from 2 keV to over 60 keV (Jahoda et al. jahoda96 (1996)). In order to produce lightcurves only the top Xenon layer in standard2 mode was used. The durations of these observations range from 17.7 to 29.8 ks and the complete integration time spans 100 ks. A more detailed description of these observations is given in Torrejón et al. (torrejon04 (2004)).
2.2 Radio observations
We observed 4U~2206+54 with the NRAO444The National Radio Astronomy Observatory is a facility of the National Science Foundation operated under cooperative agreement by Associated Universities, Inc. Very Large Array (VLA) at 8.4 GHz (3.6 cm wavelength) on two different epochs: 2003 May 12 from 7:05 to 8:00 and from 11:40 to 12:52 UT (average MJD 52771.4, during INTEGRAL revolution 70) with the VLA in its D configuration, and 2003 May 20 from 15:27 to 17:20 UT (MJD 52779.7, during INTEGRAL revolution 73) with the VLA during the reconfiguration from D to A. The observations were conducted devoting 10 min scans on 4U~2206+54, preceded and followed by 2 min scans of the VLA phase calibrator 2250+558. The primary flux density calibrator used was 1331+305 (3C~286). The data were reduced using standard procedures within the NRAO aips software package.
3 Results
3.1 High Energies
3.1.1 Timing
Analysis of the X-ray lightcurves clearly shows that the source is variable on all timescales. However, except from the 9.6 d modulation observed in RXTE/ASM data (see Corbet & Peele corbet01 (2001); Ribó et al. ribo05 (2005)) and believed to be the orbital period, no other periodic variability has been detected so far. Unfortunately, the INTEGRAL coverage of the source is not enough to test the presence of the orbital periodicity. Therefore, orbital period analysis is out of the scope of this paper.
Pulse period analysis gave negative results for both our ISGRI and JEM-X datasets. This was expected, as previous searches on similar timescales had also failed (see NR01, Corbet & Peele corbet01 (2001), Torrejón et al. torrejon04 (2004) and Masetti et al. masetti04 (2004)).
ISGRI data from consecutive pointings were joined together when possible and rebinned to 50 s to search for possible longer periods. Nothing was found up to periods of 1 h. The 20–40 keV lightcurve and power spectrum for a time-span of 6950 seconds during revolutions 67 and 87 can be seen in Fig. 1. The difference between the two lightcurves and between the corresponding power spectra is apparent. A quasi-periodic feature at 0.002 Hz (500 s) can be seen in data from revolution 87, but it is not present at other epochs. The timing behaviour of the source seems to be different in every pointing.

Little attention has been paid so far to intermediate periods (of the order of hours), perhaps because intermediate periods would be difficult to detect in the RXTE/ASM data, especially when points are filtered and rebinned as one day averages to keep statistical significance. We therefore searched the RXTE/PCA lightcurves described in Sect. 2.1 for intermediate period pulsations to test the possible presence of a slowly rotating NS. Unfortunately, the gaps due to the satellite low-Earth orbit are rather large in comparison to the periods searched, which certainly hampers somewhat the search. We used epoch folding and Lomb-Scargle periodogram techniques with negative results. We show in Fig. 2 the power spectrum analysis of the whole time span. No significant period is detected, particularly in the interval [0.95–5.5] Hz, which corresponds to periods from 3 hours to 30 minutes, approximately.

Searching inside individual observations, we found some periodicities, although with low significance. Inside the RXTE/PCA 60071-01-03 observation we find a possible period of 6900 s while in observation 60071-01-04 we find 8620 s. Folding the entire lightcurve on either of these periods results in no pulsed signal. We conclude therefore that the analysis of the entire lightcurve does not deliver any significant period in the range explored. This result leaves only the possibility of a period in the range from some hours to 1 d to be explored. In order to do this, a suitable long observation with a high Earth orbit satellite, like INTEGRAL, would be required.
We show in Fig. 3 the long-term lightcurves of 4U~2206+54 in different energy ranges, from the 2–12 keV of the RXTE/ASM data up to 80 keV for the ISGRI data, spanning 120 d. As can be seen in the 20–40 keV lightcurve, an increase in brightness occurred during revolution 67 (MJD 52761.36). The source brightness increased threefold over a timespan of the order of half an hour (see also the top left panel in Fig. 1).

3.1.2 Spectral Analysis
From the whole timespan during which ISGRI collected data from 4U~2206+54, the source was inside both the Fully Coded Field Of View (FCFOV) of ISGRI and the JEM-X FOV only during one pointing in revolution 67 and 3 pointings in revolution 87. Therefore, the available spectrum from revolution 67 and the mean spectrum from revolution 87 were used for the spectral analysis. Systematic errors of 10% for ISGRI and 5% for JEM-X were added to our data sets in order to perform a more realistic spectral analysis555Private communication from the teams of the instruments.. The software package used was xspec 11.2 (Arnaud arnaud96 (1996)).
With the aim of comparing with previously published data, the comptonisation model of Sunyaev & Titarchuk (sunyaev80 (1980)), improved by Titarchuk (titarchuk94 (1994)) including relativistic effects, implemented in xspec as compTT, and a powerlaw model, modified to include photon absorption and a high energy cut-off, were chosen to fit the data. For the comptonisation model, the emitting region temperatures derived were 103 and 138 keV for the data of revolutions 67 and 87, respectively. The fits were acceptable, with corresponding of 1.3 for 173 degrees of freedom (DOF) in the first observation, and of 1.2 for 176 DOF in the second observation. The powerlaw parameters of both observations are listed in Table 2.
| Ref. (Mission, year) | Flux 10-10 | Energy range | ||||||
|---|---|---|---|---|---|---|---|---|
| (keV) | (keV) | (atom cm-2) | (DOF) | (erg s-1 cm-2) | (keV) | (keV) | ||
| Negueruela & Reig negueruela01 (2001) (RXTE, 1997) | 1.70.3 | 7.40.2 | 17.50.8 | 4.70.2 | 0.9(56) | 4.8 | 2.5–30 | not reported |
| Corbet & Peele corbet01 (2001) (RXTE, 1997-1) | 1.710.03 | 7.30.1 | 17.30.6 | 4.60.2 | 0.82a | 3.1 | 2–10 | not reported |
| (RXTE, 1997-2) | 1.120.12 | 5.30.2 | 10.51.2 | 2.70.7 | 0.75a | 1.1 | 2–10 | not reported |
| Torrejón et al. torrejon04 (2004) (RXTE, 1997) | 1.60.1 | 7.60.4 | 16.31.2 | 4.50.4 | 0.71(52) | 2.7 | 2–10 | not reported |
| (RXTE, 2001) | 1.60.1 | 4.30.3 | 202 | 4.60.1 | 1.27(49) | 1.3 | 2–10 | 29b |
| (BeppoSAX, 1998) | 1.00.2 | 7.80.5 | 113 | 1.10.3 | 1.32(113) | 0.4 | 2–10 | 355b |
| Masetti et al. masetti04 (2004) (BeppoSAX, 1998) | 0.95 | 4.3 | 10.6 | 0.88 | 1.1(219) | 0.4 | 2–10 | 355c |
| This paper (INTEGRAL, 2003, Rev. 67) | 1.80.7 | 135 | 226 | 1.0 (fixed) | 1.2(154) | 15.9 | 4–150 | 325 |
| This paper (INTEGRAL, 2003, Rev. 87) | 1.7 | 115 | 29 | 1.0 (fixed) | 1.0(153) | 8.3 | 4–150 | 323 |
a No information about the DOF is reported in the reference. b No significance reported. c At 2 confidence level.
Both models yield a 4–150 keV flux of 1610-10 erg s-1 cm-2 for revolution 67 and 810-10 erg s-1 cm-2 for revolution 87. Assuming a distance to the source of 3 kpc (NR01), its luminosity amounts to 1.71036 erg s-1 and 0.91036 erg s-1, respectively. Around 50% of the total luminosity lies in the 4–12 keV energy band, that is 8.51035 erg s-1 for revolution 67 and 4.51035 erg s-1 for revolution 87. We notice that during these observations the source appears brighter than in any previous observation. The RXTE/ASM lightcurve confirms that the flux was high in the 2–12 keV band as well.
We show in Fig. 4 the INTEGRAL spectra of 4U~2206+54 for revolutions 67 and 87. Both spectra suggest the presence of an absorption feature around 30 keV, as already noticed by Torrejón et al. (torrejon04 (2004)) and Masetti et al. (masetti04 (2004)) in RXTE and BeppoSAX data, see Table 2. An absorption feature through the cyclabs model (in xspec notation) was added to the powerlaw model. In the revolution 67 spectrum, the absorption feature was fitted at an energy of 325 keV for a fixed line width of 3 keV. The same feature is apparent in the spectrum from revolution 87, where it was fitted at 323 keV 666An F-test was applied to the spectral fits of revolution 87, wich has a better signal to noise ratio than that of revolution 67. The improvement of the by the inclusion of a cyclabs component has a 12% probability of ocurring by chance. One should take into account the limitations of this test when applied to lines (Protassov et al. protassov02 (2002)). Except for the normalization factors, the fitted parameters to the datasets of both revolutions are compatible between them within the errors (see Table 2).

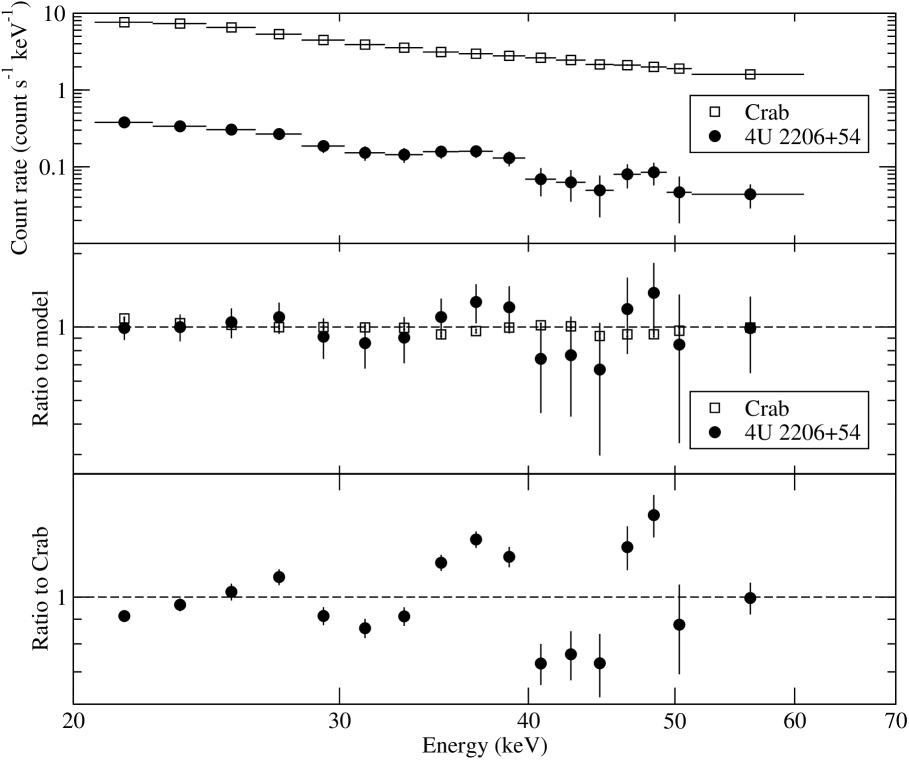
There are well known calibration problems in the ISGRI Response Matrix Function (RMF) that may cast some doubts about the reality of the absorption feature reported here. In order to investigate if this feature is an instrumental effect, we normalised the 20–60 keV spectra of 4U~2206+54 and Crab to their respective continua modeled by a powerlaw, and then divided the normalised 4U~2206+54 spectrum over that of the Crab. We have chosen a Crab observation as close in time as possible to our data and with similar off-axis angles, to ensure that the RMF and off-axis effects are as much similar as possible. We show in Fig. 5 the observed spectra (top panel), their ratio to the powerlaw model (middle panel), and the ratio between the former ratios (bottom panel). The absorption feature around 32 keV is still seen. The quality of the data does not allow us to state that the detection is statistically significant, but the likely presence of a feature at this position had already been reported in the analysis of two other independent datasets obtained by two different satellites (see Table 2). As it has been seen by three different instruments at different times, the existence of this absorption feature is strongly suggested. Such features in X-ray spectra are generally attributed to Cyclotron Resonance Scattering Features (CRSFs) (see, e.g., Coburn et al. coburn02 (2002) and references therein).
Motivated by the possible presence of this CRSF, we have summed up images from those INTEGRAL revolutions with significant ISGRI detections. The effective exposure time of this mosaic amounts to 27 ks, and we show its extracted spectrum in Fig. 6. We note that spectral shape changes with luminosity have been reported in Saraswat & Apparao (saraswat92 (1992)) and NR01. Therefore, by summing up data taken on different epochs we might be losing spectral shape information. However, our goal is not to study the shape of the continuum, but to achieve an improved signal to noise ratio at the CSRF position, which is suggested by both the revolution 67 and revolution 87 spectra to be at 32 keV. The best fit to the continuum of the new spectrum was a comptonisation model of soft photons by matter undergoing relativistic bulk-motion, i.e. bmc in xspec notation (Shrader & Titarchuk shrader99 (1999)), which provided a of 1.7 for 6 degrees of freedom (see top panel in Fig. 6). We added a CSRF absorption feature, by using the xspec cyclabs model, at 322 keV to the bmc model, and obtained a slightly improved fit with of 1.3 for 5 degrees of freedom. Finally, we also fitted the data by adding a Lorentzian profile in absorption to the bmc model. In this case the lowered to 1.1 for 5 degrees of freedom (see bottom panel in Fig. 6). The center of the line was located at 31.50.5 keV and its FWHM was found to be 0.0150.005 keV. The normalization of the line, 1.510-3 count s-1 keV-1 at a 68% confidence level (1), yields a significance of the line of 2777The significance of the CRSF detection could not be derived from the individual analysis of revolutions 67 and 87, due to the poor improvement of the statistics obtained when adding the CRSF component in both cases. We can only state the significance of the detection after the nice improvement in the signal-to-noise ratio achieved by the mosaic.. We note that the significance of this detection might be somehow influenced by changes in the continuum during the different observations. On the other hand, although the significance depends as well on the model chosen to fit the continuum, any model that properly fits the obtained continuum will reveal the presence of a 2 absorption around 32 keV, as can be seen from the data of Fig. 6. Thus we can conclude that the presence of a CRSF is strongly suggested by the data. This result, when combined with the previous claims after BeppoSAX and RXTE data (Torrejón et al. torrejon04 (2004); Masetti et al. masetti04 (2004)) gives evidence for the presence of this CSRF in 4U~2206+54.

3.2 Radio
No radio emission at 8.4 GHz was detected, with a 3 upper limit of 0.042 mJy on 2003 May 12 (MJD 52771.4) and a 3 upper limit of 0.066 mJy on 2003 May 20 (MJD 52779.7). We concatenated all the data and obtained a final 3 upper limit of 0.039 mJy. The resulting image is shown in Fig. 7.

4 Discussion
4.1 Conflicts in the neutron star scenario
The aperiodic variability of the X-ray emission from 4U~2206+54 favours the idea that the X-ray source is powered by wind-fed accretion onto a compact object. The X-ray luminosity of the source combined with its X-ray spectral shape likely excludes the possibility of a white dwarf (see, e.g., de Martino et al. demartino04 (2004) for accreting white dwarf X-ray spectra). The compact object must be, therefore, a neutron star or black hole.
There are two main difficulties for accepting 4U~2206+54 as a typical wind-accreting neutron star. The first one is the lack of pulsations, as most other wind-fed systems are X-ray pulsars. In principle, this might result from a geometrical effect: if the angle between the spin axis and the magnetic axis of the neutron star is close to zero or the whole system has a very low inclination angle, all the high-energy radiation seen could be coming from a permanently observed single pole of the neutron star. The system inclination is unlikely to be very small, as the projected for the optical companion is not particularly small (NR01), unless there is a very strong misalignment between the rotation axis of the optical star and the orbit. However, if the angles between the spin and magnetic axes of neutron stars are drawn from a random distribution, there is a non-negligible chance that for some systems they will be aligned. Similar scenarios have been proposed to explain the absence of pulsations from 4U~1700$-$37 (White et al. white83 (1983)) and also from the low-mass X-ray binary 4U~1700+24 (Masetti et al. masetti02 (2002)), though in the latter case there is no conclusive evidence that this system is sufficiently young to show pulsations.
The second, stronger argument is the expected X-ray luminosity. We can consider a canonical neutron star with 10 km radius and 1.4 accreting from the fast wind of a low-luminosity O9 III–V star in a 9.6 d orbit. Following the Bondi-Hoyle approximation, the accretion luminosity obtained, which is an upper limit to the X-ray luminosity, is 11034 erg s-1 (see Reig et al. reig03 (2003) for details about the method). In contrast, the observed X-ray luminosity of 4U~2206+54 is in the range 1035–1036 erg s-1, therefore comparable to those of HMXBs with OB supergiant donors (see Negueruela negueruela04 (2004) and references therein), which are believed to have mass-loss rates more than one order of magnitude higher than a O9 III–V star (Leitherer leitherer88 (1988); Howarth & Prinja howarth89 (1989)). In addition, we note that our estimate for the semimajor axis of 4U~2206+54, of 55–60 , is comparable to the highest values of semimajor axes in supergiant systems (see Kaper et al. kaper04 (2004)). Therefore, a close orbit cannot be invoked to solve the problem of the high X-ray luminosity.
4.2 Excluding the black hole scenario
If a black hole was present in the system, the photon index and luminosities of our INTEGRAL observations would indicate that the source is in a low/hard state (see McClintock & Remillard mcclintock04 (2004) and references therein). Our radio observations took place on 2003 May 12 and 20, or during INTEGRAL revolutions 70 and 73, i.e., right between INTEGRAL observations at revolutions 67 (2003 May 01–04) and 87 (2003 Jun 30–Jul 03).
Gallo et al. (gallo03 (2003)) found an empirical correlation between the soft X-ray flux (in the range 2–11 keV) and the centimetre radio emission (with observed flat spectrum in the range 4.9–15 GHz) for black hole binary systems in the low/hard state, of the form: , where is the radio flux density scaled to 1 kpc, is the X-ray flux in Crab units scaled to 1 kpc, and the uncertainty in the multiplying factor is the non-linear 1 error of their fit. Therefore, by using a measured X-ray flux we can compute the expected radio emission of a source in case it is a black hole.
We obtained the flux from 4U~2206+54 in the 2–11 keV band from our JEM-X data, being 7.2 and 4.0 erg s-1 cm-2 for the 2003 May and June observations, respectively. This flux was translated to Crab units by measuring the flux from the Crab in the 2–11 keV band, using JEM-X data from an INTEGRAL observation close in time to our 4U~2206+54 pointings. The Crab flux was found to be erg s-1 cm-2, leading to fluxes of 40 and 22 mCrab for 4U~2206+54 during revolutions 67 and 87, respectively. From this, and using atom cm-2 (average of the values obtained by Torrejón et al. torrejon04 (2004) and Masetti et al. masetti04 (2004) from BeppoSAX data) we computed the unabsorbed corrected flux following equation (1) of Gallo et al. (gallo03 (2003)), and then the resulting flux in Crab units scaled to 1 kpc distance (assuming a distance of 3 kpc to 4U~2206+54). The relation discussed above then predicts a radio flux density, already scaled back again to 3 kpc, of 12.68.8 mJy at the time of revolution 67 and of 8.35.8 mJy for revolution 87 (where the errors come directly from the 1 uncertainties given in Gallo et al. gallo03 (2003) for the parameters of their fit). Thus, for revolution 67 the expected radio emission would be in the range 3.8–21.4 mJy, and for revolution 87 in the range 2.5–14.2 mJy.
We note that the lower expected radio flux density of 2.5 mJy is already more than 60 times greater than the 0.039 mJy 3 upper limit found with our VLA observations. Obviously, it can be argued that our observations were not simultaneous. During revolution 70 (which was in coincidence with the first radio observations) the flux found from ISGRI data is not significant enough and, unfortunately, the source was outside the FOV of JEM-X, which could have provided an X-ray flux suitable for this analysis. Nevertheless, we point out that the RXTE/ASM count rate during our first radio observation is very similar to that measured during revolution 87, so it is reasonable to compare the obtained 2.5 mJy limit with our measured 0.042 mJy 3 upper limit on that day, giving again a difference of a factor 60. It could also be argued that the source could have experienced a transition to the high/soft state, that would naturally prevent the detection of radio emission. However, in such a case the RXTE/ASM count rates should have increased considerably, while during both radio observations the count rates were similar or lower than during revolutions 67 and 87, when the photon indexes were typical of low/hard states. In summary, if the correlation between X-ray emission and radio emission reflects indeed a general property of black hole systems, we conclude that there is not a black hole in 4U~2206+54.
Moreover, Fender & Hendry (fender00 (2000)) show that all Galactic persistent black holes have detectable radio emission. As 4U~2206+54 is a persistent source and does not show any detectable radio emission, it cannot host a black hole. Systems containing magnetised neutron stars ( G), on the other hand, do not show detectable radio emission.
4.3 The cyclotron feature
The indication of a cyclotron feature centred at 32 keV strongly suggests that there is a magnetic neutron star in 4U~2206+54, in good agreement with the lack of radio emission. INTEGRAL is the third mission reporting the likely detection of this absorption feature (see Table 2) and, even if none of the detections can be considered statistically significant, the fact that it appears in three independent datasets cannot be ignored.
If the line is indeed a CRSF we can compute the value of the magnetic field in the scattering region by means of the equation , being the gravitational redshift at which we see the region. Considering that the line is produced at the surface of a canonical neutron star of 1.4 with a radius of 10 km, the gravitational redshift amounts to =0.3 (see, e.g., Kreykenbohm et al. kreykenbohm04 (2004)), and from the position of the line centre at 32 keV we obtain a magnetic field of G. This value, in agreement with those found by Torrejón et al. (torrejon04 (2004)) and Masetti et al. (masetti04 (2004)), is typical of magnetic neutron stars, and well within the range of – G obtained by Coburn et al. (coburn02 (2002)) for a sample of ten X-ray pulsars displaying CRSFs (see their table 7).
One is led to the conclusion that 4U~2206+54 is the first system known in which an accreting magnetic neutron star does not appear as an X-ray pulsar. In principle, the possibility of very slow pulsations cannot be discarded. The wind-accreting X-ray source 2S~0114+650, with a B1 supergiant donor (Reig et al. reig96 (1996)), shows pulsations with a period of 2.8 h (Finley et al. finley94 (1994)). The orbital period of the system is 12 d, similar to that of 4U~2206+54. Our timing analysis rules out the possibility of significant pulsations from 4U~2206+54 in the range 0.5–3.0 h. A modulation at a period of several hours is still possible, as existing datasets do not constrain strongly this period range. However, it seems more logical to conclude that geometrical effects are responsible for the lack of pulsations.
5 Conclusions
We present the first INTEGRAL GPS results on 4U~2206+54 together with contemporaneous VLA observations of the source. A broad high-energy spectrum (4–150 keV), joining JEM-X and ISGRI data, has been extracted and fitted with spectral models similar to those used in the analysis of previously published data obtained with other satellites. The evidence for the presence of a cyclotron line is furthered, as INTEGRAL becomes the third high-energy mission to observe a possible feature at 323 keV. If the feature is indeed a cyclotron line, it indicates a magnetic field strength of G, typical of magnetised neutron stars.
Our VLA radio observations fail to detect the source at a very low level, indicating that any possible radio emission is at least 60 times weaker than what would be expected from a black hole system in the low/hard state. This lack of radio detection is again compatible with the presence of a magnetised neutron star. 4U~2206+54 appears to be the first known system containing an accreting neutron star that does not show up as an X-ray pulsar, most likely due to a simple geometrical effect.
Longer high-energy exposures, such as an INTEGRAL long pointing, are needed to improve the S/N ratio to a level that will allow the confirmation of the presence of the cyclotron feature and the study of its eventual profile and energy changes with time and luminosity. Such observation would also allow the search for very long (several hours) or very weak pulsations.
Acknowledgements.
We are grateful to the VLA Scheduling Committee, which allowed us to conduct the observations as an ad hoc proposal. We thank Silvia Martínez Núñez for very useful discussions about JEM-X data and Elena Gallo for useful clarifications on the X-ray/radio correlation. We acknowledge useful comments and clarifications from Nicolas Produit and INTEGRAL Science Data Center members. We acknowledge an anonymous referee for detailed and useful comments that helped to improve the paper. This research is supported by the Spanish Ministerio de Educación y Ciencia (former Ministerio de Ciencia y Tecnología) through grants AYA2001-3092, ESP-2002-04124-C03-02, ESP-2002-04124-C03-03 and AYA2004-07171-C02-01, partially funded by the European Regional Development Fund (ERDF/FEDER). P.B. acknowledges support by the Spanish Ministerio de Educación y Ciencia through grant ESP-2002-04124-C03-02. M.R. acknowledges support by a Marie Curie Fellowship of the European Community programme Improving Human Potential under contract number HPMF-CT-2002-02053. I.N. is a researcher of the programme Ramón y Cajal, funded by the Spanish Ministerio de Educación y Ciencia and the University of Alicante, with partial support from the Generalitat Valenciana and the European Regional Development Fund (ERDF/FEDER). This research has made use of the NASA’s Astrophysics Data System Abstract Service, and of the SIMBAD database, operated at CDS, Strasbourg, France.References
- (1) Arnaud, K. A. 1996, in Astronomical Data Analysis Software and Systems V, ASP Conf. Ser., 101, 17
- (2) Bildsten, L., Chakrabarty, D., Chiu, J., et al. 1997, ApJS, 113, 367
- (3) Clark, J. S., Reig, P., Goodwin, S. P., et al. 2001, A&A, 376, 476
- (4) Clark, J. S., Goodwin, S. P., Crowther, P. A., et al. 2002, A&A, 392, 909
- (5) Coburn, W., Heindl, W. A., Rothschild, R. E., et al. 2002, ApJ, 580, 394
- (6) Condon, J. J., Cotton, W. D., Greisen, E. W., et al. 1998, AJ, 115, 1693
- (7) Corbet, R. H. D., & Peele, A. G. 2001, ApJ, 562, 936
- (8) Diehl, R., Baby, N., Beckmann, V., et al. 2003, A&A, 411, L117
- (9) de Martino, D., Matt, G., Belloni, T., Haberl, F., & Mukai, K. 2004, A&A, 419, 1009
- (10) Fender, R. P., & Hendry, M. A. 2000, MNRAS, 317, 1
- (11) Finley, J. P., Taylor, M., & Belloni, T. 1994, ApJ, 429, 356
- (12) Gallo, E., Fender, R. P., & Pooley, G. G. 2003, MNRAS, 344, 60
- (13) Goldwurm, A., David, P., Foschini, L., et al. 2003, A&A, 411, L223
- (14) Howarth, I. D., & Prinja, R. K. 1989, ApJS, 69, 527
- (15) Jahoda, K., Swank, J. H., Giles, A. B., et al. 1996, in EUV, X-ray, and Gamma-Ray Instrumentation for Astronomy VII, ed. O. H. Siegmund, & M. A. Gummin, SPIE, 2808, 59
- (16) Kaper, L., van der Meer, A., & Tijani, A. H. 2004, in Proc. of IAU Colloquium 191, Revista Mexicana de Astronomía y Astrofísica (Serie de Conferencias), Vol. 21, p. 128
- (17) Kreykenbohm, I., Wilms, J., Coburn, W., et al. 2004, A&A, 427, 975
- (18) Leitherer, C. 1988, ApJ, 326, 356
- (19) Maraschi, L., & Treves, A. 1981, MNRAS, 194, 1P
- (20) Martocchia, A., Motch, C., & Negueruela, I. 2005, A&A, 430, 245
- (21) Masetti, N., Dal Fiume, D., Cusumano, G., et al. 2002, A&A, 382, 104
- (22) Masetti, N., Dal Fiume, D., Amati, L, et al. 2004, A&A, 423, 311
- (23) Massi, M., Ribó, M., Paredes, J. M., et al. 2004, A&A, 414, L1
- (24) McClintock, J. E., & Remillard, R. A. 2004, in Compact Stellar X-Ray Sources, ed. W. H. G. Lewin & M. van der Klis (Cambridge University Press) in press [arXiv:astro-ph/0306213]
- (25) McSwain, M. V., Gies, D. R., Huang, W., et al. 2004, ApJ, 600, 927
- (26) Negueruela, I., & Reig, P. 2001, A&A, 371, 1056 (NR01)
- (27) Negueruela, I. 2004, in proceedings of ’The Many Scales of the Universe-JENAM 2004 Astrophysics Reviews, Kluwer Academic Publishers, eds. J. C. del Toro Iniesta et al., [arXiv:astro-ph/0411759]
- (28) Paredes, J. M., Martí, J., Ribó, M., & Massi, M. 2000, Science, 288, 2340
- (29) Paredes, J. M., Ribó, M., Ros, E., Martí, J., & Massi, M. 2002, A&A, 393, L99
- (30) Protassov, R., van Dyk, D. A., Connors, A., Kashyap, V. L., & Siemiginowska, A. 2002, ApJ, 571, 545
- (31) Reig, P., Chakrabarty, D., Coe, M. J., et al. 1996, A&A, 311, 879
- (32) Reig, P., Ribó, M., Paredes, J. M., & Martí, J. 2003, A&A, 405, 285
- (33) Ribó, M., Reig, P., Martí, J., & Paredes, J. M. 1999, A&A, 347, 518
- (34) Ribó, M., Negueruela, I., Torrejón, J. M., Blay, P., & Reig, P. 2005, A&A, submitted
- (35) Saraswat, P., & Apparao, K. M. V. 1992, ApJ, 401, 678
- (36) Shrader, C. R. & Titarchuk, L. 1999, ApJ, 521, L121
- (37) Skinner, G., & Connell, P. 2003, A&A, 411, L123
- (38) Sunyaev, R. A., & Titarchuk, L. G. 1980, A&A, 86, 121
- (39) Titarchuk, L. 1994, ApJ, 434, 570
- (40) Torrejón, J. M., Kreykenbohm, I., Orr, A., Titarchuk, L., & Negueruela, I. 2004, A&A, 423, 301
- (41) Westergaard, N. J., Kretschmar, P., Oxborrow, C. A., et al. 2003, A&A, 411, L257
- (42) White, N. E., Swank, J. H., & Holt, S. S. 1983, ApJ, 270, 711
- (43) Winkler, C., Courvoisier, T. J.-L., Di Cocco, G., et al. 2003, A&A, 411, L1