Intracluster stars in the Virgo cluster core
Abstract
We have investigated the properties of the diffuse light in the Virgo cluster core region, based on the detection of intracluster planetary nebulae (PNe) in four fields. We eliminate the bias from misclassified faint continuum objects, using improved Monte Carlo simulations, and the contaminations by high redshift Ly galaxies, using the Ly luminosity function in blank fields. Recent spectroscopic observations confirm that our photometric PN samples are well-understood. We find that the diffuse stellar population in the Virgo core region is inhomogeneous on scales of : there exist significant field-to-field variations in the number density of PNe and the inferred amount of intracluster light, with some empty fields, some fields dominated by extended Virgo galaxy halos, and some fields dominated by the true intracluster component. There is no clear trend with distance from M87. The mean surface luminosity density, its rms variation, and the mean surface brightness of diffuse light in our 4 fields are LB⊙ arcmin-2, LB⊙ arcmin-2, and mag arcsec-2 respectively. Our results indicate that the Virgo cluster is a dynamically young environment, and that the intracluster component is associated at least partially with local physical processes like galaxy interactions or harassment. We also argue, based on kinematic evidence, that the so-called ’over-luminous’ PNe in the halo of M84 are dynamically associated with this galaxy, and must thus be brighter than and part of a different stellar population from the normal PN population in elliptical galaxies.
1 Introduction
The study of the intracluster light (ICL) began with Zwicky’s (1951) claimed discovery of an excess of light between galaxies in the Coma cluster. Its low surface brightness ( mag arcsec-2) makes it difficult to study the ICL systematically (Oemler 1973; Thuan & Kormendy 1977; Bernstein et al. 1995; Gregg & West 1998; Gonzalez et al. 2000). A new approach was recently taken by Zibetti et al. (2005), who stacked a large number of SDSS images to reach deep surface brightness levels. In nearby galaxy clusters, intracluster planetary nebulae (ICPNe) can be used as tracers of the ICL; this has the advantage that detection of ICPNe is possible with deep narrow-band images, and that also the ICPN radial velocities can be measured to investigate the dynamics of the ICL component. ICPN candidates have been identified in Virgo (Arnaboldi et al. 1996, 2002, 2003; Feldmeier et al. 1998, 2003a, 2004) and Fornax (Theuns & Warren 1997), with significant numbers of ICPN velocities beginning to become available (Arnaboldi et al. 2004).
The overall amount of ICL in galaxy clusters is still a matter of debate. However, there is now observational evidence that it may depend on the physical parameters of clusters, with rich galaxy clusters containing 20 or more of their stars in the intracluster component (Gonzalez et al 2000; Gal-Yam et al. 2003), while the Virgo cluster has a fraction of in ICL (Ferguson et al. 1998; Durrell et al. 2002; Arnaboldi et al. 2002, 2003; Feldmeier et al. 2004), and the fraction of detected intragroup light (IGL) is 1.3 in the M81 group (Feldmeier et al. 2003b) and less than 1.6 in the Leo I group (Castro-Rodríguez et al. 2003). Recent hydrodynamical simulations of galaxy cluster formation in a CDM cosmology have corroborated this observational evidence: in these simulated clusters, the fraction of ICL increases from in clusters with to up to 50 for very massive clusters with (Murante et al. 2004).
The mass fraction and physical properties of ICL and their dependence on cluster mass will be related with the mechanisms by which the ICL is formed. Theoretical studies predict that if most of the ICL is removed from galaxies due to their interaction with the galaxy cluster potential or in fast encounters with other galaxies, the amount of the ICL should be a function of the galaxy number density (Richstone & Malumuth 1983; Moore et al. 1996). The early theoretical studies about the origin and evolution of the ICL suggested that it might account for between 10 and 70 of the total cluster luminosity (Richstone & Malumuth 1983; Malumuth & Richstone 1984; Miller 1983; Merritt 1983, 1984). These studies were based on analytic estimates of tidal stripping, or simulations of individual galaxies orbiting in a smooth gravitational potential. Nowadays, cosmological simulations allow us to study in detail the evolution of galaxies in cluster environments (see for example Moore et al. 1996, Dubinski 1998, Murante et al. 2004, Willman et al. 2004, Sommer-Larsen et al. 2004). Napolitano et al. (2003) investigated the ICL for a Virgo-like cluster in one of these hierarchical simulations, predicting that the ICL in such clusters should be unrelaxed in velocity space and show significant substructures. The first radial velocity measurements for a substantial sample of ICPNe (Arnaboldi et al. 2004) have indeed shown significant field-to-field variations and substructures, and spatial substructures have been observed in one field in the ICPNe identified with [OIII] and H (Okamura et al. 2002).
The main goal of this paper is to estimate more reliably the amount of ICL in the core region of the Virgo cluster, and to investigate the homogeneity of the ICL distribution in this region. Previously, Ferguson et al. (1998) and Durrell et al. (2002) estimated the amount of ICL from detecting excess red giant stars in two HST images, while Arnaboldi et al. (2002, 2003) and Feldmeier et al. (2003a, 2004) obtained deep narrow-band images to detect ICPNe in several Virgo fields, and then converted to IC luminosity using the bolometric luminosity-specific PN number density for the evolved stellar populations of the M31 bulge (Ciardullo et al. 1989a) or for Virgo ellipticals (Jacoby et al. 1990). This gave estimates between 10-20 for the fraction of ICL in different fields. It is not clear at this stage whether this implies a genuine inhomogeneity, or whether there are still systematic biases in the different determinations.
Here we study ICPNe in four wide field images in the Virgo cluster core. Our observations and data reduction are described in Section 2. Then we investigate possible biases in the detection of ICPNe from narrow band surveys, and obtain a complete and homogeneous sample of ICPNe in each of the four fields (Section 3). From these data we determine the ICPN luminosity functions (Section 4) and the surface densities of ICPNe and ICL in these four fields (Section 5). Finally, we discuss the implications of our results in Section 6.
2 Observations, Data Reduction and Sampled Fields
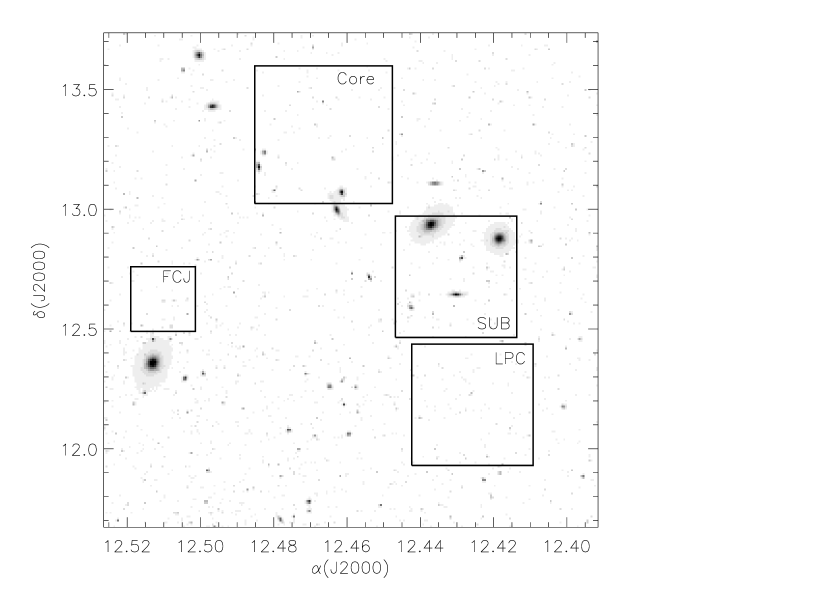
We wish to obtain in this work the average observational properties of the diffuse light in the inner region of the Virgo cluster (we will refer to this region as the core region). We have selected for this purpose four fields, located within 80 arcmin ( kpc) from the cluster center at M87111Here and in what follows we compute linear scales in Virgo with an adopted distance of 15 Mpc.. Figure 1 shows a Digital Sky Survey (DSS) image of the Virgo cluster core region, with the positions of the fields studied in this work over-plotted. The fields were observed with different telescopes and using different instrumentation, as follows.
In March 1999 we observed with the Wide Field Imager (WFI) on the ESO/MPI 2.2-m telescope a field at and ; here we will refer to this field as the Core field. The full image consists of a mosaic of eight 4k2k CCD images, covering 34′34′ on the sky. Each CCD has a pixel size of , an average read-out noise of 4.5 ADU pixel-1, and a gain of 2.2 e- ADU-1. We imaged this field through an 80Å wide filter centered at 5023Å, the wavelength of the [OIII] Å emission at the Virgo cluster mean redshift. In addition to this “on-band” filter, we also imaged in the broad V band filter (the “off-band” filter). We took 8 individual images of 3000s for the narrow band filter and 8 images of 300s for the broad band filter. Both broad and narrow band images were obtained under photometric conditions, and the seeing in the final combined images was .
In February 2001 we acquired another field with the Wide Field Camera (WFC) at the 2.5m Isaac Newton Telescope at the Roque de los Muchachos Observatory (La Palma). The central coordinates of this field are: and . The WFC detector is made of 4 CCDs with a total field of view of 34′ 34 ′. The pixel scale is , and the mean read-out noise and gain of the detectors are 6.1 ADU pixel-1 and 2.8 e- ADU-1, respectively. We will refer hereafter to this field as the La Palma core (LPC) field. The narrow band filter used in these observations was a 60Å-wide filter centered at 5027 Å. The broad band filter was centered on the B band (4407Å) and was 1022Å wide. The total exposure time was 27000 secs for the narrow band image and 5400 secs for the broad band image. The seeing in the final combined images was in both filters.
We will also analyze in the present paper the ICPNe located in one of the fields with photometry from Feldmeier et al. (1998), at and , and the ICPNe in a field one degree north of the Virgo core with photometry from Arnaboldi et al. (2002), hereafter Paper I. These will subsequently be referred to as the FCJ and RCN1 fields, respectively. The RCN1 field is located outside the Virgo core, but will be very useful for studying the ICPN density profile.
Our sample of fields in the Virgo cluster core is completed with a field located at and ; we will refer to this field as the Subaru core (SUB) field (see Arnaboldi et al. 2003, hereafter Paper II). This field was imaged with the Suprime-Cam 10k8k mosaic camera, at the prime focus of the Subaru 8.2m telescope. Images were acquired through two narrow-band filters, corresponding to [OIII] and H emission at the redshift of Virgo cluster, and two broadband filters, the standard V and R.
The data reduction and calibration of the two new fields presented in this paper (Core and LPC) were carried out as for the RCN1 field in Paper I. The data reduction was performed using the MSCRED package in IRAF. For a detailed discussion of the mosaic data reduction we refer the reader to Alcalá et al. (2002, 2004). Calibrations were obtained using several Landolt fields for the broad band filters, and spectrophotometric stars for the narrow band filters. Fluxes were then normalized to the AB magnitude system, following Theuns & Warren (1997). A detailed description of the calibration steps and the relation between AB magnitudes and the “” [OIII] magnitude introduced by Jacoby (1989) are given in Paper I for the FCJ and RCN1 fields, and in Paper II for the SUB field. The relation between AB magnitude and for the observations of the fields analyzed in the present paper are given in Table 1. In this paper we will use the notation of and to refer to the narrow-band and broadband magnitudes of the objects in the AB system. We will use to refer to the [OIII] magnitude introduced by Jacoby (1989).
Table 1 gives the main observational characteristics of the fields analyzed in this paper.
3 Photometry: catalog extraction and validation
We used the automatic procedure developed and validated in Paper I for performing the photometry and identification of emission line objects in our mosaic images, in a homogeneous fashion (see Paper I for a full description of the procedure). This procedure was applied to all fields in order to obtain the ICPN photometric candidates. The automatic extraction procedure starts with measuring the photometry of all objects in the images; this is done using SExtractor (Bertin & Arnouts 1996). All objects are plotted in a color magnitude diagram (CMD) mn-mb vs. mn, and are classified according to their positions in this diagram. The most reliable ICPNe photometric candidates are point-like sources with no detected continuum emission and observed EW222We have computed the observed equivalent width () using the expression given by Teplitz et al (2000): , where is the width of the narrow-band filters in Å, and is the color of the object, with and the narrow-band and broadband magnitudes, respectively. greater than 100Å, after convolution with the photometric errors as a function of magnitude333The fact that the selection procedure is based on the observed EW greatly reduces the contamination of the ICPNe candidate sample by [O II] emitters at whose emission lines would also fall into the narrow band filter bandpasses used for the Virgo photometry. Colless et al. (1990), Hammer et al. (1997) and Hogg et al. (1998) found no [O II] emitters at with observed EW greater than 95Å. (see Paper I for more details about the selection criteria). Figure 2 shows the CMD for the Core, FCJ and LPC fields. The final photometric ICPN catalogs, following the selection procedure explained, contain 117, 36 and 14 objects for the Core, FCJ and LPC fields, respectively (see Table 2). The ICPNe in the SUB field were selected from the two-color diagram versus , calibrated using planetaries in M84 (see Paper II for the full description of this method). The number of ICPNe detected in the SUB field was 36, and in RCN1 the number of candidates was 75 (Paper I).
The field-to-field variations observed in the number of ICPN photometric candidates are due in part to the different limiting magnitudes and areas covered by our fields. Limiting magnitudes were obtained following the simulation procedure described in Paper I. We randomly distribute point-like objects in our final co-added [OIII] images, assuming an exponential luminosity function (LF). The photometry of these objects was measured with SExtractor using the same parameters as for the real sources. We define the limiting magnitude for one of our images as the faintest magnitude at which half of the input simulated sample is still retrieved from the image. Table 1 shows the narrow-band and off-band limiting magnitudes for all fields. The number of ICPN candidates down to the respective [OIII] limiting magnitude is 77, 20, 14 and 36 for the Core, FCJ, LPC and SUB fields, and 55 for RCN1 (see Table 2).
The photometric selection methods can be spectroscopically validated by taking individual spectra of the selected candidates. This is discussed in more detail in Section 3.4 below. In the rest of this section we will study the possible sources of contaminants for the Core, FCJ, LPC, and RCN1 fields, and we will statistically subtract the number of contaminants in the photometric samples. This will provide more secure ICPNe sample sizes, as compared to Paper I.
We will not study the contaminants in the sample of emission line objects obtained in Paper II for the SUB field. This sample was selected from the detection of emission in two narrow bands ([OIII] and H). Spectroscopic confirmation was carried out in this field, for a subsample of 10 objects, at the 3.5m Telescopio Nazionale Galileo with the DOLORES spectrograph, in multi object spectroscopy (see Paper II). The result was that 8/10 photometrically selected objects were spectroscopically confirmed as emission line objects. The other 2 were not detected, probably due to astrometric problems and/or incorrect positioning of the slits (see Paper II).
3.1 Contamination by faint continuum objects
It is possible that the ICPN samples in the Core, FCJ, LPC, and RCN1 fields may be contaminated by mis-classified faint continuum objects, because of the selection based on a threshold in their [OIII] fluxes. Because of the photometric errors in their [OIII] fluxes, some objects are assigned a brighter flux than their real flux, others a fainter flux. Because also their LF rises towards faint magnitudes, a significant number of objects will have measured [OIII] magnitude brighter than (or narrow-band AB ), even though in reality they are fainter than the limiting magnitude. If in addition their fluxes in the off-band image are below the limiting magnitude of that image, these objects will appear in the region of the CMD populated by the selected ICPN candidates, and they will be counted as ICPN candidates even though they are continuum objects (faint stars). We will call this the spill-over effect from faint stars.
Near the limiting magnitude, the number of spill-over stars will be negligible if and only if the off-band image is deep enough for detecting the weak continuum flux of these faint objects. This requires that the off-band image has an AB limiting magnitude of at least
| (1) |
where is the mean photometric error of objects with magnitude equal to . This assumes that the AB-color of the stars between off-band and on-band is zero, and leaves some margin for the fact that the photometric errors will increase towards fainter magnitudes beyond . The values for our fields are 0.27, 0.24, 0.19, and 0.23 for the Core, FCJ, LPC, and RCN1 fields, respectively. Then, the corresponding off-band images should be 0.81, 0.72, 0.57, and 0.69 magnitudes deeper than the respective on-band images. Table 1 shows the actual limiting magnitudes for the on and off-band images of our fields. We can see that the off-band image in the Core field is only as deep as the Core on-band image, suggesting a significant spill-over contamination, while the RCN1, FCJ, and LPC fields have off-band images which are deeper than their on-band images by 0.55, 0.6 and 0.9 magnitudes, respectively. In these fields, we can expect that the spill-over effect will be less important.
We have performed simulations in order to quantify the spill-over effect in the Core, FCJ, LPC, and RCN1 fields. First, we selected from the photometric catalog of each field as continuum objects those with color . Then we fitted an exponential LF to these objects. For the simulations we distributed randomly on the scientific images several thousand point-like continuum sources, with the same LF as the real continuum objects but extrapolated down to . This faint-end magnitude in the simulated continuum sources is magnitudes fainter than the of the images. The simulated objects were then recovered from the images, using the same technique and criteria to measure their photometry as for all sources in the real images. Based on the catalog obtained, we finally constructed the CMD for the recovered simulated objects, as shown in Figure 3. To quantify the spill-over effect for each field, we computed the number of simulated objects that are brighter than the corresponding and are located in the region of the ICPN photometric candidates. After scaling the simulations to the same number of observed continuum objects, the final number of spill-over contaminants brighter than the (or [OIII]) limiting magnitude is 45, 4, 2, and 16 for the Core, FCJ, LPC, and RCN1 fields, corresponding to 58%, 20%, 14%, and 29% of the ICPN candidates brighter than in these fields, respectively (see also Table 2).
3.2 Missing ICPNe in the photometric samples
Due to the photometric errors, an emission line object may have smaller measured EW or fainter -magnitude than it would have intrinsically. This means that we can lose in our catalogs some of the emission line objects with intrinsic Å above the magnitude limit. To investigate this possible source of error in our final ICPN photometric samples, we have quantified the number of such objects with simulations. We randomly distributed point-like objects on the narrow-band images following an exponential LF similar to the LF of the PNe in M87 (Ciardullo et al. 1998). No broadband emissions were assigned to these objects. We measured the photometry of them just as for the real sources, and studied their distribution in the CMD. We found that 5%, 10%, 1%, and 3% of these objects are lost in our catalogs for the Core, FCJ, LPC, and RCN1 fields, respectively (see Table 2). The most important factor that determines these fractions is again the limiting magnitude of the broad-band image; in deeper V-band images, the smaller rms noise makes it less likely that an object without continuum can be assigned Å.
3.3 Contamination by background galaxies
The photometric samples of ICPNe can also be contaminated by emission line background galaxies. This is because for [OII] starburst galaxies at and Ly galaxies at their strong emission lines fall into our narrow band filter width. As pointed out before, the threshold in EW implied by our selection criteria ensures that the selected ICPN photometric samples are nearly free of [OII] contaminants (as confirmed also by the available spectroscopic follow-up observations). However, some Ly galaxies at can contaminate our ICPN photometric samples. Spectroscopic follow-up observations of ICPNe indeed found that a fraction of the ICPN candidates were Ly objects (Freeman et al. 2000, Kudritzki et al. 2000, Arnaboldi et al. 2004).
Recently, we imaged an area in the Leo group (Castro-Rodríguez et al. 2003), and extracted emission line objects using the same selection criteria as for the ICPN photometric candidates in the Core, FCJ, LPC, and RCN1 fields. The LF of the emission-line objects selected in the Leo image had a bright cut-off 1.2 mag fainter than for the LF of the PNe associated with the elliptical galaxies in the Leo group. The most plausible explanation for this result is that the selected emission-line objects in the image of the Leo group are Ly background galaxies; two of these were indeed spectroscopically confirmed as Ly galaxies (see Castro-Rodríguez et al. 2003). This gives us the opportunity to use the Leo image as a blank field to evaluate the contamination of background galaxies in our ICPN photometric catalogs444We have also simulated the spill-over effect in the Leo images. We found that only 6% of the emission line sample in this field should be due to the spill-over from faint stars.. Taking into account the differences in the surveyed areas and the narrow-band filter widths for the Leo and the other fields, we can compute the number of expected Ly contaminants brighter than the [OIII] limiting magnitude in each field, based on the surface density of emission line sources in the Leo field. The result is 20, 2, 22, and 3 expected Ly contaminants in the Core, FCJ, LPC, and RCN1 fields (see Table 2).
However, there appear to be intrinsic field-to-field variations in the surface density and luminosity function of Ly emitters. Figure 4 shows the LF of the emission objects from the Leo field, the spectroscopically confirmed Ly sample from Kudritzki et al. (2000), and the background sources from the blank field survey of Ciardullo et al. (2002a). It is important to notice that the Leo and Ciardullo et al. (2002a) fields have similar off-band limiting magnitudes. But the brightest emission objects in the Ciardullo et al. field is 0.6 mag brighter than in the Leo field, and is consistent with the brightest Ly emitters in the Kudritzki et al. (2000) sample. Using an average Ly luminosity function obtained from the Ciardullo et al. and Kudritzki et al. samples, we predict the number of Ly contaminants in the Core, FCJ, LPC, and RCN1 to be 26, 4, 16, and 26.
Thus there is no unique way to estimate the number of high-redshift emission galaxies in our photometric samples, and we have to rely on spectra as much as possible. Fortunately, the predicted number of Ly contaminants is sensitive to the assumed luminosity function only in the RCN1 field. As discussed further in the next subsection, there are very few Ly emitters in the spectroscopically confirmed emission samples of Arnaboldi et al. (2004) in the Core, FCJ, and SUB fields, down to . Based on this result, we will use the Leo blank field luminosity function to estimate the Ly fraction in these fields in Table 2 and what follows.
For the LPC field, Figure 4 shows that the bright cut-off of the emission sources is similar to the bright end of the LF in the samples of Kudritzki et al. (2000) and Ciardullo et al. (2002a), while none of these candidates is as bright as the brightest PNe observed in M87. Furthermore, the number of candidates in the LPC field is small, and is in fact smaller than the estimated number of Ly galaxies expected in this field for either of the two Ly luminosity functions, down to our magnitude limit. These facts together suggest strongly that all our candidates in this field, including the bright objects, are Ly emitters. We therefore assume in Table 2 and the subsequent discussion that the number of PNe in the LPC field is .
Finally, in the RCN1 field, we have no grounds to prefer one Ly luminosity function over the other, and will thus give the number of expected PNe in this field based on both luminosity functions.
3.4 Comparison with spectroscopic results
Arnaboldi et al. (2004) carried out the spectroscopic follow-up of our selected ICPN samples in the FCJ and Core fields, and of the ICPN candidates from Okamura et al. (2002) in the SUB field. Spectroscopic observations were done in service mode with the FLAMES spectrograph at UT2 on VLT, and exposure times were such as to ensure the detection of ICPN candidates with , equivalent to erg cm-2 sec-1 total flux in the line, with S/N.
A total of 70 fibers were allocated to candidates from the above samples with : 18/34/18 FLAMES fibers were allocated to sources brighter or equal to 27.2 in the FCJ/Core/SUB fields, respectively. Arnaboldi et al. (2004) detected a total of 15/12/13 sharp line emitters, and 0/2/0 L emitters which show one resolved asymmetric line in these FLAMES pointings. The fraction of confirmed spectra with both components of the [OIII] doublet detected was 67%/41%/18%. Given the observing conditions and S/N ratio achieved, these fractions are consistent with the assumption that all of the sharp line emitters are indeed PNe. Thus, for [OIII] fluxes such that , the contamination by background galaxies is small.
The remaining spectra in the Arnaboldi et al. (2004) observations did non show any spectral features in the range covered by FLAMES. As we have seen in the previous subsections, one should indeed expect a fraction of candidates in the candidate samples to be contaminants due to the spill-over effect, i.e. faint continuum stars erroneously classified as ICPNe because of a shallow off-band image. Thus, the predicted spectroscopic confirmation rates, given as the fraction of true ICPNe in these candidate samples, varied strongly from field to field, despite similar . The spectroscopic follow-up, as well as earlier spectroscopic observations by Kudritzki et al. (2000) and the comparison with deeper narrow band imaging in [OIII] and H (Paper II), provide direct evidence for contamination by faint stars in narrow band [OIII] ICPN surveys. Contamination from faint stars is also a possible explanation for the somewhat low spectroscopic confirmation rate for the PNe samples in ellipticals (Arnaboldi et al. 1996, 1998).
Arnaboldi et al. (2004) compared the expected spectroscopic confirmation rates based on the simulations in the present paper with those determined with FLAMES. They are in close agreement, showing that the photometric samples are now well understood. A high confirmation rate (small contamination) can be achieved when the off-band image is sufficiently deep.
4 ICPNe Luminosity Function
4.1 The necessity of deep off-band images
Figure 5 shows the LFs of the ICPN photometric candidates (full points) in all fields but LPC. We have also over-plotted the LFs of miss-classified stars (asterisks). A comparison with Figure 4 shows that the LF of the Ly galaxies has a fainter cut-off than the LF of the photometric ICPN candidates in these fields. Thus the brightest bins of the IC PNLF are free of Ly contaminants. There exist brighter Ly galaxies, but these often have a measurable continuum (Kudritzki et al. 2000). The brightest LF bins are also free of miss-classified stars in most fields; however, in the Core field the IC PNLF is affected by miss-classified stars at all magnitudes. This demonstrates again the importance of obtaining deep broad-band images. Figure 5 also contains the LF of the ICPN candidates from the SUB field, which is free of contaminants in all bins.
We have fitted the standard PNLF to the three brightest magnitude bins (not affected by contaminants) of the IC PNLF in the FCJ and RCN1 fields. The six brightest bins were considered in the fit of the IC PNLF in the SUB field. In both cases, the LF was first convolved with the photometric errors. The fitted empirical exponential LF is given by
| (2) |
where is a positive normalization constant to be determined, , and we adopt a cutoff (Ciardullo et al. 1989b, Ciardullo et al. 2002b). The resulting apparent magnitudes of the bright cutoffs (m∗) obtained from the fits are , , and for the RCN1, FCJ and SUB samples. As for reference, we report here the m∗ value fitted to the PNLF from the inner region of M87, which amounts to .
4.2 The nature of over-luminous PNe and the bright cutoff of the LF
The bright cutoff of the PNLF has been extensively used as a distance indicator in extragalactic astronomy (Ciardullo et al. 2002b). An implicit assumption of the PNLF method is that all the PNe that make up the observed luminosity function are at the same distance. In a Virgo-like cluster, its finite depth can distort the PNLF, as the ICPNe at shorter distances can contribute to the observed LF and produce a brighter cutoff, as discussed in Ciardullo et al. (1998), Arnaboldi et al. (2002), and Feldmeier et al. (2004).
However, the bright cutoff can be also affected by the age (Marigo et al. 2004) or metallicity (Dopita et al. 1992) of the stellar population. E.g., the dependence of with metallicity, (Dopita et al. 1992, Ciardullo et al. 2002b) can produce a change of the cutoff magnitude of a similar order to the reported line-of sight (LOS) distortions. The analysis of our ICPN LFs combined with the spectroscopic results of Arnaboldi et al. (2004) can clarify the relative importance of these effects.
The bright cutoff of our ICPN LF in the FCJ field is magnitudes brighter than the bright cutoff of the PNLF of M87 (Ciardullo et al. 1998). In Paper I we considered that this (substantial) difference would most plausibly be explained if the ICPNe in the FCJ field are located in front of M87. Assuming a distance of 15 Mpc for M87, the brightest of the intracluster PNe in the FCJ field would be located 2.3 Mpc in front of M87, indicating a substantial LOS depth of the Virgo cluster, consistent with other measurements.
The spectroscopic follow-up in FCJ has shown a velocity distribution which is dominated by a narrow peak related to the halo of M87 (Arnaboldi et al. 2004). In addition to this peak, there are three kinematic outliers, which are all also unusually bright, with fluxes in the bright falloff of the M87 PNLF, so that they shift the FCJ LF to a brighter cutoff. The correlation between their discrepant radial velocities and bright support the hypothesis that these are ICPNe free flying in Virgo intra-cluster space and not gravitationally bound to M87. LOS effects are therefore a viable explanation for the brighter cutoff in this field.
No spectroscopic follow-up is avaliable for the RCN1 sample yet, but the absence of bright galaxies and a very similar PNLF to that in FCJ suggest that LOS effects may be the most likely explanation for the bright cutoff in this field also, as already discussed in Paper I.
The PNLF for the ICPN sample in the SUB field differs from RCN1 and FCJ: 5 ICPNe appear to be up to 0.3 mag brighter than the remaining smoother, more regular, distribution, similar to those measured for ICPNe in FCJ and RCN1 (see Fig. 5). Can the over-luminous ICPNe in SUB be on the near side of the cluster? The spectroscopic follow-up of Arnaboldi et al. (2004) contained three of these objects and confirmed them as PNe. Their radial velocities are consistent with the dynamics of M84, however. The kinematic observations make it unlikely that these objects are 2 Mpc in front of M84; most likely they are at the same position as M84 within the Virgo cluster, and LOS effects are unimportant. Furthermore, the PNLF fit to only the remaining, smoother distribution gives a distance modulus of 30.950.15; from the LF of PNe associated directly with M84, the distance modulus of M84 is 30.98 (Jacoby et al. 1990). Thus, within the errors, M84 and the bulk of the IC stellar population in the SUB field are at the same distance.
The other alternative for the over-luminous PNe in SUB is that they came from a different stellar population, which could be either younger or of different metallicity from the main M84 stellar population (see Marigo et al. 2004). Perhaps they are associated with the infall of some dwarf galaxies into M84. Furthermore the PNe in this field show a non-uniform spatial distribution. Most of them are located in a loop near M84 (see Okamura et al. 2002). This also supports the scenario that they are associated with some harassment or infall process involving M84.
4.3 The relative distances of M87 and M84
Neilsen & Tsvetanov (2000) and West & Blakeslee (2000) have used surface brightness fluctuation (SBF) distances to consider the three-dimensional structure of the Virgo cluster ellipticals and found that most of these are arranged in a nearly co-linear structure extending Mpc from M87. The M84/M86 subgroup is falling into the Virgo cluster from behind, and is itself on the far side of the mean Virgo cluster.
We have tested the relative distance of these sub-units in Virgo based on the most recent PNe data sets obtained for these galaxies, the Ciardullo et al. (1998) sample for M87 and the Paper II data for M84. We have run a Kolmogorov-Smirnoff (KS) test of the PNLFs associated with M84 and the inner region of M87, without the over-luminous PNe. The KS test cannot exclude that the two LFs came from the same distribution function. Thus, the PNLF method based on recent PN datasets places M84 and M87 at similar distances.
5 Surface density and fraction of IC light in different fields
5.1 ICPNe in the different fields
The observations of the different Virgo fields that we have used in this study have slightly different filters, survey areas, and [OIII] limiting magnitudes. Depending on the cluster dynamics, the filter bandpass may cut out a few ICPNe; the most likely field for this is the FCJ field555For the mean redshift of the Virgo cluster and a velocity dispersion kms-1, the width of the FCJ on-band filter covers the velocities in the -1.5 to + 1.8 .. Before we compare the number density of ICPNe in these fields and derive the average amount of intracluster light in the Virgo cluster core, we should establish a sample of ICPNe with the same flux limit. To this end we multiply the number of ICPNe for each field by the factor:
| (3) |
where is given by eq. 2, and denote the absolute and the apparent magnitude of its bright cutoff, and is the [OIII] limiting magnitude in each field. In scaling the various field samples by this factor, we obtain the respective number of ICPNe down to a limiting absolute magnitude . The number of emission line candidates in the LPC field was not scaled, because we saw in Section 3.3 that they are all compatible with being Ly background galaxies. For this field we give an upper limit for the amount of the ICL, assuming that the number of ICPNe in the field is . For the Core field, we could not fit the IC PNLF, because it is contaminated by spill-over objects for all magnitudes. Thus, to compute for this field we have used the PNLF of M87 (Ciardullo et al. 1998). We have also checked that both spill-over and Ly contaminant do not affect the brightest bins of the IC PNLF of RCN1, so that the LF fitted in Paper I is still valid. We used this LF in order to scale the number of ICPNe in the RCN1 field down to . The scaling factors, final numbers, and resulting surface densities of ICPNe for the different fields are given in Table 3.
5.2 From the ICPNe surface density to surface brightness of the ICL: the parameter
In principle, determining the amount of ICL from the observed numbers of ICPNe is straightforward. From Méndez et al. (1993), if is the specific PN formation rate, in PN yr-1 , is the total bolometric luminosity of a sampled population and is the lifetime of a PN, which we take as 25,000 yr, then the corresponding number of PNe, , is
| (4) |
Theories of stellar evolution predicts that the specific PN formation rate should be stars yr, nearly independent of population age or initial mass function (Renzini & Buzzoni 1986). Every stellar system should then have PN . If the PNLF of eq. 2 is valid 8 magnitudes down from the cut-off, one can determine the fraction of PNe within 2.5 magnitudes of the cut-off, and thus define as the number of PNe within 2.5 magnitudes of associated with a stellar population of total luminosity . Approximately 1 out of 10 of these PNe are within 2.5 mags of , and following from the above assumptions, most stellar populations should have PNe (Feldmeier et al. 2004). The observed number of ICPNe can then be used to infer the total luminosity of the parent stellar population.
However, as first noticed by Peimbert (1990), observations of PN samples in galaxies show that varies strongly as a function of color. Hui et al. (1993) found that decreases by a factor of 7 from the value of measured in dwarf ellipticals like NGC 205 (Burstein et al. 1987) to observed in Virgo giant elliptical galaxies (Jacoby et al. 1990).
The amount of ICL depends directly on the adopted value of , which is thus not very well constrained and is a function of the color of the parent stellar population, currently unknown for the Virgo ICL. To take this uncertainty into account in our estimates for the IC luminosity in the different fields, we consider three plausible values for , which are i) the value appropriate for an evolved population like that of the M31 bulge (Ciardullo et al. 1989a); ii) the value determined by Durrell et al. (2002) for the intracluster red-giant branch (RGB) stars observed with HST; and iii) the values determined from the Hui et al. (1993) empirical relation. In this case the of the parent stellar population is determined from the average colors of the Virgo galaxies near the field position.
The scaling adopted in our work ensures that we have taken into account all bona-fide ICPNe within 1 mag of . We then shall use the correspondent value to infer the amount of IC luminosities in our fields; from eq.2, . Furthermore we adopt the conversion from bolometric to B-band luminosity as in Ciardullo et al. (1989a). Table 4 gives the resulting values for the B-band luminosity and surface brightness in our fields, in each case for the three values of (i-iii). The interval given by the lowest and the largest value of the luminosity (surface brightness) thus determined from the number of ICPNe in each field, is our best estimated range for the IC luminosity (surface brightness) in that field.
5.3 Field-to-field variation and the dependence with distance from the cluster center
We consider first the field-to-field variations in the number of ICPN candidates as reported in Table 3. Figure 6 shows the ICPN number densities in our fields, with their Poisson errors. The over-density observed at the FCJ field position is significant at the 2- level with respect to the number densities observed in Core and SUB. The low density of ICPNe in the LPC field is significant at the level with respect to the number densities observed in FCJ, Core and SUB. The low upper limit to the number of ICPNe in LPC confirms earlier findings by Kudritzki et al. (2000) for an adjacent field, centred at , .
The number density plot also shows no clear trend with distance from the cluster center at M87, except that the value in the innermost FCJ field is high. However, the spectroscopic results of Arnaboldi et al. (2004) have shown that 12/15 PNe in this field have a low velocity dispersion of km/s, i.e., in fact belong to the outer halo of M87, which thus extends to at least 65 kpc radius. In the SUB field, 8/13 PNe belong to the similarly cold, extended halo of M84, while the remaining PNe are observed at velocities that are close to the systemic velocities of M86 and NGC 4388, the two other large galaxies in or near this field. It is possible that in a cluster as young and unrelaxed as Virgo, a substantial fraction of the ICL is still bound to the extended halos of galaxies, whereas in denser and older clusters these halos might already have been stripped. If so, it is not inappropriate to already count the luminosity in these halos as part of the ICL. However, in Fig. 6 we also give the plot of the PN number density with radius for the case when the PNe in the outer halos of M87 and M84 are removed from the FCJ and SUB samples. In this case, the resulting number density is even more nearly flat with radius, but there are still significant field-to-field variations; particularly the remaining number density in SUB and that in LPC are low.
We next consider the luminosity densities and surface brightnesses of the ICL in our fields and their dependence on the distance from the cluster center. This introduces the additional uncertainty of the parameter; when the range of from Section 5.2 is taken into account, the total uncertainties in the luminosity density increase and differences between the various fields become less significant. Data are given in Table 4. The lower panel of Fig. 6 shows the radial variation of the surface brightness as a function of distance from M87. In the FCJ and SUB fields, we again show two points, respectively, one derived from all PNe, and one based on only the PNe that are not kinematically associated with the M87 or M84 halo. Again, there is thus no clear radial trend with distance: the ICL surface brightness in Virgo is consistent with a constant value, with the exception of the low value in the LPC field. As representative values for the surface luminosity density and the surface brightness in the Virgo core region we take the average for our 4 fields, including the M87 and M84 halo PNe, and using for each field the respective average value of in Table 4: LB⊙ arcmin-2, and mag arcsec-2. Note, however, the large LB⊙ arcmin-2, due to the field-to-field variations and the adopted range in .
Ferguson et al. (1998) and Durrell et al. (2002) measured the ICL in two HST fields near M87 by counting excess intracluster RGB stars. One can estimate the surface brightness of the underlying stellar population, given assumptions on the metallicity, age, initial mass function (IMF) and average distance for this stellar population. From the total flux associated with the 630 excess sources detected in their HST field, Ferguson et al. (1998) computed that the surface brightness and surface luminosity density of the ICL in their field 45.8 arcmin NE of M87 are mag arcsec-2, and 0.42 LB⊙ arcmin-2, respectively. Durrell et al. (2002) used the same technique in a field 42.3 arcmin NW of M87, and detected greater number of stars than Ferguson et al. (1998). From their best fit models to the luminosity function, Durrell et al. obtain and for the NE and NW HST fields, respectively. We have over-plotted these values in Figure 6. It can be seen that they are in good agreement with our inferred surface brightness, and still no clear radial trend is evident. Averaging our results and the RGB data, the mean surface luminosity density and surface brightness of the ICL in the combined fields in the Virgo core region (the RCN1 field not included) become LB⊙ arcmin-2 and 29.3 mag arcsec-2, respectively.
5.4 Luminosity fraction of the ICL in the Virgo core
Surface luminosity densities associated with both ICPNe and RGB depend for a large part on the assumed metallicity, age and IMF for the parent stellar population in the LOS. The fact that our best estimates are given as intervals in luminosities reflects a limitation in our knowledge of the stellar populations and of post-AGB stellar evolution, rather than uncertainties in the ICPN numbers from photometric catalogs, which are now well understood.
When we compare the luminosity of the ICL at the positions of our fields with the luminosity from the Virgo galaxies we add in further uncertainties, because the luminosities of nearby Virgo galaxies depend very much on the location and field size surveyed in the Virgo cluster. We therefore consider the reported intervals in surface brightness as our primary result, while the relative fractions of ICL light with respect to Virgo galaxy light are evaluated for comparison with previous ICPN works only, and we consider them as more uncertain.
Our approach is to assume that the ICL is related to local galaxies in each field, based on the spectroscopic results of Arnaboldi et al. (2004) which show the Virgo cluster to be very inhomogeneous and still dynamically young. We thus compare the luminosity of the ICL with that from the Virgo galaxies located in the field. We have obtained from the DSS archive the images centered on our fields with a radius of 120′, and convolved each image with a Gaussian with equal to the radius of our corresponding images. Then, we determined the total luminosity in an area equal to the surveyed area of each field. We thus obtained 1.67 , 1.40 , 1.76 and 4.41 for the Core, FCJ , LPC and RCN1 fields, respectively. The galaxy light in the SUB field is dominated by the three bright galaxies in this field, M86, M84 and NGC4388. Their combined luminosity is 7.2 (see Paper II). The contribution of the ICL to the total light in each field based on this local comparison is given in Table 4; the mean fraction for our 4 fields in the Virgo core is 5%. However, there are significant field-to-field variations. The fraction of ICL versus total light ranges from in the for Core and FCJ fields, to less than 1 in the LPC field, which in its low ICL fraction is similar to low density environments (Castro-Rodriguez et al. 2003).
5.5 Discussion
The data presented here constitute a sizeable sample of ICPNe in the Virgo core region, constructed homogeneously and according to rigorous selection criteria. From the study of four wide-fields in the Virgo core we obtain a mean surface luminosity density of 2.7 LB⊙ arcmin-2, LB⊙ arcmin-2, and a mean surface brightness of mag arcsec-2. Often these numbers are translated into fractions of ICL with respect to light in galaxies at the cluster positions, and our best estimate in the Virgo core is .
We can compare the amount of ICL in the Virgo cluster core region with that measured in the RCN1 field (see Paper I). The surface luminosity density and surface brightness intervals evaluated for this field are similar to those for the FCJ. The RCN1 field contains no bright galaxies, however, so these values translate into a significantly higher fraction of ICL with respect to Virgo galaxy light, about . If we include the RCN1 measurements in our average, the mean surface luminosity becomes 2.7 LB⊙ arcmin-2, LB⊙ arcmin-2 and the mean surface brightness mag arcsec-2. The average fraction of ICL with respect to Virgo cluster galaxy light then becomes .
Previous works on ICL using ICPN tracers have claimed larger average fractions for ICL in the Virgo core (, Feldmeier et al. 2004; Durrell et al. 2002), despite similar inferred surface brightnesses for the ICL as shown in Figure 6. These higher fractions reflect only a difference in the normalisation relative to the Virgo galaxy light. Furthermore, the Feldmeier et al. (2004) fields in the Virgo subcluster A are closer on average to M87 () than our fields; thus, they may be more dominated by the M87 halo, as indicated by the spectroscopic follow-up of the ICPN sample in the FCJ field (Arnaboldi et al. 2004). These radial velocity measurements indicate the presence of a stellar population at equilibrium in the M87 halo, and only of all PN candidates in the FCJ field are therefore “truly” intracluster. The spectroscopic follow-up of Arnaboldi et al. (2004) has confirmed the expected fraction of ICPN candidates in the other fields, therefore supporting our determinations from the PNe observations.
The field-to-field variations in the measured number density of ICPNe and the high value in the outer RCN1 field indicate that the ICL is still not relaxed in the cluster potential. There has not been enough time for phase-mixing to erase these variations. This poses a strong constraint on the age and origin of the ICL in the Virgo cluster core region, which must have been brought into this location not much more than a few dynamical times ago, where (Binney & Tremaine 1987)
| (5) |
and is the mean density enclosed within the field distance from the center of the cluster. We have computed using the mass distribution given by Nulsen & Bohringer (1995) for the central regions of the Virgo cluster. The dynamical times at the location of our fields are from yr for the FCJ field to yr for the LPC and SUB fields. The FCJ field has the shorter dynamical time because it is located close to M87 ( kpc). From these estimated dynamical times, phase-mixing to erase the field-to-field variations in the ICL light would take a few Gyr. The observed field-to-field variations thus suggest that the Virgo cluster is dynamically young, confirming the similar inference from the inhomogeneous radial velocity distributions by Arnaboldi et al. (2004).
Recent cosmological simulations have measured the amount of diffuse light in simulated galaxy clusters (Murante et al. 2004; Sommer-Larsen et al. 2004). They conclude that the mass of the diffuse light varies with the mass of the cluster, being larger for more massive clusters. Murante et al. (2004) studied the diffuse light for clusters with masses in the range . They found for low-mass clusters like Virgo () that the surface mass density of the diffuse light in the innermost regions of the clusters is kpc-2, which is in agreement with our measured mean surface luminosity density of the ICL in the Virgo core of 2.7 LB⊙ arcmin-2, for a mass-to-light ratio of , as expected for an evolved stellar population.
6 Conclusions
Four pointings around the core region of the Virgo cluster have been analyzed to determine the amount of intracluster light (ICL) via intracluster planetary nebulae (ICPNe). The photometric ICPN candidates, for three of the fields, were selected according to the on-off band technique using [OIII]Å, and for the fourth field by the emission in [OIII] and H. We have carefully studied the contribution of different contaminants to the photometric samples of ICPNe, using simulations on our images. In this way we obtain a well-understood, magnitude-limited sample of ICPN candidates.
In the SUB field, spectroscopic follow-up has provided kinematic evidence that the so-called ’over-luminous’ PNe in the halo of M84 are dynamically associated with this galaxy. They must therefore be intrinsically brighter than the normal elliptical galaxy PN population in M84, presumably due to a younger age or different metallicity.
Based on our new sample of ICPNe, the mean surface brightness and surface luminosity density of the ICL in our 4 fields are mag arcsec-2 and 2.7 LB⊙ arcmin-2, respectively. These values are in good agreement with the corresponding values obtained from excess red giant counts in two HST images in the Virgo core. There is no trend evident with distance from M87. When the fraction of ICL is computed for our four fields in the Virgo core, it amounts to 5 of the total galaxy light.
However, the diffuse stellar population in Virgo is inhomogeneous on scales of : we observe substantial field-to-field variations in the number density of PNe and the inferred amount of intracluster light, with some empty fields, some fields dominated by extended Virgo galaxy halos, and some fields dominated by the true intracluster component.
The field-to-field variations indicate that the ICL is not yet dynamically mixed. This imposes a constraint on the time of origin of the ICL and the Virgo cluster itself. The lack of phase-mixing suggests that both have formed in the last few Gyr, and that local processes like galaxy interactions and harassment have played an important role in this. In a cluster as young and unrelaxed as Virgo, a substantial fraction of the ICL may still be bound to the extended halos of galaxies, whereas in denser and older clusters these halos might already have been stripped.
References
- Alcalá et al. (2004) Alcalá, J. M., et al. 2004, A&A, 428, 339
- Alcalá et al. (2002) Alcalá, J. M., et al. 2002, Proc. SPIE, 4836, 406
- Arnaboldi et al. (2004) Arnaboldi, M. et al. 2004, ApJ, 614, L33
- Arnaboldi et al. (2003) Arnaboldi, M. et al. 2003, AJ, 125, 514 (Paper II)
- Arnaboldi et al. (2002) Arnaboldi, M. et al. 2002, AJ, 123, 760 (Paper I)
- Arnaboldi et al. (1998) Arnaboldi, M. et al. 1998, ApJ, 507, 759
- Arnaboldi et al. (1996) Arnaboldi, M. et al. 1996, ApJ, 472, 145
- Bernstein et al. (1995) Bernstein, G. M., Nichol, R. C., Tyson, J. A., Ulmer, M. P., & Wittman, D. 1995, AJ, 110, 1507
- Bertin & Arnouts (1996) Bertin, E. & Arnouts, S. 1996, A&AS, 117, 393
- Binggeli, Tammann, & Sandage (1987) Binggeli, B., Tammann, G. A., & Sandage, A. 1987, AJ, 94, 251
- (11) Binney, J. J., & Tremaine, S. 1987, Galactic Dynamics (Princenton: Princeton Univ. Press)
- Burstein et al. (1987) Burstein, D., Davies, R. L., Dressler, A., Faber, S. M., Stone, R. P. S., Lynden-Bell, D., Terlevich, R. J., & Wegner, G. 1987, ApJS, 64, 601
- Castro-Rodríguez et al. (2003) Castro-Rodríguez, N., Aguerri, J. A. L., Arnaboldi, M., Gerhard, O., Freeman, K. C., Napolitano, N. R., & Capaccioli, M. 2003, A&A, 405, 803
- Ciardullo et al. (2002a) Ciardullo, R., Feldmeier, J. J., Krelove, K., Jacoby, G. H., & Gronwall, C. 2002a, ApJ, 566, 784
- Ciardullo et al. (2002b) Ciardullo, R., Feldmeier, J.J., Jacoby, G.H., Kuzio de Naray, R., Laychak, M.B., Durrell, P.R. 2002b, ApJ, 577, 31
- Ciardullo, Jacoby, Feldmeier, & Bartlett (1998) Ciardullo, R., Jacoby, G. H., Feldmeier, J. J., & Bartlett, R. E. 1998, ApJ, 492, 62
- Ciardullo, Jacoby, Ford, & Neill (1989) Ciardullo, R., Jacoby, G. H., Ford, H. C., & Neill, J. D. 1989a, ApJ, 339, 53
- Ciardullo, Jacoby, & Ford (1989a) Ciardullo, R., Jacoby, G. H., & Ford, H. C. 1989b, ApJ, 344, 715
- Colless, Ellis, Taylor, & Hook (1990) Colless, M., Ellis, R. S., Taylor, K., & Hook, R. N. 1990, MNRAS, 244, 408
- Dopita, Jacoby, & Vassiliadis (1992) Dopita, M. A., Jacoby, G. H., & Vassiliadis, E. 1992, ApJ, 389, 27
- Dubinski (1998) Dubinski, J. 1998, ApJ, 502, 141
- Durrell et al. (2002) Durrell, P. R., Ciardullo, R., Feldmeier, J. J., Jacoby, G. H., & Sigurdsson, S. 2002, ApJ, 570, 119
- Feldmeier, Ciardullo, Jacoby, & Durrell (2004) Feldmeier, J. J., Ciardullo, R., Jacoby, G. H., & Durrell, P. R. 2004, ApJ, 615, 196.
- Feldmeier, Ciardullo, Jacoby, & Durrell (2003a) Feldmeier, J. J., Ciardullo, R., Jacoby, G. H., & Durrell, P. R. 2003a, ApJS, 145, 65
- Feldmeier, Ciardullo, Jacoby, & Durrell (2003b) Feldmeier, J.J., Ciardullo, R., Jacoby, G., & Durrell, P. 2003b, in IAU Symposium 217, Recycling Intergalactic and Interstellar Matter, in press
- Feldmeier, Ciardullo, & Jacoby (1998) Feldmeier, J. J., Ciardullo, R., & Jacoby, G. H. 1998, ApJ, 503, 109
- Ferguson, Tanvir, & von Hippel (1998) Ferguson, H. C., Tanvir, N. R., & von Hippel, T. 1998, Nature, 391, 461
- Freeman et al. (2000) Freeman, K. C. et al. 2000, in ASP Conf. Ser. 197: Dynamics of Galaxies: from the Early Universe to the Present, 389
- Gal-Yam, Maoz, Guhathakurta, & Filippenko (2003) Gal-Yam, A., Maoz, D., Guhathakurta, P., & Filippenko, A. V. 2003, AJ, 125, 1087
- Gonzalez, Zabludoff, Zaritsky, & Dalcanton (2000) Gonzalez, A. H., Zabludoff, A. I., Zaritsky, D., & Dalcanton, J. J. 2000, ApJ, 536, 561
- Gregg & West (1998) Gregg, M. D. & West, M. J. 1998, Nature, 396, 549
- Hammer et al. (1997) Hammer, F., et al. 1997, ApJ, 481, 49
- Hogg, Cohen, Blandford, & Pahre (1998) Hogg, D. W., Cohen, J. G., Blandford, R., & Pahre, M. A. 1998, ApJ, 504, 622
- Hui, Ford, Ciardullo, & Jacoby (1993) Hui, X., Ford, H. C., Ciardullo, R., & Jacoby, G. H. 1993, ApJ, 414, 463
- Jacoby, Ciardullo, & Walker (1990) Jacoby, G. H., Ciardullo, R., & Walker, A. R. 1990, ApJ, 365, 471
- Jacoby (1989) Jacoby, G. H. 1989, ApJ, 339, 39
- Kudritzki et al. (2000) Kudritzki, R.-P., et al. 2000, ApJ, 536, 19
- (38) Marigo, P., Girardi, L., Weiss, A., Groenewegen, M. A. T., & Chiosi, C., 2004, A&A, 423, 995
- Malumuth & Richstone (1984) Malumuth, E. M. & Richstone, D. O. 1984, ApJ, 276, 413
- Mendez et al. (1993) Mendez, R. H., Kudritzki, R. P., Ciardullo, R., & Jacoby, G. H. 1993, A&A, 275, 534
- Merritt (1983) Merritt, D. 1983, ApJ, 264, 24
- Merritt (1984) Merritt, D. 1984, ApJ, 276, 26
- Miller (1983) Miller, G. E. 1983, ApJ, 268, 495
- Moore et al. (1996) Moore, B., Katz, N., Lake, G., Dressler, A., & Oemler, A. 1996, Nature, 379, 613
- (45) Murante, G. et al., 2004, ApJ, 607, L83
- Napolitano et al. (2003) Napolitano, N. R. et al. 2003, ApJ, 594, 172
- Neilsen & Tsvetanov (2000) Neilsen, E.H., & Tsvetanov, Z.I. 2000, ApJ, 536, 255
- Nulsen & Bohringer (1995) Nulsen, P. E. J. & Bohringer, H. 1995, MNRAS, 274, 1093
- Okamura et al. (2002) Okamura, S., et al. 2002, PASJ, 54, 883
- Oemler (1973) Oemler, A. 1973, ApJ, 180, 11
- Peimbert (1990) Peimbert, M. 1990, Rep. Prog. Phys., 53, 1559
- Renzini & Buzzoni (1986) Renzini, A. & Buzzoni, A. 1986, ASSL Vol. 122: Spectral Evolution of Galaxies, 195
- Richstone & Malumuth (1983) Richstone, D. O. & Malumuth, E. M. 1983, ApJ, 268, 30
- (54) Sommer-Larsen, J., Romeo, A. D. & Portinari, L., 2004, MNRAS, submitted (astro-ph/0403282)
- Teplitz et al. (2000) Teplitz, H. I., et al. 2000, ApJ, 542, 18
- Theuns & Warren (1997) Theuns, T. & Warren, S. J. 1997, MNRAS, 284, L11
- Thuan & Kormendy (1977) Thuan, T. X. & Kormendy, J. 1977, PASP, 89, 466
- West & Blakeslee (2000) West, M. J. & Blakeslee, J. P. 2000, ApJ, 543, 27
- Willman et al. (2004) Wilman, B., Governato, F., Wadsley, J., & Quinn, T. 2004, MNRAS, 355, 159
- Zibetti, et al. (2005) Zibetti, S., White, S. D. M., Schneider, D.M., & Brinkmann, J., 2005, MNRAS, in press (astro-ph/0501194)
- Zwicky (1951) Zwicky, F. 1951, PASP, 63, 61
| Field | (J2000) | (J2000) | [OIII] Filter | Off-band Filter | Ca | m | ||||
|---|---|---|---|---|---|---|---|---|---|---|
| (hh:mm:ss) | (o:′:′′) | (Å) | FWHM (Å) | (Å) | FWHM (Å) | |||||
| Core | 12:27:48 | +13:18:46 | 5023 | 80 | 5395 | 894 | 2.51 | 27.21 | 24.75 | |
| FCJ | 12:30:39 | +12:38:10 | 5027 | 44 | 5300 | 267 | 2.50 | 27.01 | 24.58 | |
| LPC | 12:25:32 | +12:14:39 | 5027 | 60 | 4407 | 1022 | 3.02 | 27.52 | 25.40 | |
| SUB | 12:25:47 | +12:43:58 | 5021 | 74 | 2.49 | 28.10 | ||||
| RCN1 | 12:26:13 | +14:08:03 | 5023 | 80 | 5395 | 894 | 2.51 | 26.71 | 24.75 | |
| Field | ||||||
|---|---|---|---|---|---|---|
| Core | 117 | 77 | 45 | 1 | 20/26 | 13 |
| FCJ | 36 | 20 | 4 | 2 | 2/4 | 16 |
| LPC | 14 | 14 | 2 | 0 | 22/16 | |
| SUB | 36 | 36 | - | - | - | 36 |
| RCN1 | 75 | 55 | 16 | 1 | 3/26 | 37/15 |
| Field | Area (arcmin2) | ICPNe/arcmin2 | |||
|---|---|---|---|---|---|
| Core | 13 | 1.28 | 17 | 943 | 0.018 |
| FCJ | 16 | 0.98 | 15 | 266 | 0.056 |
| LPC | 1 | 1 | 744 | 0.001 | |
| SUB | 36 | 0.40 | 14 | 706 | 0.020 |
| RCN1 | 37/15 | 1.15 | 43/17 | 957 | 0.045/0.018 |
| Field | ||||
|---|---|---|---|---|
| () | () | (mag/arcsec2) | ||
| Core | 9.40 | 1.91 | 29.5 | 10 |
| 13.30 | 1.35 | 29.8 | 7 | |
| 10.59 | 1.70 | 29.6 | 9 | |
| FCJ | 9.40 | 5.96 | 28.2 | 8 |
| 13.30 | 4.21 | 28.6 | 6 | |
| 7.46 | 7.51 | 28.0 | 10 | |
| LPC | 9.40 | 0.11 | 32.6 | 0.5 |
| 13.30 | 0.08 | 32.9 | 0.3 | |
| 25.44 | 0.04 | 33.7 | 0.2 | |
| SUB | 9.40 | 2.13 | 29.4 | 2 |
| 13.30 | 1.50 | 29.7 | 1 | |
| 3.46 | 5.78 | 28.3 | 5 | |
| RCN1 | 9.40 | 4.79/1.91 | 28.5/29.5 | 51/29 |
| 13.30 | 3.38/1.35 | 28.9/29.9 | 42/23 | |
| 15.00 | 3.00/1.20 | 29.0/30.0 | 39/21 |