Large Magellanic Cloud Microlensing Optical Depth with Imperfect Event Selection
Abstract
I present a new analysis of the MACHO Project 5.7 year Large Magellanic Cloud (LMC) microlensing data set that incorporates the effects of contamination of the microlensing event sample by variable stars. Photometric monitoring of MACHO LMC microlensing event candidates by the EROS and OGLE groups has revealed that one of these events is likely to be a variable star, while additional data has confirmed that many of the other events are very likely to be microlensing. This additional data on the nature of the MACHO microlensing candidates is incorporated into a simple likelihood analysis to derive a probability distribution for the number of MACHO microlens candidates that are true microlensing events. This analysis shows that 10-12 of the 13 events that passed the MACHO selection criteria are likely to be microlensing events, with the other 1-3 being variable stars. This likelihood analysis is also used to show that the main conclusions of the MACHO LMC analysis are unchanged by the variable star contamination. The microlensing optical depth toward the LMC is . If this is due to microlensing by known stellar populations, plus an additional population of lens objects in the Galactic halo, then the new halo population would account for 16% of the mass of a standard Galactic halo. The MACHO detection exceeds the expected background of 2 events expected from ordinary stars in standard models of the Milky Way and LMC at the 99.98% confidence level. The background prediction is increased to 3 events if maximal disk models are assumed for both the Milky Way and LMC, but this model fails to account for the full signal seen by MACHO at the 99.8% confidence level.
1 Introduction
An important difficulty inherent to gravitational microlensing surveys is the problem of selecting microlensing events against the background of variable stars. The chief difficulty with microlensing event selection is that our a priori knowledge of the background of other types of variable stars that might mimic microlensing events has been poorly understood. Fortunately, gravitational microlensing light curves are usually described by a very simple model (Paczyński, 1986) to very high accuracy, and the peak magnifications is such that some microlensing events are observed with a high enough signal-to-noise ratio (S/N) to be reasonably convincing (Alcock et al., 1993), even without a good understanding of the variable star background. However, many of the conclusions from microlensing event samples are statistical in nature, so it is advantageous to identify as many microlensing events as possible to improve the statistics. This is particularly true for microlensing searches observing the Magellanic clouds where the microlensing optical depth is more than an order of magnitude smaller than it is towards the Galactic bulge.
This need for higher statistics has led to the announcement of microlensing candidates that have since been rejected. Two of the first three MACHO LMC microlensing candidates (Alcock et al., 1996a) are no longer considered to be viable microlensing candidates. MACHO-LMC-2 has exhibited additional variations that are appear inconsistent with any reasonable microlensing interpretation, and the MACHO Project has found that candidate MACHO-LMC-3 has a signal-to-noise ratio (S/N) so low that it no longer stands out from the false microlensing–like signals caused by variable stars and/or photometry problems (Alcock et al., 1997b). Similarly, the first four EROS LMC microlensing candidates (Aubourg et al., 1993; Lasserre et al., 2000) have also been rejected (Ansari et al., 1995; Beaulieu et al., 1995; Jetzer et al., 2004; Tisserand & Milsztajn, 2005) as likely variable stars.
A major advance in the identification of Magellanic Cloud microlensing events was made by the MACHO Project in Alcock et al. (2000b) (hereafter A00), where they identified background supernovae as the dominant non-microlensing background, and developed a method to remove this background from the microlensing sample. A similar method has also been implemented by EROS (Jetzer et al., 2004; Tisserand & Milsztajn, 2005) to remove supernovae contamination from their data, and this has led to the rejection of several previous microlensing candidates.
The question remains, however, whether there is any additional population of non-microlensing events that still contaminates the LMC microlensing candidate samples after the supernovae have been removed. There are some reasons to believe that this possible contamination is not large. There are now a number of events that would be quite difficult to explain with another variability mechanism. These include high magnification events, such as MACHO-LMC-5 (Alcock et al., 2001b; Drake, Cook, & Keller, 2004; Gould, Bennett, & Alves, 2004) and MACHO-99-LMC-2 (Bond et al., 2002), caustic crossing binary events such as MACHO-LMC-9 (Bennett et al., 1996; Alcock et al., 2000a), and MACHO-98-SMC-1 (Afonso et al., 2000), and events with high precision follow-up photometry, such as MACHO-LMC-4, 13, 14 and 15 (Alcock et al., 2001a; Bennett, Becker, & Tomaney, 2005). Also, observations of red clump giant stars in both the LMC and Galactic bulge have revealed no examples of variability resembling microlensing (Alcock et al., 1997a; Afonso et al., 2003b; Popowski et al., 2004; Thomas et al., 2004; Sumi et al., 2004).
Recent observations of microlensing candidate MACHO-LMC-23 by the EROS (Glicenstein, 2004; Jetzer et al., 2004; Tisserand & Milsztajn, 2005) and OGLE (Udalski, private communication) indicate a subsequent brightening of this star approximately 2500 days after the one observed by MACHO. This could conceivably be explained with a binary source or binary lens microlens model, but the MACHO data for the first brightening episode also does not fit a standard microlensing model very well (Bennett, Becker, & Tomaney, 2005), and a different modification of standard microlensing would be required to explain the first brightening episode. It seems more likely that MACHO-LMC-23 is a variable star instead of a microlensing event, and I will assume that this is the case in the rest of this paper.
Della Valle & Livio (1996) have suggested a number of possible variable star types that could be mistaken for microlensing events, and it is possible that one of these types, old novae, could explain both both MACHO LMC-23 as well as MACHO LMC-2. Another possibility is that these events are related to the “blue bumpers” (Keller et al., 2002) which have been observed to exhibit multiple brightening episodes for brighter source stars (Alcock et al., 1996a, 1997b, 2000b). These blue bumpers are thought to be related to Be-stars, and it seems likely that the EROS-LMC-1 event is an example of this since the source star is a B-star which exhibits emission lines (Beaulieu et al., 1995) and as also exhibited a second brightening episode (Tisserand & Milsztajn, 2005). EROS-LMC-2 and 3 have also apparently exhibited subsequent variations (Lasserre et al., 2000; Tisserand & Milsztajn, 2005), but EROS-LMC-2 exhibits significant variability on the light curve baseline (Ansari et al., 1995), and EROS-LMC-3 has significant light curve variations in the initial light curve peak that may not be consistent with a microlensing model. So, it is not clear that that MACHO analysis would have selected any of the first three EROS events as microlensing candidates. So, while there are some clues to the physical nature of these false microlensing events, it is not clear that they are all caused by the same mechanism, nor are the details of the candidate mechanisms well understood. Therefore, my analysis will be limited to a statistical analysis of the possible level of contamination of the MACHO sample.
We have seen that there is strong evidence that many of the MACHO LMC microlensing candidates are indeed true microlensing events, but one of these events now appears to be a variable star. In addition, there are several other of the MACHO LMC microlensing candidates from A00 where the verdict is uncertain. In Sec. 2, I present a classification of the microlensing candidates from A00 that sorts them into three categories: confirmed, rejected, and unconfirmed. A simple likelihood method is then used to assign a true microlensing probability to the unconfirmed events. In Sec. 3, I discuss how to use the results of Sec. 2 to produce a new estimate of the microlensing optical depth, and to compare to models of the microlensing background due to lensing by ordinary stars in the Milky Way and LMC. This section also includes a correction to the microlensing event detection efficiencies used in A00, where there was a slight error in the normalization of the LMC luminosity used in the efficiency calculations. Finally, in Sec. 4, I discuss the implications of these calculations and the status of the observed microlensing excess towards the LMC.
2 Evaluation of Candidate Microlensing Events
A00 presented two sets of candidate microlensing events, which were selected with selection criteria A and B. Event set A included 13 events (numbered 1, 4, 5, 6, 7, 8, 13, 14, 15, 18, 21, 23 and 25), and set B, which was designed to be more inclusive, included all the set A events plus events 9, 20, 22, and 27. Additional data obtained for event 22 shortly before the A00 paper went to press indicated the source star was barely resolved in seeing and that this source had the spectrum of an active background galaxy. This strongly suggests that the event was with a very long duration supernova in the background galaxy or some type of active galactic nucleus phenomena. As mentioned above, event 23 now appears to be a variable star (Glicenstein, 2004; Jetzer et al., 2004; Tisserand & Milsztajn, 2005; Bennett, Becker, & Tomaney, 2005), so 2 of the A00 events can be considered to be rejected. However, only event 23 was selected by the more restrictive cut A, which put tighter constraints on the quality of the light curve fit to a standard Paczyński light curve shape. The drawback of criteria A is that it does reject events like the binary caustic crossing event 9 (Bennett et al., 1996). The observed light curve features of this event are unique to binary caustic crossing events, and this means that this event is also almost certainly a true microlensing event. However, these same features also mean that this event has a poor fit to the standard Paczyński light curve model, and this causes this event to fail the cuts for selection criteria A. I will return to the effect of this systematic error in Sec. 4. Our focus on the events selected by criteria A also means that we will not consider events 20 and 27 have the lowest S/N of all the A00 microlensing candidates.
2.1 Confirmed Microlensing Events
My classification of the 13 MACHO LMC microlensing candidates selected by criteria A of A00 is listed in Table 1. There are three different categories of confirmed microlensing candidates listed in this table: follow-up, clump giant, and lens ID.
Event 5 is the only candidate confirmed with a direct lens identification (Alcock et al., 2001b). The final analysis of this event shows (Drake, Cook, & Keller, 2004; Gould, Bennett, & Alves, 2004) that the microlensing data predicts a lens mass and distance that are completely consistent with the stellar brightness, color, and parallax. So, this event has passed three independent tests, and its microlensing interpretation is considered to be essentially certain.
Events 4, 13, 14, 15 all have high precision follow-up photometry from the CTIO 0.9m telescope obtained in seeing that is typically much better than in the MACHO survey images (Alcock et al., 2001a; Bennett, Becker, & Tomaney, 2005). The improved seeing and longer exposure times for the CTIO data yields photometry that has estimated uncertainties 2.5-5 times smaller than the original MACHO data, and in each case the microlensing interpretation is confirmed. Events 16 and 17, were also discovered by the MACHO alert system (Alcock et al., 1996b) as alerts 97-LMC-4 and 98-LMC-1, but these were classified as supernovae by the MACHO 5.7 year analysis. MACHO Alerts 97-LMC-2, 3 and 5 were also in the MACHO 5.7 year data set, but these light curves failed other cuts and made neither the microlensing or supernovae samples. MACHO Alerts 97-LMC-6 and 7 occurred in fields not included in the 5.7 year analysis. The only microlensing candidates from the 5.7 year analysis that occurred when the MACHO alert system was operating are events 18, 20, 22, 23, and 25. However, events 22, 23 and 25 occurred at times when the alert system was not running in their respective fields. Event 18 reached maximum magnification in the middle of a 40-day period when the MACHO alert system was not operating due to a camera upgrade and the subsequent need to modify photometry code input files. Event 20 was identified by the MACHO alert system, but it did not pass the subjective selection criteria for an alert. However, event 20 did not pass selection criteria A, and so this is not relevant to our analysis. The only criteria A events that occurred when the MACHO alert system was running were the events 4, 13, 14, and 15 which have the follow-up photometry, which has been used to confirm the microlensing interpretation of these events. Thus, it is fair to consider these 4 events as a randomly selected sub-sample of the events passing criteria A.
My final sub-category of “confirmed” events are those event with red clump giant source stars with achromatic light curves, and events 1 and 25 fall in this category. Event 1, of course, was the first event published by MACHO (Alcock et al., 1993), and its light curve was observed with a high enough S/N to be convincing to most astronomers, as well as to the MACHO team itself, which referred to it as the “gold plated event.” This event does show a significant deviation from the standard Paczyński light curve, which is explained by a binary lens model (Dominik & Hirshfeld, 1994; Rhie & Bennett, 1996; Alcock et al., 2000a). Event 25 is less dramatic, but it is classified as confirmed event because of its position on the red clump giant region of the color magnitude diagram and the fact that brightening is achromatic. (The chromatic brightening of a red clump star could be due to blending with a variable main sequence star.) High confidence in the microlensing interpretation of the events with red clump giant source stars is justified MACHO results for Galactic bulge microlensing, where 100% of red clump giant source stars that triggered the MACHO alert system with an apparently achromatic brightening in a single image were later classified as microlensing events based upon excellent fits to microlensing models using the MACHO survey data as well as follow-up observations from GMAN (Alcock et al., 1997c) and MPS (Rhie et al., 1999).
The situation is quite different for main sequence source stars. It has long been noticed that there is a class of main sequence stars in the LMC, sometimes referred to as “bumpers”, with variability characteristics that are similar to microlensing (Aubourg et al., 1995; Beaulieu et al., 1996; Alcock et al., 1996a). That is, they exhibit relatively brief brightening episodes, but spend most of the time at a constant brightness. MACHO and EROS attempted to prevent these variable stars from contaminating their microlensing samples by applying cuts to the color-magnitude diagrams of the source stars (Aubourg et al., 1995; Lasserre et al., 2000; Afonso et al., 2003a; Alcock et al., 1996a, 1997b, 2000b), but the evidence indicates that variable stars that have contaminated previous LMC microlensing candidate samples (Beaulieu et al., 1995; Ansari et al., 1995) have properties similar to the brighter main sequence stars that are removed from the microlensing search analysis (Beaulieu et al., 1996; Keller et al., 2002). So, it appears that the contamination of microlensing event samples by variable stars is only a serious problem for source stars on or near the main sequence.
2.2 True Microlensing Event Fraction
With the classification of microlensing event candidates listed in Table 1 and described in Sec. 2.1, it is possible to estimate the probability that the events classified as unconfirmed (events 6, 7, 8, 18, and 21) are actually microlensing events. Of 13 microlensing candidates, candidates, 4 have been observed in follow-up mode with much higher precision photometry, which confirms the microlensing interpretation. Since the selection of these 4 events was independent any other factor that might relate to event classification, these 4 events are a fair sub-sample of the full sample of 13 events. This is not the case for the two red clump giant source star events, since they are the only two such events. Event 5 is similar to the 4 events with follow-up photometry in that it appears to have a normal, main sequence source star, but it is special because its lens star has been identified. It may be the case that the lens stars for other events can be identified, but event 5 certainly stands out because its lens star is bright and too red for a normal LMC star. Thus, the conservative choice is not to include event 5 in the fair sub-sample of events to compare to the unconfirmed events.
It is certainly the case that event 23 has been singled out as the one event for which there is evidence of variation that is likely not to be due to microlensing, and so, it seems reasonable not to include it in the fair sub-sample of events that will be used in the comparison to the unconfirmed events. However, this would minimize the effect of the rejection of this event in the analysis below, and so I choose to include the rejected event as part of the fair sub-sample of events even if it should not strictly be allowed.
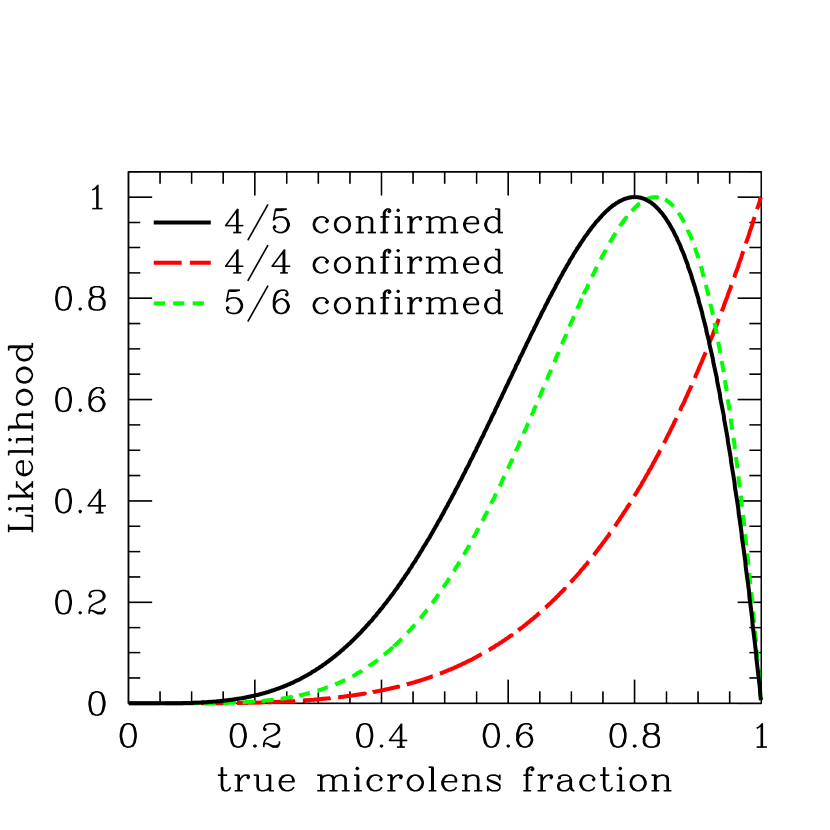
With the identification of this fair sub-sample of events, it is straight forward a likelihood function for the true microlens fraction, , of the events with main sequence source stars, selected by criteria A:
| (1) |
This is simply the relative probability of 4 confirmed and 1 rejected microlensing events in the fair sub-sample of events. This function is plotted in Fig. 1. Also plotted in Fig. 1 are the likelihood functions for different choices of the sub-sample. These are 4/4 events confirmed, which is appropriate for a sub-sample that doesn’t include event 23, and 5/6 events confirmed, which refers to a sub-sample including both event 5 and event 23.
We can apply this likelihood function to the question of how many of the MACHO events passing criteria A are actually microlensing events. The appropriate prior distribution of for Baysean likelihood analysis is a uniform distribution, and with that prior the likelihood function in eq. 1 and FIg. 1 can be interpreted as a probability distribution for the true microlensing fraction, . This probability distribution can then be convolved with the binomial distribution for the 5 unconfirmed events to yield the microlensing event probabilities listed in Table 2. This table also gives the probabilities that would be obtained we had assumed that 4/4 or 5/6 sub-sample events were confirmed to be microlensing.
3 Microlensing Optical Depth and Rate
In this section, I will use the likelihood function, eq. 1, to determine a new microlensing optical depth for the MACHO LMC data, and to compare the observed LMC microlensing rate to the rate predicted due to microlensing by normal stars in the Milky Way and LMC. But, I must first correct a systematic error in the microlensing detection efficiencies determined by the MACHO Collaboration.
3.1 Efficiency Normalization Correction
One known systematic error that was not removed from the A00 analysis involved the normalization of the underlying stellar luminosity function, determined from HST images, to the apparent luminosity function as observed in the MACHO images. This was done by adjusting the star density to the assumed true luminosity function so that the number of stars in magnitude bin will match the stellar density in the same magnitude range seen by MACHO. This magnitude bin was selected because it is bright enough so that the MACHO images are not strongly affected by blending, but there are still enough stars to for accurate sampling in the HST frames. The accuracy of this procedure was tested by constructing three synthetic images with parameters chosen to match the MACHO images (Alcock et al., 2001c). We found that the number of “objects” identified in the simulated MACHO images was generally larger than the number of input stars: i.e. . The synthetic images had ratios of , , and , where the errors are 1 Poisson errors. Thus, the MACHO images are expected to have a formal completeness in this magnitude range.
This overcompleteness is easily explained in terms of blending: the extra “objects” seen in the ground-based images are simply blends of multiple fainter stars within the ground-based seeing disk. Since the luminosity function rises at fainter magnitudes, the probability of two fainter stars moving into the bin is larger than the probability of two stars moving out of this bin due to blending. Since the density of stars is relatively low, a linear correction will suffice to correct this problem. The correction will depend on the apparent density of stars, , and upon the seeing, which we denote by the number density of seeing disks, . (The area of a seeing disk is defined as .) The expression for the number density of real (i.e. resolved by HST) stars in the magnitude range is
| (2) |
where the coefficient was determined by a linear fit to the synthetic image data. The correction factor can be calculated on a field-by-field basis because each field has an approximately constant star density and an approximately constant PSF FWHM over its template image. The resulting corrections range from about 1.5% in the lowest density fields to 4% for a more typical field, to an extreme value of 16.4% in field 78. (It was the parameters from this field that gave the empirical correction of % in the synthetic image.)
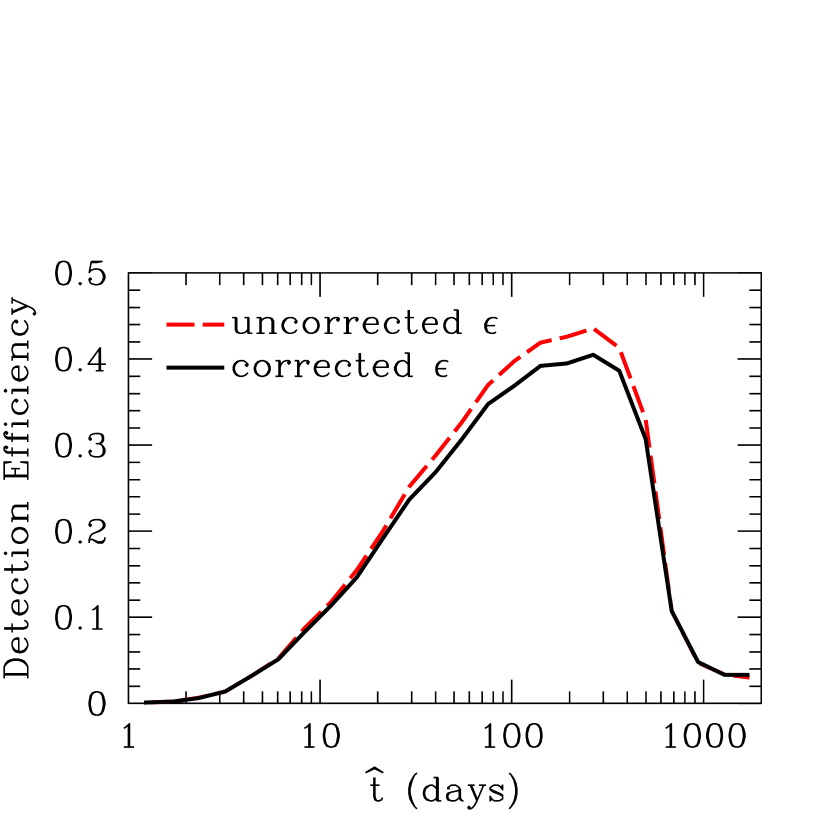
Although this correction was determined during the preparation of A00, it was not used in that paper. The reason for this was that there were thought to be other small systematic errors that might bias the results in the opposite direction. However, in this paper, I am directly including the largest of these systematic errors, the uncertainty in the identification of microlensing events, so it is best to correct for this systematic error, as well. The overall detection efficiency numbers are corrected by going back to the field-by-field efficiency values that were determined as an intermediate step of the efficiency calculation (Alcock et al., 2001c), and then applying the correction formula, 2 to the normalization for each field. Fig. 2 shows a comparison of the original and corrected efficiencies. The corrected efficiencies are about 7% smaller than those reported in A00 for the timescales of the observed events: . So, this correction, by itself, would increase the microlensing optical depth measured by MACHO by about 7%.
3.2 Optical Depth Estimates
The microlensing optical depth, , is just the fractional area of the sky in the direction of our target that is covered by the Einstein ring disks of the lens objects. The Einstein ring corresponds to the circular image of a point source in perfect alignment behind the lens. Conventionally, the Einstein ring is supposed to lie at the distance of the lens, and the radius is given by
| (3) |
where and M is the lens mass. and are the lens and source distances, respectively. The microlensing magnification is if there is lens object less than from the line of sight to a given source star, so an alternate definition of the microlensing optical depth, , is the fraction of source stars that are magnified by at any given time. Thus, an experimental estimate of the microlensing optical depth is given by
| (4) |
where object-years is the total exposure of the MACHO data set, is the Einstein ring diameter crossing time of the th event, and is its detection efficiency. As discussed in A00, blending complicates the issue of determining the correct values, and following A00, I use the statistically corrected values of the blended durations (Table 1). Note that this choice is only optimal for optical depth calculations, and it is not appropriate for studies of the distribution itself because the distribution of is artificially narrow as noticed by Green & Jedamzik (2002) and Rahvar (2004). The values determined by fits with blending should be more accurate on an event-by-event basis, but they can be biased toward very large values due to a light curve degeneracy involving highly blended events of high magnification and long duration. The use of the values avoids this bias. It is also convenient to define the function
| (5) |
which is the contribution to from a single observed event with timescale . values for each event are listed in Table 1.
The final microlensing optical depth depends on the number of candidate events that are actually microlensing, and Table 2 also shows how the microlensing optical depth changes with the assumed number of events. Since we don’t know which of the unconfirmed events are the actual microlensing events, we have just assumed that there is an equal probability for each unconfirmed event to be rejected calculating the values in Table 2. The most likely value for is simply , which is the value for the most likely number of true microlensing events, 11.
Table 2 doesn’t reflect the all the uncertainty in the measured values of because Poisson fluctuations in the number detected events have not been included. As pointed out in Bennett et al. (1995) and Han & Gould (1995), the standard Poisson statistical formulae cannot be used because the different events contribute to with different weights. Following Bennett et al. (1995) and Alcock et al. (1997a), I account for this with a Monte Carlo method. The number of expected events, , is taken to be a variable, and we construct simulated event sets with values drawn from the observed distribution, and determine what fraction, , of the simulated data sets has a value that exceeds the measured value. If for a particular assumed value, then that particular value corresponds to the 1– upper limit on , which is listed as the confidence level in Table 3. Each can be converted to a microlensing optical depth by , where the mean values of is assumed.
The procedure described in the previous paragraph was used for the optical depth estimates in Alcock et al. (1997b) and A00, but it must be modified here to include the event identification uncertainty. First, the distribution used for the Monte Carlo weights the unconfirmed event with 80% of the weight of the confirmed events. Then, the comparison to the observed value uses not the most likely value, , but the distribution given in Table 2. This method effectively combines the Poisson uncertainties with the event identification uncertainty and results in the confidence levels given in Table 3. So, the final LMC microlensing optical depth value is with 1– errors and with 2– errors. The 95% confidence level lower limit is .
For comparison, Table 3 also shows the optical depth confidence intervals for selection criteria A from A00 as well as the confidence intervals that would result from using only the 4 events with follow-up data to estimate the number of true microlensing events.
3.3 Microlensing by Known Stellar Populations
Table 4 shows the expected microlensing properties of the known stellar populations along the line of site to the LMC as discussed in A00. The first four lines give the numbers for the standard models of the Milky Way and LMC, and the fifth line gives the total microlensing optical depth, rate, and number of expected events for these standard models. An alternative to the standard Milky Way disk model is the maximum disk model, which may be needed to explain the high microlensing optical depth seen towards the Galactic bulge (Sackett, 1997; Drimmel & Spergel, 2001; Bissantz & Gerhard, 2002). In a maximum disk model, the rotation curve of the inner part of the galaxy is almost entirely supported by the stellar mass of the disk and bulge, so these models predict higher microlensing optical depths and rates than standard models. The sixth and seventh lines give microlensing predictions for maximum disk models for both the Milky Way and LMC, and the last line of the table is the total assuming the maximum disk models.
The numbers given in Table 4 are identical to those given in A00, except for the number of expected events, , which has been updated to reflect the correction to the detection efficiencies that I have presented. Newer models of the LMC (Mancini, Calchi Novati, Jetzer, & Scarpetta, 2004; Alves, 2004; Gyuk, Dalal, & Griest, 2000; Nikolaev et al., 2004; van der Marel et al., 2002) give predictions for and that are almost identical to the standard model listed in Table 4.
Comparison of Tables 3 and 4 reveals that the measured LMC microlensing optical depth exceeds the prediction from lensing by known stellar populations of the standard Milky Way and LMC models at the 99.9% confidence level, and it exceeds the prediction of the maximum disk Milky Way and LMC models at the 99% confidence level, so it is clear that the basic conclusions of A00 are unchanged when the slight contamination of the candidate microlensing event sample by variable stars is considered.
A more demanding comparison between the stellar microlensing models and the data can be achieved by comparing the number of expected events from each model, , with the observed number events. Just as in the optical depth comparison, I account for the possibility of variable star contamination by using the detected event probability distribution listed in Table 2 instead of fixed number of detected events. An additional factor that must be included is that two of the events in this sample have additional data and analysis that indicates that these events are likely to be caused by lenses in the known stellar populations. These include event 5, where the lens has been identified as an M-dwarf in the Galactic disk (Alcock et al., 2001b; Drake, Cook, & Keller, 2004; Gould, Bennett, & Alves, 2004), and event 14, where wiggles in the light curve due to the source star orbital motion indicate that the lens is most likely to be in the LMC disk (Alcock et al., 2001a). (There is also some evidence that the lens for event 9 may reside in the LMC disk (Bennett et al., 1996), but this event did not pass selection criteria A.) These two events are accounted for with a simple modification to Poisson statistics. The probabilities of only 1 or 2 events due to lensing by known stellar populations are set to zero, since we know that there at least 2 such events, and then the Poisson probabilities for a larger number of events are increased to yield a total probability of 1.
The convolution of the detected event probabilities from Table 2 with the modified Poisson statistics on for the models then indicates that both the standard and maximum disk models are about six times less likely to explain the measured number of events than the measured microlensing optical depth, . Thus, the standard Milky Way and LMC models are excluded at the 99.8% confidence level and the maximum disk models are excluded at the 99.98% confidence level.
4 Discussion and Conclusions
In light of recent evidence of contamination of the MACHO LMC microlensing event sample by variable stars, I’ve carried out a new analysis of the MACHO Project 5.7 year LMC data set that can account for contamination of the microlensing sample due to imperfect event identification. This results in a slight decrease in the observed microlensing optical depth to . If we subtract the standard model background of and divide by the microlensing optical depth expected for a Milky Way dark halo composed entirely of MACHOs (), we find a most likely MACHO halo fraction of , where the error bars reflect only the microlensing optical depth uncertainty. Additional uncertainties in halo model parameters will add to this uncertainty, and of course, it is possible that distribution of the previously unknown lensing population does not track the distribution of the dark halo at all. Nevertheless, the qualitative conclusions of A00 have not been affected by the modest contamination of the LMC microlensing sample that has been discovered. All evidence suggests that the vast majority of the MACHO LMC microlensing candidates are true microlensing events, and this result cannot be explained as microlensing by ordinary stars in known stellar populations.
In estimating the true number of MACHO LMC microlensing events and the LMC microlensing optical depth, I’ve made a few conservative choices. First, I have not corrected for the known systematic error that the MACHO selection criteria A discriminates against non-standard microlensing events such as binary caustic crossing events like event 9, because the goodness-of-fit to a standard Paczyński light curve makes up part of the selection criteria. If criteria A did not discriminate against binary caustic crossing events, then event 9 might have passed this cut, which would have increased by %. However, if is not clear that event 9 would have passed cut A. Also, the frequency of binary caustic crossing events from the Galactic bulge is only about 5%, so I expect that the criteria A bias against such events is likely to be a systematic error of %. Also, note that this systematic error implies that the true value of is larger than the measured value. Glicenstein (2003) discussed a systematic error for the same type of events with the opposite sign, but this result does not apply to the event selection criteria used in A00.
I have also made a conservative choice to include event 23 as part of the event subset used to estimate the true microlensing fraction of the unconfirmed events. In fact, it is only the four events with LMC follow-up observations that represent an independently selected sub-sample of the full set of events passing criteria A. Event 23 was added just because it is the only event which can be rejected from the microlensing sample. So, by including it, we artificially decrease the true microlensing fraction plotted in Fig. 1. This might be partially compensated by the fact that I’ve assigned a microlensing probability of 1 to the confirmed events instead of a slightly smaller number.
Thus, it appears that the LMC microlensing puzzle is not likely to be resolved by the simple experimental error of the misidentification of variable stars as microlensing events. The natural interpretation of the LMC microlensing excess is that the lens objects comprise part of the Milky Way’s dark halo, which is of unknown composition. Since the measured microlensing optical depth represents only a fraction (%) of the total halo mass, there is no reason that the distribution of lens objects must follow that of the bulk of the dark matter. Thus, the lens objects could follow a distribution like the spheroid or a very thick disk (Gates & Gyuk, 2001), and if so, the total mass of the new population could be significantly less than 16% of the dark halo mass.
The timescales of the LMC events suggest a typical lens mass of , which suggests that the lenses are likely to be white dwarfs since main sequence stars of that mass would be too bright. While white dwarfs were once considered a viable candidate to comprise the entire dark halo (Ryu et al., 1990), there now appear to be significant problems with a previously unknown population of white dwarfs with enough mass to explain the LMC microlensing results (Torres, García-Berro, Burkert, & Isern, 2002; Flynn, Holopainen, & Holmberg, 2003; Brook, Kawata, & Gibson, 2003; García-Berro, Torres, Isern, & Burkert, 2004; Spagna, Carollo, Lattanzi, & Bucciarelli, 2004), although some of these constraints are evaded if most of the halo white dwarfs have Helium atmospheres.
The leading alternative explanation for the LMC microlensing excess is that the lens objects are ordinary stars associated with the LMC (Sahu, 1994), but there is a simple dynamical argument against this idea (Gould, 1995). On the other hand, the LMC is not an isolated galaxy and may have had significant dynamical disturbances from the Milky Way (Weinberg, 2000; Evans & Kerins, 2000), so the assumptions of the dynamical argument could be wrong. However, current LMC models that include these effects still cannot account for the observed microlensing events (Gyuk, Dalal, & Griest, 2000; Alves, 2004; Mancini, Calchi Novati, Jetzer, & Scarpetta, 2004; Nikolaev et al., 2004).
A resolution of this puzzle will probably require additional data so that the distance to a representative sample of LMC lensing events can be determined. One possibility is to make microlensing parallax observations from a small telescope in a Heliocentric orbit (gould-parsat), such as the 30cm telescope on the Deep Impact telescope, which could become available for microlensing parallax observations if an extended mission is approved. The microlensing key project for the SIM mission (Unwin & Turyshev, 2002) could also determine distances to some LMC microlenses. Microlensing experiments towards other lines of site, such as M31 could also shed some light on this issue (deJong et al., 2004; Paulin-Henriksson et al., 2003; Uglesich et al., 2004; Calchi Novati et al., 2005). In addition, the SuperMACHO (Becker, 2004), MOA-II (Muraki, 2004), and OGLE-III (Udalski, 2003) surveys expect to substantially increase the detection rate of LMC microlensing events in order to provide alerts for SIM and DIME and to measure the spatial variation of the microlensing optical depth across the face of the LMC.
References
- Afonso et al. (2000) Afonso, C., et al. 2000, ApJ, 532, 340
- Afonso et al. (2003a) Afonso, C., et al. 2003, A&A, 400, 951
- Afonso et al. (2003b) Afonso, C., et al. 2003, A&A, 404, 145
- Alcock et al. (1993) Alcock, C., et al. 1993, Nature, 365, 621
- Alcock et al. (1996a) Alcock, C., et al. 1996a, ApJ, 461, 84
- Alcock et al. (1996b) Alcock, C., et al. 1996b, ApJ, 463, L67
- Alcock et al. (1997a) Alcock, C., et al. 1997a, ApJ, 479, 119; (E) 500, 522
- Alcock et al. (1997b) Alcock, C., et al. 1997b, ApJ, 486, 697
- Alcock et al. (1997c) Alcock, C., et al. 1997c, ApJ, 491, 436
- Alcock et al. (2000a) Alcock, C., et al. 2000a, ApJ, 541, 270
- Alcock et al. (2000b) Alcock, C. et al.2000b, ApJ, 542, 281 (A00)
- Alcock et al. (2001a) Alcock, C., et al. 2001a, ApJ, 552, 259
- Alcock et al. (2001b) Alcock, C., et al. 2001b, Nature, 414, 617
- Alcock et al. (2001c) Alcock, C., et al. 2001c, ApJS, 136, 439
- Alves (2004) Alves, D. R. 2004, ApJ, 601, L151
- Ansari et al. (1995) Ansari, R., et al. 1995, A&A, 299, L21
- Aubourg et al. (1993) Aubourg, E. et al. 1993, Nature, 365, 623
- Aubourg et al. (1995) Aubourg, E., et al. 1995, A&A, 301, 1
- Beaulieu et al. (1995) Beaulieu, J. P., et al. 1995, A&A, 299, 168
- Beaulieu et al. (1996) Beaulieu, J. P., et al. 1996, Science, 272, 995
- Becker (2004) Becker, A. C. 2004, ArXiv e-prints, astro-ph/0409167
- Bennett et al. (1995) Bennett, D. P., et al. 1995, AIP Conf. Proc. 336: Dark Matter, 336, 77 (also astro-ph/9411114)
- Bennett et al. (1996) Bennett, D. P., et al. 1996, Nucl. Phys. B (Proc. Suppl.), Vol. 51B, 131
- Bennett, Becker, & Tomaney (2005) Bennett, D. P., Becker, A. C., & Tomaney, A. 2005, ArXiv e-prints, astro-ph/0501101
- Bissantz & Gerhard (2002) Bissantz, N., & Gerhard, O. 2002, MNRAS, 330, 591
- Bond et al. (2002) Bond, I., et al. 2002, MNRAS, 333, 71
- Brook, Kawata, & Gibson (2003) Brook, C. B., Kawata, D., & Gibson, B. K. 2003, MNRAS, 343, 913
- Calchi Novati et al. (2005) Calchi Novati, S., et al. 2005, ArXiv Astrophysics e-prints, astro-ph/0504188
- Cook et al. (2003) Cook, K., et al., 2003, BAAS, 20314302
- deJong et al. (2004) deJong, J.T.A. et al., 2004, A&A, 417. 461
- Della Valle & Livio (1996) Della Valle, M., & Livio, M. 1996, ApJ, 457, L77
- Dominik & Hirshfeld (1994) Dominik, M., & Hirshfeld, A. C. 1994, A&A, 289, L31
- Dominik & Hirshfeld (1996) Dominik, M., & Hirshfeld, A. C. 1996, A&A, 313, 841
- Drake, Cook, & Keller (2004) Drake, A. J., Cook, K. H., & Keller, S. C. 2004, ApJ, 607, L29
- Drimmel & Spergel (2001) Drimmel, R., & Spergel, D. N. 2001, ApJ, 556, 181
- Evans & Kerins (2000) Evans, N. W., & Kerins, E. 2000, ApJ, 529, 917
- Flynn, Holopainen, & Holmberg (2003) Flynn, C., Holopainen, J., & Holmberg, J. 2003, MNRAS, 339, 817
- García-Berro, Torres, Isern, & Burkert (2004) García-Berro, E., Torres, S., Isern, J., & Burkert, A. 2004, A&A, 418, 53
- Gates & Gyuk (2001) Gates, E. I. & Gyuk, G. 2001, ApJ, 547, 786
- Glicenstein (2003) Glicenstein, J.-F. 2003, ApJ, 584, 278
-
Glicenstein (2004)
Glicenstein, J.-F. 2004, talk presented at the Hawaii Microlensing
Workshop 2004,
http://www.stelab.nagoya-u.ac.jp/hawaii/ - Gould (1995) Gould, A. 1995, ApJ, 441, 77
- Gould, Bennett, & Alves (2004) Gould, A., Bennett, D. P., & Alves, D. R. 2004, ApJ, 614, 404
- Green & Jedamzik (2002) Green, A. M., & Jedamzik, K. 2002, A&A, 395, 31
- Gyuk, Dalal, & Griest (2000) Gyuk, G., Dalal, N., & Griest, K. 2000, ApJ, 535, 90
- Han & Gould (1995) Han, C., & Gould, A. 1995, ApJ, 449, 521
- Jetzer et al. (2004) Jetzer, P., Milsztajn, A., & Tisserand, P. 2004, ArXiv e-prints, astro-ph/0409496
- Keller et al. (2002) Keller, S. C., Bessell, M. S., Cook, K. H., Geha, M., & Syphers, D. 2002, AJ, 124, 2039
- Lasserre et al. (2000) Lasserre, T., et al. 2000, A&A, 355, L39
- Mancini, Calchi Novati, Jetzer, & Scarpetta (2004) Mancini, L., Calchi Novati, S., Jetzer, P., & Scarpetta, G. 2004, A&A, 427, 61
-
Muraki (2004)
Muraki, Y. 2004, talk presented at the Hawaii Microlensing
Workshop 2004,
http://www.stelab.nagoya-u.ac.jp/hawaii/ - Nikolaev et al. (2004) Nikolaev, S., Drake, A. J., Keller, S. C., Cook, K. H., Dalal, N., Griest, K., Welch, D. L., & Kanbur, S. M. 2004, ApJ, 601, 260
- Paczyński (1986) Paczyński, B. 1986, ApJ, 304, 1
- Paulin-Henriksson et al. (2003) Paulin-Henriksson, S., et al., 2003, A&A, 405, 15
- Popowski et al. (2004) Popowski, P., et al. 2004, ArXiv Astrophysics e-prints, astro-ph/0410319
- Rahvar (2004) Rahvar, S. 2004, MNRAS, 347, 213
- Rhie & Bennett (1996) Rhie, S. H., & Bennett, D. P. 1996, Nucl. Phys. B (Proc. Suppl.), Vol. 51B, 86
- Rhie et al. (1999) Rhie, S. H., Becker, A. C., Bennett, D. P., Fragile, P. C., Johnson, B. R., King, L. J., Peterson, B. A., & Quinn, J. 1999, ApJ, 522, 1037
- Ryu et al. (1990) Ryu, D., Olive, K. A., & Silk, J. 1990, ApJ, 353, 81
- Sackett (1997) Sackett, P. D. 1997, ApJ, 483, 103
- Sahu (1994) Sahu, K. C. 1994, Nature, 370, 275
- Salim et al. (2004) Salim, S., Rich, R. M., Hansen, B. M., Koopmans, L. V. E., Oppenheimer, B. R., & Blandford, R. D. 2004, ApJ, 601, 1075
- Spagna, Carollo, Lattanzi, & Bucciarelli (2004) Spagna, A., Carollo, D., Lattanzi, M. G., & Bucciarelli, B. 2004, A&A, 428, 451
- Sumi et al. (2004) Sumi, T., et al. 2004, American Astronomical Society Meeting Abstracts, 205
- Thomas et al. (2004) Thomas, C. L., et al. 2004, ArXiv e-prints, astro-ph/0410341
- Tisserand & Milsztajn (2005) Tisserand, P., & Milsztajn, A. 2005, ArXiv e-prints, astro-ph/0501584
- Torres, García-Berro, Burkert, & Isern (2002) Torres, S., García-Berro, E., Burkert, A., & Isern, J. 2002, MNRAS, 336, 971
- Udalski (2003) Udalski, A. 2003, Acta Astronomica, 53, 291
- Uglesich et al. (2004) Uglesich, R. R., Crotts, A. P. S., Baltz, E. A., de Jong, J., Boyle, R. P., & Corbally, C. J. 2004, ApJ, 612, 877
-
Unwin & Turyshev (2002)
Unwin, S. & Turyshev, S., 2002,
planetquest.jpl.nasa.gov/Navigator/library/science_AAS_Jan02.pdf - van der Marel et al. (2002) van der Marel, R. P., Alves, D. R., Hardy, E., & Suntzeff, N. B. 2002, AJ, 124, 2639
- Weinberg (2000) Weinberg, M. D. 2000, ApJ, 532, 922
- Zhao, Ibata, Lewis, & Irwin (2003) Zhao, H., Ibata, R. A., Lewis, G. F., & Irwin, M. J. 2003, MNRAS, 339, 701
| Event | confirmation | |||
|---|---|---|---|---|
| 1 | clump giant | 34.2 | 41.9 | 5.4 |
| 4 | follow-up | 45.4 | 55.5 | 6.3 |
| 5 | lens ID | 75.6 | 92.4 | 9.0 |
| 6 | unconfirmed | 91.6 | 112.0 | 10.5 |
| 7 | unconfirmed | 102.9 | 125.8 | 11.6 |
| 8 | unconfirmed | 66.4 | 81.1 | 8.1 |
| 13 | follow-up | 100.1 | 122.4 | 11.3 |
| 14 | follow-up | 100.1 | 122.4 | 11.3 |
| 15 | follow-up | 36.8 | 45.0 | 5.6 |
| 18 | unconfirmed | 74.2 | 90.7 | 8.9 |
| 21 | unconfirmed | 93.2 | 113.9 | 10.7 |
| 23 | rejected | - | - | 0 |
| 25 | clump giant | 85.2 | 104.2 | 9.9 |
Note. — The quantity is the average actual event timescale for events in the A00 Monte Carlo calculations which are detected with an unblended fit timescale of . The quantity is the contribution of each event to the total microlensing optical depth, computed using equation (5).
| # of Events | P(4/5 conf.) | P(4/4 conf.) | P(5/6 conf.) | |
|---|---|---|---|---|
| 7 | 0.013 | 0.004 | 0.008 | 0.59 |
| 8 | 0.054 | 0.020 | 0.038 | 0.69 |
| 9 | 0.130 | 0.059 | 0.106 | 0.79 |
| 10 | 0.227 | 0.139 | 0.212 | 0.89 |
| 11 | 0.303 | 0.278 | 0.318 | 0.99 |
| 12 | 0.273 | 0.500 | 0.318 | 1.09 |
Note. — The results of the Likelihood analysis to predict the number of true microlensing events in the MACHO LMC 5.7 year analysis with selection criteria A are compared for different microlensing event confirmation scenarios. The implied LMC microlensing optical depth for each number of events is also indicated. The preferred scenario uses a sub-sample of 5 events with 4 confirmed as microlensing and one event rejected, and this is identified in bold face.
| Event Set | # of | for confidence level: | ||||||||
|---|---|---|---|---|---|---|---|---|---|---|
| events | 0.001 | 0.01 | 0.025 | 0.05 | 0.16 | measured | 0.84 | 0.95 | 0.975 | |
| original-A | 13 | 0.40 | 0.53 | 0.60 | 0.67 | 0.83 | 1.10 | 1.47 | 1.73 | 1.86 |
| corrected | 7-12 | 0.24 | 0.36 | 0.44 | 0.50 | 0.66 | 0.99 | 1.32 | 1.58 | 1.72 |
| 4/4 confirmed | 7-12 | 0.28 | 0.41 | 0.49 | 0.56 | 0.72 | 1.09 | 1.38 | 1.64 | 1.78 |
Note. — This table compares the microlensing optical depth in units of for the original MACHO selection criteria A analysis with the corrected analysis presented here.
| Population | (days) | ||||
|---|---|---|---|---|---|
| spheroid | 0.19 | 129 | 8.8 | 0.90 | 0.18 |
| thick disk | 0.20 | 104 | 3.6 | 0.90 | 0.19 |
| standard thin disk | 0.36 | 101 | 1.3 | 1.7 | 0.35 |
| standard LMC disk | 1.6 | 120 | 50 | 5.8 | 1.21 |
| total (min disk) | 2.35 | - | - | 9.3 | 1.93 |
| maximum thin disk | 0.59 | 101 | 1.3 | 2.7 | 0.56 |
| maximum LMC disk | 2.6 | 120 | 50 | 9.8 | 2.05 |
| total (max disk) | 3.58 | - | - | 14.3 | 2.98 |
Note. — This table shows microlensing quantities for various lens populations, with the density and velocity distributions and mass functions described in A00. is the optical depth, is the mean lens distance, and is the total theoretical microlensing rate (see A00). The expected number of events includes our detection efficiency averaged over the distribution. The LMC values are averaged over the locations of our 30 fields. is the number of expected events. Two types of disk models are considered for the Milky Way: maximum disk models, which have enough mass to account for the rotation curves of each galaxy, and standard disk models, which require a massive dark halo made of non-microlensing objects to help support the rotation curves.