Evidence for TeV Gamma-Ray Emission from the Galactic Plane
Abstract
Gamma-ray emission from a narrow band at the Galactic equator has previously been detected up to 30 GeV. We report evidence for a TeV gamma-ray signal from the Galactic plane by Milagro, a large field of view water Cherenkov detector for extensive air showers. An excess with a significance of 4.5 standard deviations has been observed from the region of Galactic longitude and latitude . Under the assumption of a simple power law spectrum, with no cutoff, in the EGRET-Milagro energy range, the measured integral flux is . This flux is consistent with an extrapolation of the EGRET spectrum between 1 and 30 GeV in this Galactic region.
pacs:
95.30.Cq, 95.85.Pw, 96.40.Pq, 98.35.-aGamma rays are the best direct probe of cosmic rays outside the solar neighborhood. The interstellar medium, with its relatively high density in the Galactic plane, acts as a passive target for gamma-ray production by energetic cosmic rays. Mechanisms include interactions with gas cloud nuclei that produce gamma rays via decay, as well as cosmic-ray electron bremsstrahlung and inverse Compton scattering with the interstellar radiation field. Emission from a diffuse source concentrated in the narrow band along the Galactic equator was indeed detected by the space-borne detectors SAS 2, COS B (sas2_cos-b, ) and notably EGRET (egret, ) at energies up to 30 GeV. Above 1 GeV, the EGRET data in the region of the Galactic center show a hard spectrum with a differential spectral index , and a flux enhancement of as much as 60%, compared to models with production as the sole mechanism (dermer_pio, ) and using the local cosmic ray spectrum. Models that predict a Galactic flux enhanced by up to an order of magnitude over the mechanism at very high energies were proposed (galactic_flux, ; galactic_flux2, ; galactic_flux3, ; strong_flux, ). Upper limits have been set by several groups in the TeV range (whipple, ; hegra_lim, ; tibet_lim, ) and above 180 TeV (casa-mia, ).
The Milagro Gamma Ray Observatory (milagrito:nim, ; milagro_crab, ) is a large-field-of-view telescope designed to detect gamma rays near 1 TeV using water Cherenkov techniques to observe air shower particles that survive to the ground level. It is located at a latitude of and an altitude of 2630 m in the Jemez Mountains, New Mexico, USA. A 60m x 80m x 8m covered pond, filled with clear water, has a top layer of 450 photomultipliers (PMT), used to reconstruct the shower direction with angular resolution of about from the relative PMT timing. A bottom layer of 273 PMT’s is used for discrimination between gamma-ray and the dominant hadron-induced air showers. A Compactness cut, described in (milagro_crab, ), rejects about 90% of the hadronic background and retains about 45% of the gamma-ray signal for typical gamma-ray source spectra. On the opposite side of this cut there are 9 times more cosmic rays and 1.2 times more gamma rays, so that any gamma signal is suppressed by a factor of 7.4, compared to the Compactness-cut signal. Additional cuts in this analysis require a minimum of 50 top layer PMT hits, at least 20 of which participate in the angle fit, a zenith angle of and a declination of . Periods with abnormal event rate, zenith or azimuth distribution, corrupted records, or unstable operation were excluded. The results presented are from three calendar years of data collected by the Milagro detector starting July 2000.
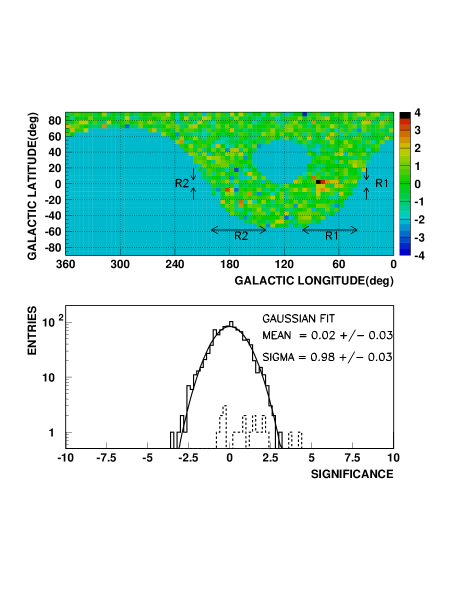
Figure 1 shows the EGRET gamma-ray flux along the Galactic equator(stan_hunter_private, ; egret, ), peaking near the Galactic center, and the Milagro exposure. The Galactic center is not visible to Milagro. Superposed is the nominal expected relative significance, the product of the EGRET flux and the square root of the Milagro exposure. The region with highest expected significance, R1 (), and a second region of high Milagro exposure R2 () both with were selected a priori, as two critical regions for separate statistical tests of a TeV gamma-ray signal. The Milagro exposures in R1 and R2 are similar. The average EGRET flux in R2 is about a factor of two lower than in R1 and the extrapolation to TeV energies may well be different in R1 and R2. R1 includes the Cygnus arm and R2 is in the extreme outer galaxy.

Gamma-ray emission from a gamma-ray source should appear as an excess of the observed events () above the expected background count () in a candidate source direction bin. If the background is isotropic in the celestial equatorial coordinate Right Ascension (RA) and the detector acceptance is not changing over some time window, the number of detected background events can be factorized into a time-independent acceptance shape in local angular coordinates (e.g. Hour Angle and Declination) and a time-varying rate . For a candidate source bin of interest (R1, R2, or any bin of Figure 2) this gives . We take advantage of a “time-swapping” method (cygnus_methods, ) to perform a Monte Carlo calculation of this integral. The data is split into 8-hour segments in which the and of recorded events are considered random samples of G(x) and R(t). By pairing and randomly selected from these samples, new Galactic coordinates are generated for background events. is incremented whenever such an event falls into the source bin.
We use a self-consistent modification, described in (fleysher_meth, ), of the method outlined above. The assumption that is time independent is relaxed, allowing the incorporation of a small diurnal modulation, from atmospheric changes, that is observed in the zenith distribution of events. The statistical error of the background is calculated with , where is the mean on-source to off-source exposure ratio and is the number of time swaps per event (errors, ). The events arriving from the Galactic plane are excluded from the “time-swapping”, in order to maintain the statistical independence of and (exclude, ).
A very small anisotropy of the cosmic-ray background, at the level of a few parts in , was observed in a separate Milagro study (mil_anisotropy, ) and is applied as a correction in this analysis. The anisotropy is consistent in shape and magnitude with reports from several other experiments (hall_anis, ; kamiokande_anisotropy, ; tibet_anis, ). Milagro’s observed anisotropy is described adequately by three longest wavelength harmonics in right ascension (RA), whose amplitude and phase vary linearly with declination (DEC). The anisotropy study provides a functional form for the background correction in this analysis. The subtracted sky map in RA DEC coordinates, with R1 and R2 excluded, is fit to this form, then extrapolated into these regions. The resulting fractional correction of the background, applied in Table 1, is and for R1 and R2 respectively; the errors are the statistical errors of the performed fit.
The test for a source signal is done taking R1 and R2 as two separate single bins. The steps are given in Table 1, with the fractional excess defined by . The statistical errors on and are combined in quadrature in the last line. An excess with a significance of 4.5 standard deviations is seen in R1 (signif, ), while no excess is detected in R2.
| Region | R1 | R2 |
|---|---|---|
Figure 2 (top) shows the two-dimensional color map of the significance in Galactic coordinates. An enhancement in a ridge along the Galactic equator in R1 is the most prominent feature. A Gaussian fit to the distribution of significances in Figure 2 (bottom) has the requisite normal distribution with zero mean and unit variance, while entries from R1 are shifted to the right.
Profiles of the fractional excess in latitude and longitude are shown in Figure 3. The peak of the enhancement is just north of the Galactic equator in Figures 2 and 3. Such a shift of the gamma signal towards positive latitudes was also seen in the EGRET data (egret, ), interpreted as a large scale warp of the Galactic H 1 clouds (warp, ).

To test for possible systematic problems in the analysis of the R1 excess, an identical analysis, including all modifications and corrections, was performed on 14 months of data, with the Compactness cut reversed to impoverish gamma rays relative to the cosmic-ray background. The result for R1, agrees well with , that is expected in the absence of systematic effects.
We interpret the excess in R1 (Table 1) as diffuse gamma-ray emission, or emission from unresolved gamma-ray sources, or both. The ratio of integral gamma- and cosmic-ray fluxes is calculated with:
| (1) |
Because the intrinsic energy resolution of Milagro is limited, individual event energies were not used in this analysis (energy_resolution, ). Our flux determination assumes that the gamma rays have a power law spectrum with no cutoff. The energy scale is determined from air-shower and detector simulations and confirmed by measurements of the Crab Nebula (milagro_crab, ). This gives a median energy of approximately 3.5 TeV, with a 20% systematic error, for gamma rays from the Galactic equator. The coefficient is the energy and transit averaged ratio of gamma-ray to cosmic-ray effective area, with the Compactness cut, obtained with Monte-Carlo air-shower and detector simulations (etavar, ). We report results for the power law index connecting the top EGRET point (10 - 30 GeV) and the Milagro point at 3.5 TeV, , for which . The error on is the estimate of Monte-Carlo uncertainties, including the energy scale error. We note that the flux is only sensitive to the absolute energy scale of Milagro in proportion to the difference of power law indices . The cosmic-ray integral flux above 3.5 TeV/nucleus is (jacee, ).
| SINGLE BIN | MULTIBIN FIT | |
|---|---|---|
For comparison, we fit the high end (1 GeV to 30 GeV) of the EGRET spectrum (egret, ; stan_hunter_private, ) in R1 to a power law, obtaining the index , softer than the Galactic center value of , quoted earlier. Extrapolations of the EGRET fits in R1 and R2, with their 1 standard deviation error corridors, are superposed on Figure 4.

As seen in Figure 4, the emission from R1 at a 3.5 TeV median energy is consistent with the extrapolation from the high-end EGRET data between 1 and 30 GeV. The absence of a detected excess in R2 requires a slight steepening of power law to ( cl) compared to . The Milagro flux upper limit of ( cl) in R2 reaches the EGRET extrapolation for that region.
These findings do not require models predicting a strong enhancement of the diffuse flux compared to conventional mechanisms, such as an increased inverse Compton component (pohl_esposito, ), a harder proton spectrum in the Galactic plane (galactic_flux3, ), or contributions from unresolved supernova remnants (galactic_flux2, ). Assuming a power law spectrum for gamma rays with no cutoff below 10 TeV, we can exclude for R1 a hard spectrum with power law index ( cl). The results are consistent with a gamma ray power law index that asymptotically approaches that of cosmic rays, as predicted if production becomes the main source of the gamma flux (dermer_pio, ).
In summary, Milagro has observed a 4.5 standard deviation excess in the mid-longitude galactic plane region R1. The consistency of EGRET and Milagro data under the simple power law assumption reduces the motivation for speculation about more complicated gamma-ray spectra. With its one integral measurement, however, Milagro cannot rule out alternate models. For the many possible multiparameter models, whose examination is beyond the scope of this letter, the Milagro result provides one constraint in their parameter space. In a model with a simple continuous power law spectrum from EGRET to Milagro energies, this measurement is evidence for gamma-ray emission at TeV energies, with a flux that is consistent with an extrapolation from EGRET, and a median energy of about 3.5TeV for the detected gamma rays.
The authors thank Scott Delay and Michael Schneider for their dedicated efforts on the Milagro experiment. We thank Stan Hunter for providing the EGRET data. This work has been supported by the National Science Foundation (under grants PHY-0075326, -0096256, -0097315, -0206656, -0245143, -0245234, -0302000, and ATM-0002744) the US Department of Energy (Office of High-Energy Physics), Los Alamos National Laboratory, the University of California, and the Institute of Geophysics and Planetary Physics.
References
- (1) R.C. Hartman et al., Astrophys. J. 230, 597 (1979).
- (2) S. D. Hunter et al., Astrophys. J. 481, 205 (1997).
- (3) C. D. Dermer, Astron. Astrophys. 162, 223 (1986).
- (4) P. Chardonnet et al., Astrophys. J., 454, 774 (1995).
- (5) E. G. Berezhko and H. J. Völk, Astrophys. J. 540, 923 (2000).
- (6) F. A. Aharonian and A. M. Atoyan, astro-ph/0009009 (2000).
- (7) A. Strong et al., Astrophys. J. 613, 956 (2004).
- (8) S. LeBohec et al., Astrophys. J. 539, 209 (2000).
- (9) F. Aharonian et al., Astron. Astrophys. 375, 1008 (2001).
- (10) M. Amenomori et al., Astrophys. J. 580, 887 (2002).
- (11) A. Borione et al., Astrophys. J. 493, 175 (1998).
- (12) R. Atkins et al., Nucl. Instr. and Meth. A449 478 (2000).
- (13) R. Atkins et al., Astrophys. J. 595, 803 (2003).
- (14) The EGRET data was provided by S. D. Hunter, private communication (2002).
- (15) D. E. Alexandreas et al., Nucl. Instr. and Meth. A328, 570 (1993).
- (16) R. Fleysher et al, Astrophys. J. 603, 355 (2004).
- (17) Calculated according to the statistic , Eq.(8) of (fleysher_meth, ), a variant of the Li and Ma statistic (li_ma, ) shown to converge to it in (fleysher_meth, ).
- (18) T. Li and Y. Ma , Astrophys. J. 272, 317 (1983).
- (19) The slightly large band also excludes the possible influence of the Crab Nebula, known to emit gamma rays in the TeV energy region (whip_crab, ; milagro_crab, ). Disks of radius centered on the Sun and Moon, two moving sinks of comic rays, were also excluded.
- (20) T. C. Weekes et al., Astrophys. J. 342, 379 (1989).
- (21) R. Atkins et al., in preparation.
- (22) D. L. Hall et al., J. of Geophys. Res., 104 A4, 6749 (1999).
- (23) K. Munakata et al., Phys. Rev. D56, 23 (1997).
- (24) M. Amenomori et al. , Phys. Rev. Lett 93, 061101 (2004).
- (25) An excess signal from this region was also seen in two other Milagro analyses.
- (26) A. P. Henderson et al. Astrophys. J. 263, 116 (1982).
- (27) For more recent data, event energy reconstruction is made feasible by locating the shower core with an “outrigger” array installed around the pond detector.
- (28) varies by for between 2.5 and 2.9.
- (29) K. Asakimori et al., Astrophys. J. 502, 278 (1998). The error on this flux is negligible compared to 30%. The contribution from nuclei heavier than H and He is negligible.
- (30) M. Pohl and J. A. Esposito, Astrophys. Jour. 507, 327 (1998).