A New View of the Circumstellar Environment of SN 1987A
Abstract
We summarize the analysis of a uniform set of both previously-known and newly-discovered scattered-light echoes, detected within 30′′ of SN 1987A in ten years of optical imaging, and with which we have constructed the most complete three-dimensional model of the progenitor’s circumstellar environment. Surrounding the SN is a richly-structured bipolar nebula. An outer, double-lobed “peanut,” which we believe is the contact discontinuity between the red supergiant and main sequence winds, is a prolate shell extending 28 ly along the poles and 11 ly near the equator. Napoleon’s Hat, previously believed to be an independent structure, is the waist of this peanut, which is pinched to a radius of 6 ly. Interior, the innermost circumstellar material lies along a cylindrical hourglass, 1 ly in radius and 4 ly long, which connects to the peanut by a thick equatorial disk. The nebulae are inclined 41°south and 8°east of the line of sight, slightly elliptical in cross section, and marginally offset west of the SN. The 3-D geometry of the three circumstellar rings is studied, suggesting the northern and southern rings are located 1.3 and 1.0 ly from the SN, while the equatorial ring is elliptical (), and spatially offset in the same direction as the hourglass. Dust-scattering models of the observed echo fluxes suggest that between the hourglass and bipolar lobes: the gas density drops from 1–3 cm-3 to cm-3; the maximum dust-grain size increases from m to 2m; and the silicate:carbonaceous dust ratio decreases. The nebulae have a total mass of , yielding a red-supergiant mass loss around yr-1. We compare these results to current formation models, and find that no model has successfully reproduced this system. However, our results suggest a heuristic evolutionary sequence in which the progenitor evolves through two “blue-loops,” perhaps accompanied by a close binary companion.
Subject headings:
circumstellar matter — dust — scattering — stars: mass loss — supernovae:individual (SN 1987A) — techniques: image processing1. INTRODUCTION
Supernova 1987A, the first naked-eye supernova (SN) in four centuries, was first discovered on 1987 Feb. 24.23 at the Las Campanas Observatory (Shelton 1987), and was later identified with the Large Magellanic Cloud (LMC) progenitor, Sk °202 (Sanduleak, 1969), a B3 I supergiant (Rousseau et al., 1978). From its spectral type and distance, we infer a luminosity of , a surface temperature 15000–18000 K, and a radius , which imply that the star exploded as a blue supergiant (or BSG; Woosley et al., 1987). Spectra taken shortly after the explosion was discovered revealed Balmer lines, indicating a Type II SN, but expanding at nearly . A number of anomalies, such as this high expansion velocity, a weak initial outburst, a very hot UV spectrum at early times, and subsequent rapid color evolution, indicated a compact progenitor envelope, typical of a BSG, rather than the expected red supergiant (RSG) progenitor. Heavy mass loss could have driven Sk °202 to the BSG stage (mass loss being reasonable given the large number of Wolf-Rayet stars in the LMC), although evidence for a substantial envelope (the long slow rise of the optical light source, the late appearance of near-IR H lines and a lack of early escape X and -rays) also exists. For a complete accounting, see the review by Arnett et al. (1989).
Panagia et al. (1987) reported narrow UV emission lines in International Ultraviolet Explorer spectra taken on day 80, which they interpreted as arising from pre-existing CS material. An analysis of these spectra by Fransson et al. (1989) revealed a large overabundance of nitrogen, suggesting both significant CNO processing by the progenitor, and that a reasonable fraction of the progenitor’s hydrogen envelope had to have been ejected to reveal such material. This argues that the star first evolved into a RSG before returning to the blue in a so-called “blue loop” (Hofmeister et al., 1964). Both RSG (Humphreys & Davidson, 1978) and BSG (Humphreys & McElroy, 1984) stars are known within the LMC, thus this evolutionary sequence is consistent with known populations.
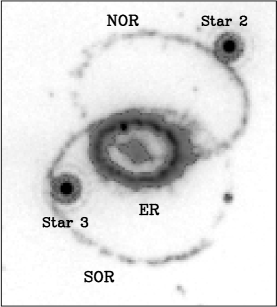
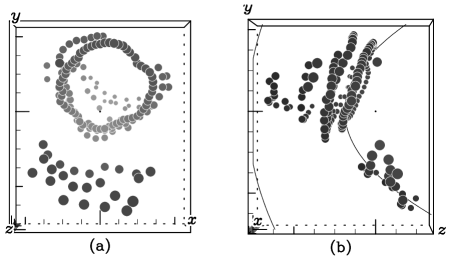
The first resolved images of this CS material were taken on days 750 (Crotts et al., 1989) and 1027 (Wampler et al., 1990a), showing a central, elliptical structure, surrounded by two outer loops (Crotts et al., 1989; Wampler et al., 1990b). The geometry of this material was the subject of some debate, remaining poorly understood until Hubble Space Telescope (HST) imaging (Burrows et al., 1995, and references therein) clearly revealed a dense circumstellar equatorial ring (ER) flanked by two larger outer rings (ORs), as shown in Figure 1. To explain how a mass-losing supergiant produced this nebula, most authors invoke the interacting stellar winds scenario (Kwok, 1982; Balick, Preston & Icke, 1987), in which colliding winds from the BSG and RSG mass-loss stages conspire to create three ring-like overdensities within the CS environment (CSE). These were ionized by the SN light pulse and are observed today through recombination cooling.
Since the SN lightcurve was strongly peaked for a finite duration, and the progenitor is surrounded by a structured CSE, we expect that the light pulse will scatter off of surrounding reflective material (e.g., dust), producing “light echoes” that are observable long after the SN has faded (Couderc, 1939). Bond et al. (1989), Couch & Malin (1989), and Crotts & Kunkel (1989) discovered a light echo at whose position agrees well with the predicted location of a contact discontinuity (CD) between the RSG outflows and the interstellar bubble formed by the early-type blue MS progenitor’s winds (Chevalier & Emmering, 1989). Crotts et al. (e.g., Crotts & Kunkel, 1991; Crotts et al., 1995, hereafter CKH95) have continued to search for light echoes in a regular campaign using emission-suppressed continuum imaging. They have found echoes indicative of the structure of the three-ring nebulosity, forming an equatorial waist and sides of an hourglass, yet ending abruptly near the ORs with no capping surface. Outside this inner nebula, they found four additional features: (1) a reconfirmation of the CD light echo of Bond et al. (1989) at ; (2) a sheet along the equatorial plane of the ER, bisecting the nebula; (3) diffuse flux from the hourglass nebula to the CD; and (4) a discontinuity in this nebula, called “Napolean’s Hat” (Wampler et al., 1990a).
Observation and modeling of this circumstellar environment provide a unique opportunity to reconstruct the mass-loss history of the progenitor. The SN 1987A nebula is one example of a much larger class of bipolar outflows, which occur in nearly all evolved stars (e.g., luminous blue variables, B[e] stars, AGB mass loss, bipolar and asymmetric planetary nebulae). This “stellar paleontology” is of immense importance for understanding bipolar-outflow and bipolar-nebula formation mechanisms, not just of this object or in intermediate-to-high mass stars, but in stars of all masses.
We summarize in this paper an observational effort, at the highest sensitivity and resolution to date, to understand more fully the entire circumstellar environment of SN 1987A, and to recreate a more complete history of the progenitor’s mass-loss, as revealed by light echoes in 16 years of optical imaging. After introducing echoes in §2, we summarize the data and reduction in §3. These data are used to build a complete model of all material within 30 ly of the SN, the 3-D analyses of which are summarized in §4, followed by the dust properties in §5. Full details of these sections are presented in Sugerman et al. (2005, hereafter Paper II).
With a much greater volume of the progenitor’s CSE revealed, we find that no extant model adequately explains how that environment was formed. In §6, we review and critique formation scenarios for this system, including the progenitor’s MS wind, interacting supergiant winds, wind-compressed disks, and the influence of a binary companion. We use the light-echo data to constrain the parameter space of these models, and we qualitatively sketch a hybrid formation sequence for the entire CSE in §7. It is our hope that the results presented here will serve as a significantly-improved set of constraints for hydrodynamic models of the CSE formation, for stellar-evolution models of the progenitor, and for addressing the general question of asymmetric and bipolar stellar outflows.
2. Light Echoes
When a light pulse is scattered by dust into the line of sight, an observable echo is produced, provided the pulse is sufficiently luminous and the dust sufficiently dense. An echo observed a given time after the pulse must lie on the locus of points equidistant in total light travel from the source and observer, that is, an ellipsoid with known foci. This simple geometry, shown in Figure 2, directly yields the line-of-sight depth (and hence the three-dimensional, or 3-D, position) of an echo, uncertain only by the assumed distance to the source. For , one finds (Couderc, 1939)
| (1) |
where is the distance of the echo from the source in the plane of the sky, is the scattering angle, and is the delay between observing the echo and unscattered light pulse.
A complete discussion of light echoes, including single-scattering models and the observability of echoes around a wide variety of cataclysmic and other variable stars, can be found in Sugerman (2003). The relevant light echo model, dust and outburst properties for SN 1987A are summarized in §LABEL:I-sec-le of Paper II. In general, echo brightness scales directly with dust density, inversely with distance, and decreases non-linearly with increasing scattering angle.

3. Data and Reduction
3.1. Observations
SN 1987A has been observed many times per year since day 375 (after core collapse) in a ground-based campaign to monitor the appearance and evolution of its light pulse as it illuminates circumstellar and interstellar material. To minimize confusion from sources of nebular-line emission, four specially-selected continuum bands were used for the monitoring campaign, centered at 4700, 6120, 6880, and 8090Å. Some data from this campaign have previously been reported by Crotts et al. (1989); Crotts & Heathcote (1991); Crotts & Kunkel (1991); and CKH95 in studying the circumstellar environment, and in Xu et al. (1994, 1995) and Xu & Crotts (1999) for interstellar echoes. Seventeen epochs of imaging with high signal-to-noise, good seeing (arcsec or better), and sufficient resolution to resolve most crowded stars exist between 1998 Dec and 1996 Jan. These data are supplemented with archival HST Wide Field and Planetary Camera 2 (WFPC2) imaging taken between 1994 and 2001. Full details of the observations are given in §LABEL:I-sec-echodata of Paper II.
3.2. Data Reduction
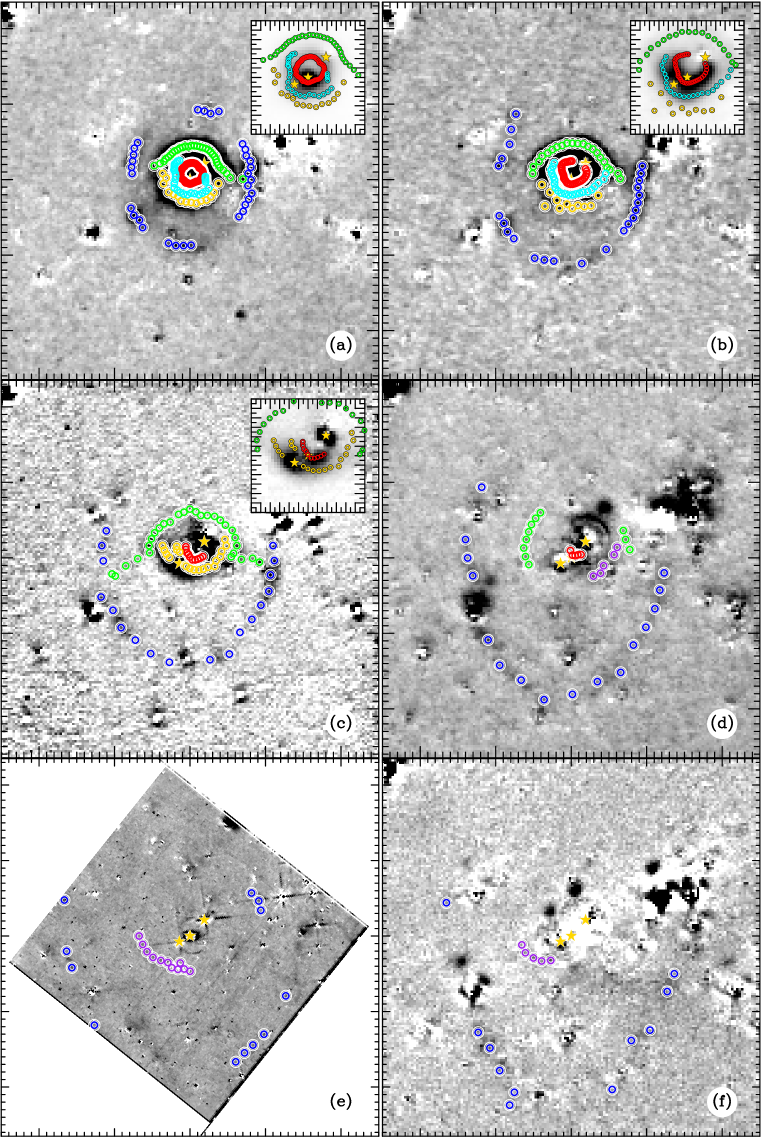
The complete data-reduction is presented in §LABEL:I-sec-reduc of Paper II. To search for light echo signal, we employ a customized implementation of the PSF-matched difference imaging (Tomaney & Crotts, 1996) IRAF package difimphot, fully described in §LABEL:I-sec-dip and Appendix A of Paper II. A subset of the PSF-matched difference images are shown in Figure 3; see §LABEL:I-sec-lea-data of Paper II for additional data and discussion. The innermost echoes were particularly bright up to day 1469, and are washed out at the brightness-stretch needed to display the outer echoes. In such cases, a 12′′ inset centered on the SN is shown at the top right of each panel, scaled in brightness to better-resolve the innermost echo signal.
3.3. Echo Measurement and Visualization
Echoes were detected and measured in difference images by fitting a series of convolved moffats to radial surface-brightness profiles of arclength 10°centered on the SN. See §LABEL:I-sec-lea-data-echoes of Paper II for complete details. The centers of all moffats have been marked in the difference images (Fig. 3), and color coded to compare echoes believed to be physically associated.
During their detection, echoes were categorized as belonging to one of the three expected structures: (1) a circumstellar hourglass-shaped nebula reported in CKH95, (2) Napoleon’s Hat (Wampler et al., 1990a), or (3) the discontinuity between the progenitor’s RSG and MS winds (Chevalier & Emmering, 1989). In Figure 3, these have been color coded red, green, and blue, respectively. However we also found additional echoes between the hourglass and Napoleon’s Hat, arbitrarily colored cyan for those looping to the north of the SN, or gold to the south. In later epochs, many of these southern echoes have positions that are more consistent with a counterpart to Napoleon’s Hat, and have been marked purple.
That diffuse structure exists between the inner hourglass and Napoleon’s Hat has been previously reported by Crotts & Kunkel (1991) and CKH95. These are consistent with the cyan and yellow echoes identified in the same region of the current data, which now map out a much more extensive volume of the innermost CSE. Contact-discontinuity echoes have been previously reported in observations only up to day 1028, while we are able to trace this structure through day 3270. Napoleon’s Hat was imaged as early as day 850 and up to day 1650 by Wang & Wampler (1992), while we detect its signal from day 659 to 2095. We believe this is the first discussion of the southern-counterpart (purple) to Napoleon’s Hat, which was illuminated between days 1787–3270.
3.4. Echo Visualization
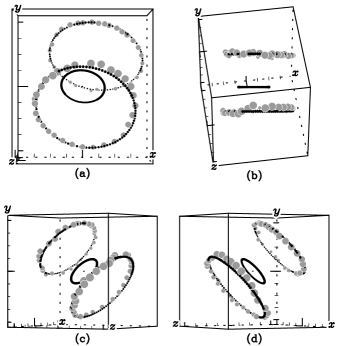
To study echo positions in 3-D, we have custom-written graphics software to perform simple renderings, in which the positions of the echoes are transformed to allow viewing from any angle. The method is fully explained in §LABEL:I-sec-lea-analy-3de of Paper II, and briefly annotated in the caption of Figure 4, which shows an illustrative example.
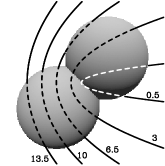
The region of space probed by a light echo is an unusual geometric function, and we are generally unfamiliar with viewing structures by their intersection with parabloids. To facilitate the understanding of this mapping, we have rendered echoes from a bipolar nebula in Figure 4. These are intended to guide the reader in visualizing such intersections, and in translating from 2-D data on the sky (left column) to 3-D positions in real space (right columns). This also shows that the geometry of a structure can only be deduced from multiple echoes. See §LABEL:I-sec-lea-analy-parabs of Paper II for more detailed discussion, and a map of the parabolae corresponding to all epochs of data.
Echo positions in 3-D are computed from their epoch and 2-D image positions using equation (1), assuming the echo center is produced by the light pulse maximum at day 87. We adopt a distance to the SN of 50 kpc, a common average between many of the derived LMC distances (Gould & Uza, 1998; Feast, 1999; Romaniello et al., 2000).
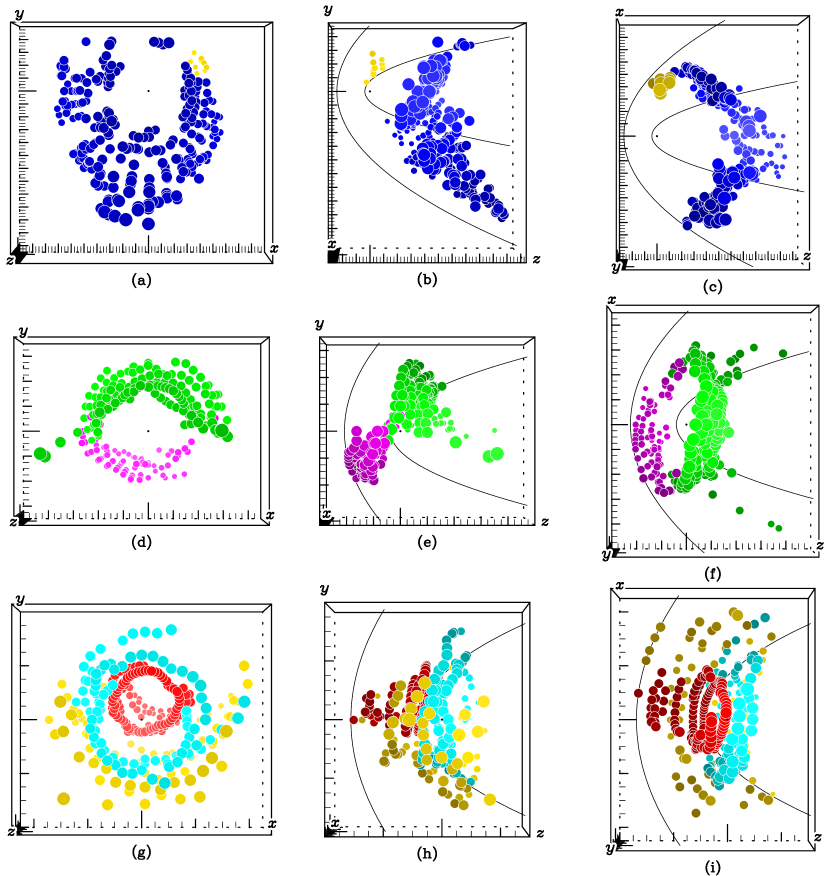
The 3-D positions of all echoes are rendered in Figure 5. The top, middle, and bottom rows show the contact discontinuity (CD), Napoleon’s Hat (NH), and the inner circumstellar (CS) material, respectively. Colors correspond to those indicated in Figure 3, except for the yellow points in the CD, which were identified in WFPC2 images very close to a bright star cluster northwest of the SN (P.A. 300°, ). We distinguish these data because large residuals from the closely-spaced, bright stars made it impossible to verify the echoes in ground-based images.
4. A Complete Picture of the Circumstellar Environment
A rigorous analysis of the 3-D structure of the light echo data is presented in Paper II, §LABEL:I-sec-CD–LABEL:I-sec-CS, however we describe the results in the following subsections. We begin with the reasonable assumption that the echoes lie on continuous surfaces, only subsets of which have been illuminated. Echo brightness decreases with increasing scattering angle and distance from the illuminating source, and increases with dust number and column density. That echoes were not observed in some regions between the parabolae in Figure 5 need not imply lack of scattering dust, but may result from unfavorable geometry, or limitations in the data quality.
4.1. Contact Discontinuity Echoes
When examined in spherical-polar coordinates, the CD echoes (Fig. 5a–c) appear to trace two different geometric shapes. Points east and west of the SN form a shell-like feature at roughly constant radius, while points south of the SN (P.A. 150°–210°) form a radial feature at roughly constant inclination. In both cases, the points appear to lie on a surface with some degree of symmetry, such as a spheroidal or conical structure. Since only a partial cross section of the CD nebula has been illuminated, finding its inclination through numeric minimization of a merit function (e.g. the best-fit cone or line; see Appendix B of Paper II) was not highly successful. We supplemented those results by testing how the echo points compared to geometric figures observed at different orientations, and conclude that the CD echoes lie roughly on a surface of rotation about a single axis inclined 40°south and 8°east of the line of sight. This axis may also be offset east of the SN by ly. The cross section gives some indication of an ellipticity of , with the major axis aligned toward north, however this is not a robust measurement.
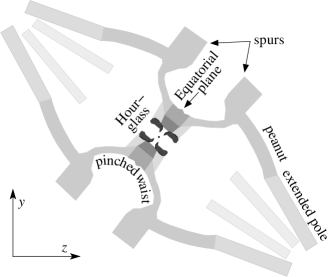
The data are transformed into a “primed” cylindrical coordinate system about this axis, designated by along the axis and the radius. Figure 6 shows the resulting radial profile . Assuming these data trace a structure that (1) has rotational symmetry about , and (2) is symmetric about the equator (), an average radial profile of versus can be constructed by binning the points along the axis. This (and standard deviations in each bin) is shown over the individual data. Some circles located at and =4–8 ly appear disconnected from the rest of the shell-like material. These points, which we call the “spurs,” were treated separately when making the average radial profile.
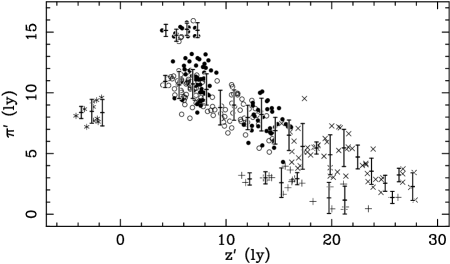
The probable CD structure is visualized by revolving this function about the symmetry axis, reflecting it about the equator, and reinclining it to the favored orientation, as shown in Figure 12a–b. Colors are the same as Figure 5, only the southern echoes have been colored red and green to distinguish points marked with “” and “+” in Fig. 6. Figure 12c–d shows the complete structure in monotone grey, overlaid with the actual echo points from Figure 5, to show exactly which parts of the complete structure were sampled.
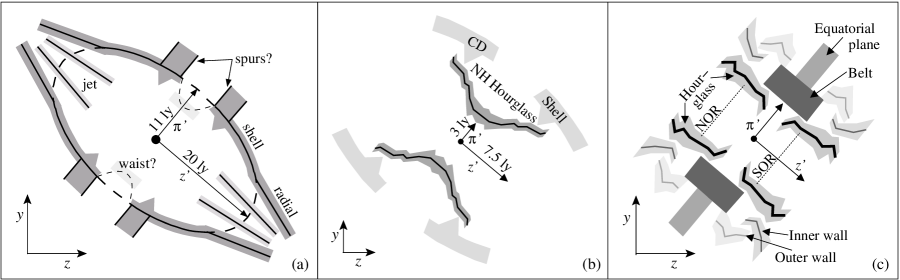
The complete structure is fairly complicated, and can not be described by a single geometric function. Figure 11a shows a scaled cartoon of the salient features. A “shell” lies along a prolate spheroid with a polar axis of 20 ly and equatorial axes of 11 ly. However, the ends of this spheroid have been drawn out into tapering, “radial” cones with opening angles of about 35°, extending from 16 to 28 ly from the SN. Embedded within this prolate structure are narrower, tapering cones (the “jet”) extending from 10–26 ly from the SN, with an opening angle of about 20°, and a maximum radius of 3 ly. The “spurs” lie along a cylindrical annulus that smoothly encircles the CD.
It is unclear whether the prolate shell is continuous in along its equator (dashed equatorial lines in Fig. 11a), since no echoes were observed from that region. Whether this is due to shadowing from material closer to the SN is addressed in §LABEL:I-sec-density-density-shadowing of Paper II. The northwestern-WFPC2 echoes are positioned at ly along the axis, and at roughly 8 ly in radius. This could suggest the prolate shell is pinched at its waist to a smaller radius of 8 ly. However given the very limited spatial sampling of these inner echoes, there is little evidence that they lie on a uniform structure. Similarly, very little signal was detected from the spurs which may suggest that they are isolated clumps, rather than a uniform feature.
4.2. Napoleon’s Hat
Figures 5d–f show the 3-D positions of the NH echoes. The northern (green) points forming the familiar bow-shape for which this structure was named (Wampler et al., 1990a) appear to lie on a thin, cylindrical shell that is completed by the newly-discovered southern points. To avoid confusion between this and previous work, we will keep the name “Napoleon’s Hat,” by which we refer to the entire ensemble of echoes. Despite the temptation to call the southern points “Napoleon’s Collar,” we will simply refer to these as NH-north and NH-south, when needed.
Two nearly-horizontal features protrude from this shell toward the observer, appearing horn-like when viewed from above (panel f). In the following discussion, we refer to these as the “horns,” to distinguish them from the rest of the NH material. These are the echoes seen in early imaging that bridged between NH-north and the larger-radii CD echoes (Fig. 3).
Viewed in spherical-polar coordinates, the NH echoes are consistent with a cylinder or hourglass. We measured the shape and inclination of such structures by fitting a biconical frustum to all points, as explained in Appendix B.4 of Paper II. The best fit is an hourglass with elliptical cross section, oriented 40°south and 7°east of the line of sight. The semi-major and minor axes are 4.6 and 3.8 ly, with opening angles at the axes of 28 and 40°, respectively, and the major axis is rotated east of north. That the cross-section is elliptical is unexpected, and we reverified this by directly examining the data looking down the axis of inclination. The best-fit ellipse (Appendix B.2 of Paper II) to the resulting distribution has negligible offset from the origin, and with the major axis rotated east of north.
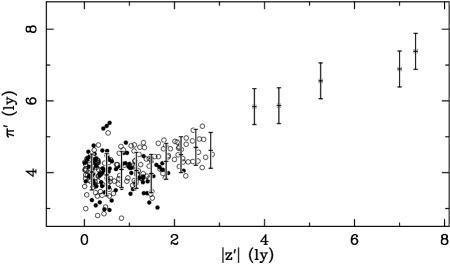
Removing this ellipticity from the radial values of as a function of yields the distribution shown in Figure 7. Also shown is the average radial profile of the NH echoes, generated by binning the points along the inclination axis and computing the average radius about that value. As with the CD, we visualize the probable structure containing these echoes by reflecting this average radial profile about the equator and revolving it around the axis. The result is an inclined hourglass, as rendered in Figure 12e–h.
An examination of Figure 12h shows that very little of the hourglass was actually probed by the horns. We show in §LABEL:I-sec-NH-geom-horns of Paper II that such limited illumination was a natural result of the scattering geometry of this complete structure. The hourglass therefore flares to a radius (or semi-minor axis if the cross section remains elliptical) of ly about 7 ly from the SN along the axis of symmetry.
The complete cross section is shown in the cartoon sketch in Figure 11b. Of note are the radial features in, and about 1.5 ly above/below, the equatorial plane. CKH95 reported a small set of echoes within 3 ly of the SN that are coincident with the ER plane, which they interpreted as evidence for an extended circumstellar equatorial disk. These NH equatorial echoes appear to extend this disk to a radius of 5 ly, with a thickness of ly. We note that this structure is inconsistent with NH being a parabolic bow-shock north of the SN, as proposed by Wang & Wampler (1992) and Wang, Dyson, & Kahn (1993). This is discussed in greater detail in §LABEL:I-sec-NH-comp of Paper II.
4.3. Inner Circumstellar Material
The inner 3′′ surrounding SN 1987A have been previously studied by CKH95 using a subset of the data presented here, in which the authors reported a double-lobed CS hourglass with a distinct cylindrical symmetry axis. Although the red echo points in Figure 5g–i appear to lie along such a surface, we cannot immediately explore this feature in our data since it is unclear which extended-flux echoes (cyan and gold points) are associated with an hourglass. We use the work of CKH95 as a springboard to help disentangle our data.
Fitting a biconical hourglass to the CKH95 data, we find the structure is inclined 45°south and 8°east of the line of sight. This compares favorably to the orientation they reported using a minimization-of-scatter estimator. Adopting this as a preliminary orientation, we transformed our CS echo points into cylindrical coordinates about this axis, which revealed an additional subset consistent with those initially identified as part of the hourglass. The full set of probable hourglass points is rendered in Figure 8. As can be seen in panel (b), only a small arc along the southernmost limb of of the southern lobe was probed by the earliest observed echoes.
A combination of fitting biconical hourglasses to these data, and ensuring that the inner waist of this hourglass reproduces the observed shape of the ER, yields the 3-D geometry of both structures. We find the hourglass is inclined 41°south and 8°east of the line of sight, with its axis shifted ly west of the SN. The waist has a semi-major axis of ly rotated north of east, with , and the frusta have half-opening angles of . Note that this is consistent with the findings by Sugerman et al. (2002) that the nebula is offset slightly west of the SN.
Deprojected by the above inclination, the ER is best-fit by an ellipse with major axis 082 rotated 9°north of east, , and the centroid is shifted 19 mas west of the SN. This is the first direct measurement of the ER’s orientation and deprojected geometry. Full details of these analyses are presented in §LABEL:I-sec-CS-geom of Paper II.
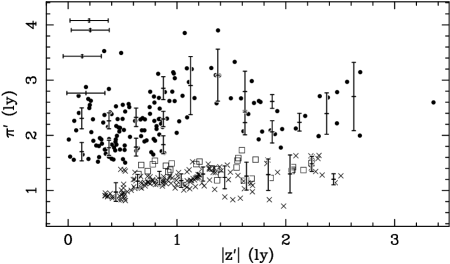
As in the previous two subsections, we incline the data about this axis, remove any ellipticity, and plot the cylindrical-radial profile in Figure 9. Extended flux points that are now associated with the hourglass are plotted as squares. A large subset of the extended-flux echoes (circles) are concentrated within 1 ly of the equatorial plane , between 1.5–4 ly from the SN, and appear to form a thick equatorial waist or belt circumscribing the hourglass. As in the previous two sections, we measure the average radial profile of these points in bins along . There is much structure to these data, which required the fitting of six profiles. We again visualize the nebula by reflecting each profile about the equator, and revolving it around the cylindrical axis, as rendered in Figure 12i–p, and sketched in cross section in Figure 11c. We identify five features in this data, discussed below.
The innermost radial structure is the hourglass, colored red in Figure 12i–p. This is fairly cylindrical (opening angle 12°), with a semi-minor axis of 1.2 ly, tapering close to the equator and opening just slightly at large . A very small number of points suggest that it also tapers around ly and flares at and 1.4 ly, but these features are marginal. Consistent with CKH95, we do not see evidence for a “capping surface” to this structure, as would be expected from a peanut-like nebula. To distinguish this hourglass from the larger one containing the NH echoes, we refer to each by their association, i.e., the former is the “CS hourglass.”
In Figure 9, many of the extended-flux points (squares) lie just outside the average position of the hourglass. Since most of these points are part of the southern lobe, this could suggest it is wider than its northern counterpart. A more likely interpretation is that many of the southern-lobe points represent dust just outside the densest part of the hourglass, which was itself illuminated prior to our earliest epoch.
Immediately surrounding the CS hourglass is the thick waist of extended high-surface brightness, which we call the “belt” (colored green in Fig. 12i–j). It extends ly along the axis, and from 1.5 to 2.5 ly in radius. Beyond the outer radius of this belt, echoes lie fairly well constrained to the equator, tracing a thinner (0.5 ly thickness in ) but extended equatorial plane (blue in Fig. 12i–j) to an outer radius of ly. The belt does not appear to taper smoothly into the thinner equatorial plane, but rather has a fairly sharp transition at its outer boundary.
The rest of the CS material lies along one of two “walls.” The inner wall is colored cyan in Figure 12i–j, extending 1.5 to 2.6 ly along the axis, and may be considered to join with the hourglass around ly. The outer wall, colored gold, bridges the belt and the inner wall at radii between 2.6 and 3.4–4.0 ly. We note the conspicuous lack of echo signal between the hourglass and outer wall around ly, and question whether this is real, perhaps indicative of episodic mass loss, or simply a gap in our data.
4.4. The Geometry of the Outer Rings
While great attention has been placed on the geometry of the ER (Jakobsen et al., 1991; Plait et al., 1995; Burrows et al., 1995), relatively little work exists on the ORs (see Burrows et al., 1995; Crotts & Heathcote, 2000). Now that a 3-D map of the nebula exists, we can investigate how it can constrains the geometry of the ORs (full details are in in §LABEL:I-sec-CS-rings of Paper II).
The North OR (NOR) appears to lie along the outer edge of the north CS hourglass, while the South OR (SOR) seems to lie at the intersection between the southern hourglass and the belt, perhaps indicating an interaction between wind that created the hourglass and the pre-existing belt material.
The 3-D positions of the ORs are rendered in Figure 10, and appear reasonably planar. We approximate both rings as planar ellipses, fit to each distibution of points viewed along the CS inclination axis. The fitted parameters are listed in Table 1, where are the centroid offsets from the axis, is the distance to the SN along the axis, are the semi-major and minor axes, and is the P.A. of the major axis from north. For completeness, the parameters for the ER are also listed. These fits are also indicated in black in Figure 10. The approximation to the NOR is quite good, but the SOR ellipse fails to intersect the points that pass just north and west of the ER. This is not suprising, since no single ellipse can fully reproduce the observed shape of the SOR unless it is non-planar. We have used these planar approximations in the echo renderings throughout this work.
| Ring | ||||||
|---|---|---|---|---|---|---|
| (ly west) | (ly north) | (ly) | (ly) | (ly) | (°) | |
| ER | 0.015 | 0.0 | 0.0 | 0.647 | 0.98 | 81.1 |
| NOR | 0.26 | 0.04 | -1.36 | 1.42 | 0.94 | 70.5 |
| SOR | 0.19 | 0.06 | 1.00 | 1.59 | 0.92 | -1.1 |
4.5. Summary
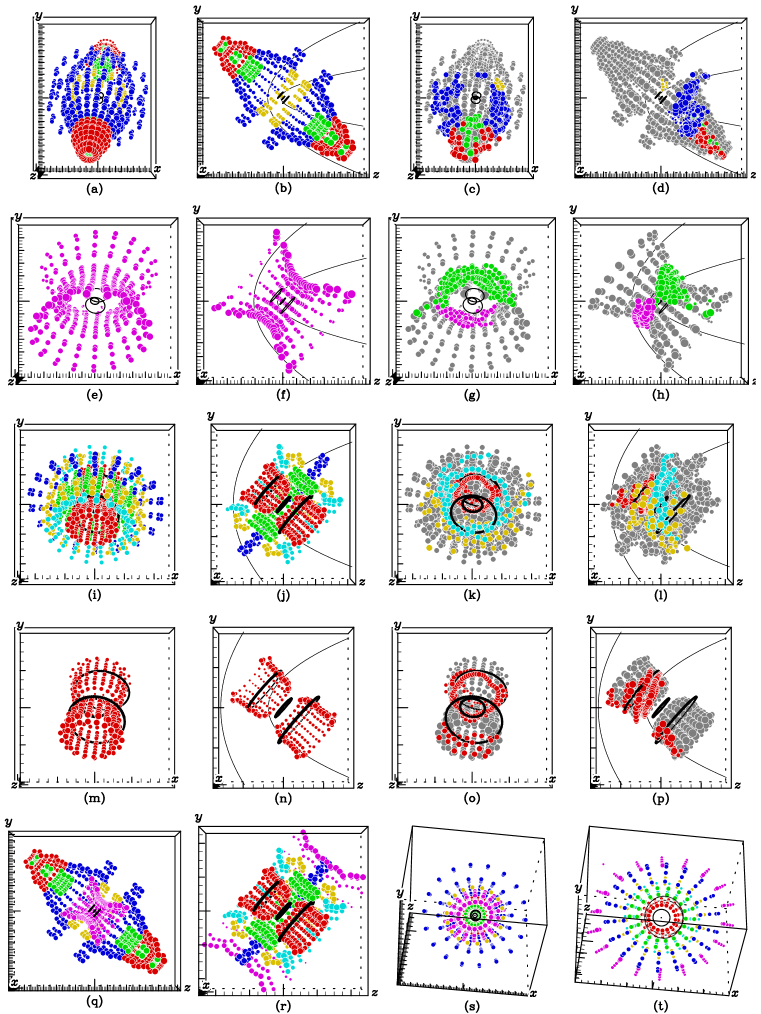
The probable geometry and structure of the echoes within 25′′ of SN 1987A are rendered in Figure 12, and summarized in Table 2. The final column gives the approximate total volume of the structure containing each echo, found by integrating the radial profiles in Figures 6, 7, and 9 along, and revolved about, the respective inclination axes.
The east/west and north/south inclinations are quite consistent, suggesting all circumstellar material shares a common inclination near south and west. Furthermore, the structures appear to join to form a single nebula, as follows. The CS gas is nested neatly within the NH material, as shown in Figure 12r, with the CS belt, equatorial plane, outer wall, and the waist of NH consistent with a single, uniform thick waist, extending inward to the CS hourglass (Fig. 12o). The outer edges of the NH hourglass almost reach the inner spur of the CD shell (Fig. 12q), and indeed the echoes as viewed on the sky do connect at early times (Fig. 5). As shown in Figure 12m, no material was illuminated along the equatorial plane exterior to NH. We do not believe this region was shadowed from the SN by material at smaller radii (§5 of this paper, or §LABEL:I-sec-density-density-shadowing of Paper II), thus it is unlikely there is any higher density gas outside the waist of NH. As such, we conclude the NH hourglass is the pinched waist of the CD.
Figure 13 shows all circumstellar material, simplified according to the above arguments. The outer structure is peanut-like, extended along the poles to ly, and narrowly-pinched at the waist at ly. We will refer to this outer shell (traced by the CD and outer NH echoes) as the “Peanut.” Roughly 35°from the equatorial plane are the spurs, extending ly out from each lobe, perpendicular to the Peanut’s axis. Unlike the northwestern WFPC2 echoes, these spurs do appear at more than one location, but they are limited enough in extent that it is unclear whether they are uniform features that encircle the entire structure, or isolated clumps.
Inside the equatorial region of the Peanut is a thick ( ly in radial thickness, 2 ly in axial length) annular ring (or belt), which extends inward until it terminates at the inner CS hourglass. The extent of this waist in is unclear. Echoes were detected outside the CS hourglass at most equatorial () radii between 1.6 and 4 ly, with a vertical () distribution extending at least as far as the CS hourglass itself. Still, the bulk of material is within 1 ly of the equator.
5. Density and Mass of the CSE
To constrain the gas density and dust composition of the CSE, we apply a dust-scattering model (§LABEL:I-sec-le of Paper II) using the surface brightnesses of all echoes discussed in the previous section. The reader is referred to §LABEL:I-sec-density of Paper II for the complete analysis, as only a brief summary is presented here.
The CD echoes are best fit with large (Åm) grains consistent with an LMC-abundance of silicate and carbonaceous dust. Outer NH data ( ly) are more consistent with Si-dominated large grains, but perhaps with a slightly-smaller maximum grain size than for the CD. The inner NH points, along with the CS echoes, are well fit by Si-only dust with m. The general trend is that inner echoes are better reproduced by smaller, Si-dominated dust, and with increasing distance, the grain sizes and C-content increases.
Fischera et al. (2002) have modeled mid-IR emission from collisionally-excited dust grains heated in the shocks between the CS gas and the forward blast of the SN. They find the emission is best explained by small () grains with a Si-Fe or Si-C composition. The dust abundance is quite low, which they attribute to evaporation from the UV flash and sputtering in the shocked gas. This further constrains grain sizes to and excludes a pure-carbon composition. The dust in both this shocked region and the CS hourglass was formed from material expelled very late in the progenitor’s life, thus we expect the dust properties to be similar. Indeed, our pre-SN CS dust model also favors silicate-dominated dust with grain sizes .
That dust which formed at later times has a smaller carbonaceous content can result from a change in surface CNO abundances over the star’s late-stages of evolution, since carbon-rich envelopes create carbon-rich dust, while oxygen-rich envelopes create silicate-rich dust. Such CNO processing is also inferred from early IUE spectra (Fransson et al., 1989) of the ER, which show nitrogen and oxygen to be overabundant with respect to carbon.
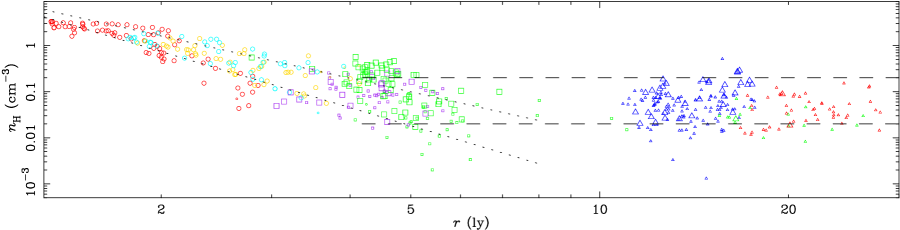
The average dust density is plotted in Figure 14. Figure 13 has been greyscale shaded to reflect the differences in density among the many echoing structures, with darker grey indicating higher-density material.
The innermost CS hourglass material has a relatively-constant gas density of cm-3 up to ly. Beyond this position, the material splits into two distributions, where the steeper profile () traces the denser waist of the hourglass. Beyond ly, the shallower () profile traces the belt and equatorial plane material, making a smooth transition to the inner NH points around ly. That the CS density varies more steeply than the inverse-square expected for a freely-expanding wind suggests the mass-loss mechanical luminosity () increased with time toward the end of the RSG.
Excluding a density enhancement between ly, there is no evidence of a structural distinction between the CS and NH gas, which justifies the simplified model in Figure 13. Returning to the aforementioned enhancement, this higher-density material is located along the waist of the NH hourglass, marking an outer edge to the equatorial overdensity. The constituents of the Peanut, the CD and outer NH, have constant density with radius, bounded by cm-3, suggesting this structure marks a constant-density boundary.
Burrows et al. (1995) argued that if a CS hourglass exists, the fact that it is not observed in recombination (like the three rings) implies its density must be cm-3. This density is consistent with our findings, and explains why the hourglass exists but is optically invisible.
In §LABEL:I-sec-density-density-unbiased of Paper II, we present an unbiased measurement of density by searching for echoes at all positions within each difference image. These reveal the region between the CS and CD structures to be filled with diffuse material (), while little structure is seen outside the CD. According to Figure 13, the CD and NH form a peanut with a narrowly-pinched waist. If the equatorial dust density is high enough to cause significant extinction, material beyond NH will be effectively shadowed from the SN light pulse, in which case no echoes would be seen. In §LABEL:I-sec-density-density-shadowing of Paper II, we show that only a fraction of a magnitude of extinction can be expected from known equatorial material. As this is insufficient to cause pronounced shadowing, the narrow waist appears to be a genuine boundary.
| Struc- | Inclinationaa“Roll” is the counter-clockwise rotation about the axis, also the P.A. of the minor axis after removing the southern inclination and eastern rotation. | Cross Sectionbb and are the western and northern offsets of the symmetry axis from the SN, which is at , . | Geometrycc is the spherical-polar distance from the SN. is the cylindrical-polar radius measured from the inclined axis . is the approximate width along . is the inferred total volume of the structure. | ||||||||||
|---|---|---|---|---|---|---|---|---|---|---|---|---|---|
| ture | South | East | Roll | Shape | |||||||||
| (°) | (°) | (°) | (ly) | (ly) | (ly) | (ly) | (ly) | (ly) | (ly3) | ||||
| CS | 41° | -8° | -9° | 0.94 | 0. | Hourglass | 20 | ||||||
| Belt | 40 | ||||||||||||
| Walls | 120 | ||||||||||||
| NH | 40° | -7° | 12° | 0.82 | 0. | 0. | Hourglass | ||||||
| CD | 40° | -8° | Prolate | ||||||||||
The total mass of gas and dust within the CSE is estimated from the average density and volume of each structure, as given in Figure 14 and Table 2. The volume interior to the CD is estimated a few ways: as the volume of the ellipsoid enclosed by the CD, as the volume of two cones enclosed by the quasi-linear profile, and as the integrated volume under the same profile (Fig. 6). All three methods give a consistent result of about 6500 ly3. The calculated masses are listed in Table 3, yielding a total mass in all structures of (assuming an LMC gas-to-dust mass ratio of 400–600). It is very difficult to quantify all the sources of error, but we believe the tendency will be to underpredict the masses of the structures, given conservative measurements of their volume and the unknown extent to which dust was not observable, due to unfavorable geometry, poor data quality, confusion, or possible shadowing.
6. Previous Formation Models
As discussed briefly in §1, the progenitor’s pre-explosion spectral type, as well as the early SN evolution, argue Sk ° 202 exploded as a BSG. Evidence of pre-existing CS material, and nitrogen enrichment within that material, imply the star first passed through a RSG phase, executing a “blue loop” to return to a BSG prior to core collapse.
Mass loss can explain this blue loop, however only if the star loses either a small fraction or nearly all of its hydrogen envelope (Woosley, Pinto & Ensman, 1988; Woosley, Pinto & Weaver, 1988; Nomoto et al., 1988). While the latter option is ruled out by observations (Dopita, 1988; Walborn et al., 1989), even low mass loss can qualitatively account for the observed CSE via interacting stellar winds (or ISW, Kwok, 1982; Balick, Preston & Icke, 1987). Originally proposed to explain planetary nebulae, a slow, dense wind from the evolved star (or RSG) is overtaken by a fast, tenuous one, accelerated from the hot, blue core (or BSG). In particular, inhomogeneities in the winds, such as equatorial overdensities, shock focus the winds into characteristic bipolar shapes.
Unfortunately, the formation mechanisms of such overdensities are poorly understood. Morris (1981, 1987) proposed that a binary companion can create an overdensity in the primary wind within the pair’s orbital plane, while Soker & Livio (1994) argue that this configuration can drive high-velocity jets out of that plane. Two models exist for the creation of a disk by single stars. A rotation-induced bi-stability (Lamers & Pauldrach, 1991) produces a larger mass-loss or lower wind-velocity at the equator than the poles, resulting from the high sensitivity of line-driven winds to optical depth. Bjorkman & Cassinelli (1993) have introduced the model of a wind-compressed disk (WCD), in which the orbital streamlines of gas launched from the northern and southern hemispheres of a star collide, producing an equatorial overdensity.
Many of these mechanisms have been invoked to explain the formation of the three-ring nebula, which has been the most prominent feature of the CSE. In the following subsections, we review these models, and compare their predictions to the complete nebula revealed by light echoes. In short, we find that no extant model can adequately reproduce this system, however a number of features among them may offer some insight into the progentor’s probable mass-loss history.
6.1. Interacting Stellar Winds Models
Luo & McCray (1991b) first invoked the ISW model to explain the emerging picture of an hourglass-shaped nebula containing the three rings. Using the thin-shell approximation (Mac Low & McCray, 1988) in which all swept-up material lies in a thin shell with an isobaric interior (effectively a momentum-conserving snowplow), they simulated the collision of a fast, tenuous BSG wind with an older, slow and dense RSG outflow. Since, this collision has been studied with 2-D hydrodynamic simulations by Blondin & Lundqvist (1993) and Martin & Arnett (1995).
A number of results are similar between all of these models. (1) A bipolar or hourglass nebula can be formed via this ISW framework that roughly matches the size and expansion velocities of the rings. (2) To match these constraints, an extraordinary asymmetry is required in the RSG mass loss, producing a significant equatorial density enhancement over that at the poles. We note that this conclusion is a result of the simulations, not an input condition. (3) The wind parameters necessary to produce this nebula are consistent with average values of other stars, with the RSG characterized by a mass loss yr-1, wind velocity , and lifetime yr, and the BSG by yr-1, , and yr.
As predicted above, we do find an extended equatorial overdensity in Figure 13. However, compared to this newly-revealed CSE, the models all have significant shortcomings. Foremost, nearly all the predicted CS nebulae are quite flattened and oblate (mushroom shaped), inconsistent with the prolate, hourglass shape we have mapped out. To generate roughly the right shape, the equatorial expansion velocities become far too large, while matching these velocities can lead to RSG mass-loss rates that are too high. Although these models can explain the formation of the ER, they fail to explain the existence of the ORs. This may be linked to the fact that almost all model hourglass nebulae have solid capping surfaces, which we do not observe. Finally, the adoption of a pre-existing RSG asymmetry is entirely ad hoc, and these models make no attempt to explain how such an asymmetry formed, nor to model what geometry its interface with the MS bubble should be.
6.2. A Wind-Compressed Disk Model
Collins et al. (1999) have attempted to address one shortcoming in previous work by assuming that the RSG wind forms a WCD from which the density asymmetry is derived. In contrast to the above work, they also allow for a velocity asymmetry in the RSG wind, as defined by the disk. A WCD is characterized by the rotation parameter , the ratio of the stellar rotation rate to the break-up speed. For rotations less than a threshold value , the star forms a wind-compressed zone with an equator-to-pole density contrast of 3–10, while for a WCD forms with density contrasts . By varying the WCD parameters, Collins et al. (1999) varied the RSG-wind environment surrounding the star, establishing the initial conditions for a BSG wind. This they addressed using self-similar solutions of wind-blown bubbles from Dwarkadas et al. (1996).
For their fiducial model (a RSG with 20, which is too high from stellar-evolution arguments), they find , which produces a density contrast of 25. A variation of the rotation parameter between produces peanut-shaped nebulae with equatorial expansion velocities of 8–10 and a maximum (cylindrical) lobe radius roughly twice that in the equator (consistent with the diameters of the ORs and ER), for RSG wind parameters yr-1 and , and BSG parameters yr-1 and . A WCD is not required to produce a peanut, as a dense equatorial zone is sufficient. Again, the peanut shape does not fit the observed CS hourglass, however they address this by noting that in simulations (Frank & Mellema, 1994), the BSG wind can be shock-focused into the polar direction, resulting in a substantially-more prolate structure than that predicted from a self-similar solution.
A few results stand out from this work. (1) The WCD is a straightforward explanation for the observed equatorial density enhancement. (2) The authors do not find the need to invoke unusually low BSG wind momentum or RSG velocity, although the RSG mass-loss rate is much higher than we deduce in §7.2. (3) A single RSG star cannot rotate at without the influence of a binary companion. Collins et al. (1999) estimate that a lower limit of 0.6 for the companion is sufficient to produce the necessary rotation speeds for this model. If rotation is to be invoked as a formation mechanism, then the progenitor had to have been a binary system.
6.3. Binary Models
Binarity has been invoked by Posdiadlowski & Joss (1989) and Posdiadlowski et al. (1990) among others to explain the observed characteristics of the SN. A companion could have been engulfed by Sk °202 during a common-envelope phase; however, for lower mass primaries, the secondary can cause dynamical instabilities that eject the primary envelope (Rasio & Livio, 1996), a process that is not suggested from the SN evolution.
Soker (1999) invokes the influence of a binary companion to produce the observed three-ring nebula, but his results are inconsistent with the ensemble of data presented here. Podsiadlowski, Fabian, & Stevens (1991) suggest that the collision of winds between the primary and secondary spread out the wind into a truncated double cone. This is a novel formation mechanism for the hourglass feature we observe; however, their geometric model further predicts that Napoleon’s Hat lies on the northern-half of the cone, which we now know to be false.
Lloyd, O’Brien, & Kahn (1995) suggest a variant on the double-cone scenario, in which the BSG wind sweeps up the base of the cones, leaving the end surfaces as the ORs. Furthermore, dynamical friction causes the secondary to coalesce into the primary, ejecting the envelope, thereby forming the ER. Again, this model is attractive as it suggests that a single mechanism formed all three rings. A testable prediction is that extensive RSG double-cone material should exist at and beyond the ring positions, however we see no evidence for such material in light echoes. If binarity is to explain the formation of the three rings, these models must be revisited to be consistent with the new picture of the complete CSE.
6.4. Ionization
All the above models have neglected the effects of ionization on the evolution of ISWs. The progenitor MS star is expected to emit an ionizing flux of s-1, while the B3 I BSG star should emit s-1 (Panagia, 1973), both of which are sufficient to drive an ionization front ahead of the outer shock.
Chevalier & Dwarkadas (1995) have addressed the role of ionization in the to explain the reappearance of radio emission three years after outburst (Manchester et al., 2002). Their model of a pre-SN H II region suggests that the BSG had a mass loss of only yr-1 with . Furthermore, the ionization front that formed this H II region would move rapidly through the lower-density polar regions of the hourglass, and could have broken out of the lobes, thereby eliminating any capping-surface to the CS hourglass. This is a particularly interesting scenario for explaining the observed geometry of the CS hourglass, as well as the evolution of the SN remnant across the spectrum.
Meyer (1997) has proposed that an ionization front in the BSG phase induces hydrodynamic motions in the pre-existing asymmetric RSG wind. These motions create a latitudinally-dependent density profile that peaks about 50°above the equator, which he identifies as the outer rings, however Soker (1999) and Crotts & Heathcote (2000) have offered a few objections to this scenario. Fully-radiative hydrodynamic simulations including ionization are necessary to test these ideas.
7. Constraints on the Evolution of Sk °202
We now investigate what constraints the geometry and density of the CSE can place on the progenitor’s evolution.
7.1. The Main Sequence Bubble
We begin by discussing the possible mass-loss scenarios for the MS progenitor, since the impact of these winds on the surrounding ISM forms the initial conditions for subsequent mass-loss evolution. Chevalier & Emmering (1989) note that the wind should have blown a bubble pc in radius, whose interior homogenized as the star evolved onto the RSG branch.
Let us assume that Sk °202 was a zero-age MS type O9 V with 18–20 (Chevalier & Emmering, 1989), luminosity and radius (Panagia, 1973), yielding a MS mass-loss rate of yr-1 (Nieuwenhuijzen & de Jager, 1990). The interaction of a long-lived stellar wind with the ISM was first investigated by Castor et al. (1975) and Weaver et al. (1977), with refinements proposed by, among others, McKee et al. (1984), Koo & McKee (1992a,b), and D’Ercole (1992). The wind is characterized by its mechanical luminosity , where the terminal velocity has an upper limit around for the assumed progenitor properties (Kudritzki et al., 1989; Lamers & Cassinelli, 1999). These yield , where ergs s-1. Woosley, Pinto & Weaver (1988) suggest the mass loss rate may be higher, or .
For the wind duration, we use a MS lifetime of Myr (Martin & Arnett, 1995). Scuderi et al. (1996) find H II cm2 along the line of sight to Star 2, with roughly 30% of the extinction occuring within the LMC. Xu et al. (1995) find that SN 1987A is positioned roughly 1 kpc behind the edge of the LMC, and if one assumes Star 2 is near the SN, these yield an average ISM density of =0.4 cm-3.
For , the progenitor wind will maintain an adiabatic shock for 0.3–1.3 Myr. As this is much shorter than , the bubble will become radiative at a radius of 27–81 ly. Assuming the sound speed of the undisturbed ISM is 10 , the radiative shock front will reach this speed and stall in another 0.8 Myr. Following the arguments in D’Ercole (1992), adiabatic shocks become radiative at radii larger than those at which radiative shocks would have stalled. As such, the shock must recede, stalling at a new radius of 26-42 ly.
There are subtle indications in our density measurements of an enhancement 80–100 ly from the SN, which may be the remnant of the MS-ISM snowplow. However, given the small expected mechanical luminosity of the progenitor, we question whether the Peanut is actually the remnant of that interaction. Alternatively, the MS bubble may be traced by echoes seen roughly 100 pc from the SN by Xu et al. (1995).
7.2. Red Supergiant Mass Loss
| Structure | |
|---|---|
| CS Hourglass | 0.04 |
| CS Belt | 0.04 |
| CS Walls | 0.06 |
| NH Waist | 0.06 |
| NH Walls | 0.07 |
| Intra-CD | 0.2 |
| CD | 1.2 |
| Total | 1.7 |
Following the end of the MS, the gas density within its equilibrated bubble is expected to be quite low, and for a large RSG mass-loss rate, the swept-up mass within the driven shock will be much lower than the mass of shocked wind. The RSG mass-loss rate can be estimated from the mass contained within this structure (1.6 , Table 3) and an adopted RSG lifetime of yr (Martin & Arnett, 1995), yielding yr-1, consistent with ISW models. A wind velocity of 10 corresponds to a mechanical luminosity of which, expanding into a tenuous medium, is classified by Koo & McKee (1992a) as a “slow wind” that becomes radiative almost immediately. Note that this rate is an upper limit if the MS bubble is small, as suggested above.
7.3. Inhomogeneities
If the Peanut is the RSG-MS contact discontinuity, then its shape is a fossil record of the hydrodynamic interaction between these two media. Here, we investigate whether the observed Peanut can be explained by a simple asymmetry in the RSG wind, or whether external factors need to be invoked. Consider the CD shell (Fig. 11a, which has an elongated, prolate shape, closest to the SN just above the equatorial plane ( ly), and farthest toward the poles ( ly). A slow, radiative shock propagates as , thus for the RSG wind to have formed this pinched structure in the absence of any external inhomogeneities, the wind luminosity above the equator must have been roughly 3% that at the pole.
D’Ercole (1992) find that radiative shocks stall at . For the RSG wind from Sk °202 to have stalled at the poles with , the ambient MS-bubble density must be cm-3. Similar average values can be determined by considering the MS mass-loss rate and bubble size. With 3% of the polar wind luminosity, the equatorial wind would have stalled at 5 ly, which is less than half the observed position of the CD shell. It appears that the observed geometry of the Peanut cannot be explained by only an asymmetry in the RSG wind.
One solution is that the CSM in the MS-bubble is not homogenous, but that the MS winds had an asymmetry similar to that of the RSG. Typically, one argues that the average temperature inside the MS bubble should have been sufficiently high for any inhomogeneities to smooth out, making this scenario unlikely. An asymmetric freely-expanding flow into a homogenous post-shock medium will create an asymmtric inner termination shock. The simulations of Garcia-Segura, Langer, & Mac Low (1996) show that this shock collapses into RSG wind before the system settles anew into a steady flow. Thus it may be possible for a MS-wind asymmetry to be imprinted on subsequent outflows. An alternative is that the CD had a smaller size and asymmetry at the end of the RSG, and a second wind blew it into the shape currently observed, which we consider in greater detail in the next subsection.
7.4. A Two-Loop Scenario
Martin & Arnett (1995) have modelled the evolution of metal poor stars between 19–21 using the stellar evolution code from Arnett (1991). All of these make one full blue loop and then return to the red, with only the models under 20.5 finishing a second loop to end as a BSG. Such stars spend roughly yr in the MS, and yr in the first RSG and BSG, and and yr in the second RSG and BSG, respectively. We propose that the structures revealed by light echoes may be explained by such an evolutionary scenario. In particular, a long-duration BSG wind expanding into an asymmetric RSG environment could be the second wind hypothesized above.
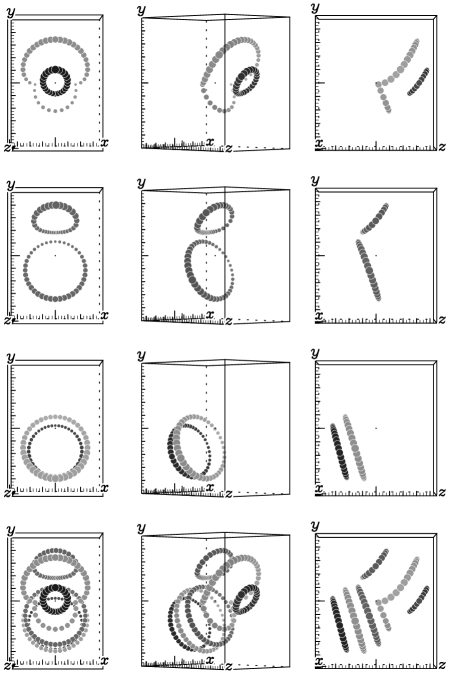
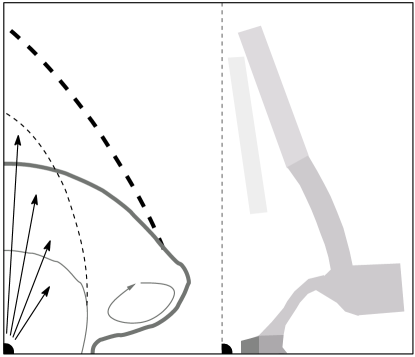
Qualitatively, the hourglass-shaped bubbles resulting from ISW simulations are poor matches to the CS hourglass, yet they have many similarities to the Peanut (Fig. 15). The flattened, oblate (or mushroom-shaped) lobes with narrowly-pinched waists from simulations are very similar to the inner walls and conical-shell contributions to the Peanut. This is shown schematically in Figure 15, in which the inward-facing shock (thin grey curve), dense contact discontinuity (thick grey curve) and vortex (grey arrowed curve) from Figure 2 of Martin & Arnett (1995) are shown at left, and compared on the right to one quadrant of the CD structure from Figure 13. Of note in Martin & Arnett (1995), a dense vortex appears at the outer edge of the prolate lobe, which is tempting to identify with the “spurs” located just outside the CD.
We envision the following evolutionary sequence. A BSG accelerates wind into previously-expelled RSG material, creating a mushroom-shaped discontinuity. This BSG wind is steady and long-lived, and the interface expands self-similarly (Dwarkadas et al., 1996) to the size of the CD/NH Peanut. Many mechanisms exist to direct momentum and pressure toward the polar region (indicated by black arrows in Fig. 15), elongating the mushroom into the prolate peanut shape we observe. These include: (1) shock focusing of the BSG wind by equatorial material (see Collins et al., 1999), and preferential expansion into the lower density polar regions of (2) an adiabatic shock or (3) an ionization front (Chevalier & Dwarkadas, 1995). The star then loops back to the red, and for a few years fills in some fraction of the cavity blown out by the first BSG wind. These three mass-loss phases produce an extensive equatorial overdensity, which directs a substantial amount of the final BSG wind in the polar direction, carving out an hourglass-shaped nebula with no end caps.
One major discrepancy between the ISW models and the CSE as revealed through echoes is that the models assume there is a very extensive equatorial disk of RSG material. Whether the equatorial material we do see is sufficient to form the rest of the bipolar structures must be tested in hydrodynamic simulations.
In addition to providing a natural mechanism for formation of the equatorial overdensity via a WCD, stellar rotation may also explain the progenitor’s evolutionary blue loop(s) (Meynet, 2004), and should be revisited with hydrodynamic models. From Figure 14, we find a maximum equator-to-pole density contrast of 10 between the NH equator and the furthest CD material. This is small compared to values found by Collins et al. (1999), suggesting the evolved star may only have produced a wind-compressed zone and therefore did not have an extremely high rotation rate. However, since a rotating star spins down as it loses mass on the MS and as it swells into a RSG, any significant RSG rotation requires some mechanism for spinning up the star, such as a close binary companion.
8. Conclusion
Once it was realized that Sk -69°202 was surrounded by an extensive CS nebula, it became clear that the closest observed SN in 400 years would also provide the first opportinity to observe the destruction of that nebula (e.g. Luo & McCray, 1991a; Borkowski, Blondin & McCray, 1997b), and the birth of a supernova remnant (SNR), both spatially resolved and in real-time. This event thus serves as a vital test to models of SN evolution, radiative shock processes, and SNR formation.
As noted in the introduction, the ejecta-CSE interaction will directly illuminate the structures it impacts, and the high-energy emission from the resulting hot gas will illuminate many other regions of the CSE via photoionization. The results from this work will be tested by this interaction, and be critical in interpreting the panchromatic spectacle that will ensue.
Already, the “hot spots” detailing the impact of the ejecta with the inner edge of the ER (Lawrence et al., 2000) confirm the observed spatial offset between the SN and inner nebulae. Sugerman et al. (2002) show that roughly of the hot spots are located along the eastern half of the ER, while spots toward that half of the ring are also closer to the SN than those to the west. Both of these are suggestive of an ER that is offset to the west of the SN, consistent with our findings in §4.3.
An alternative interpretation to the hot spot positions and order of appearance is that the circumstellar medium into which the ejecta propagate is asymmetrically denser to the east (Michael et al., 2002). Is such an imprint visible in light-echo data?
Stellar winds propagating into uniform media travel faster and farther with increasing mechanical luminosity (Weaver et al., 1977). A higher wind density to the east would imply that the CD boundary separating the RSG wind from the MS bubble should be more distant from the SN in that direction. In §4.1, we find that the CD does appear marginally offset from the SN toward the east. Although by no means conclusive, this is suggestive that an eastern asymmetry was present in the stellar winds as early as the RSG.
If the RSG outflows had been denser toward the east, then the inner cavity which the BSG wind carved out would be closer to the central star in that direction as well. This would have resulted in an observed ER and CS hourglass that are offset west of the SN, and an overall density enhancement within the equatorial plane to the east. This qualitative argument is again consistent with the observed geometry of the inner CS structures (§4.3). Unfortunately, the inferred densities from §5 are too uncertain to permit a meaningful study of azimuthal asymmetries.
In keeping with the binary-star hypotheses to explain the observed CSE, one could also invoke binarity as the cause for the east-west wind asymmetry. For example, a secondary in a resonant, eccentric orbit could tidally distort the primary when near pericenter, and from the von Zeipel theorem (1924), the radiative flux would temporarily drop at this distortion, with an associated local drop in wind momentum (for a radiatively-driven wind), yielding a longitudinal wind asymmetry.
Another mechanism that could cause a longintudinally asymmetric wind is proper motion of the mass-losing star through the ISM. This was first treated by Weaver et al. (1977) and more recently by e.g. Wilkin (1996) and Comeron & Kaper (1998). A slow, westward motion of the progenitor through the ISM would pile up more material at the western wind-ISM contact discontinuity than to the east. Similarly, the star would be closer to this western discontinuity than to the west. Such an effect has been seen for PNe (Tweedy & Kwitter, 1996) and for the LMC luminous blue variable S119 (Danforth & Chu, 2001). A proper motion of less than 0.1 is required to produce the observed offets, however, this scenario is predicated on the progenitor not blowing an ISM bubble during its MS that is larger than any of the CS structures revealed in this paper. We look forward to a new generation of hydrodynamical models that will readdress the mechanisms of mass loss in Sk 202, and subsequently the phenomena of bipolar mass loss in many more systems.
References
- Arnett (1987) Arnett, W. D. 1987, ApJ, 319, 136
- Arnett (1988) Arnett, W. D. 1988, ApJ, 331, 377
- Arnett (1991) Arnett, W. D. 1991, ApJ, 383, 295
- Arnett et al. (1989) Arnett, W.D., Bahcall, J.N., Kirshner, R.P., Woosley, S.E. 1989, ARA&A, 27, 629
- Balick, Preston & Icke (1987) Balick, B., Preston, H.L., Icke, V. 1987, AJ, 94, 164
- Bjorkman & Cassinelli (1993) Bjorkman, J. E., Cassinelli, J. P. 1993, ApJ, 409, 429
- Borkowski, Blondin & McCray (1997b) Borkowski, K.J., Blondin, J.M. & McCray, R. 1997b, ApJ, 477, 281
- Blondin & Lundqvist (1993) Blondin, J. M., Lundqvist, P. 1993, ApJ, 405, 337
- Bond et al. (1989) Bond, H. E., Gilmozzi, R., Meakes, M. G., Panagia, N. 1989 IAU Circ., 4733
- Burrows et al. (1995) Burrows, C.J., et al. 1995, ApJ, 452, 680
- Castor et al. (1975) Castor, J., McCray, R., & Weaver, R. 1975, ApJ, 200, L107
- Chevalier & Dwarkadas (1995) Chevalier, R.A., & Dwarkadas, V. V. 1995, ApJ, 452, L45
- Chevalier & Emmering (1989) Chevalier, R. A. & Emmering, R. T. 1989, ApJ, 342, L75
- Collins et al. (1999) Collins, T. J. B., Frank, A.,Bjorkman, J. E., Livio, M. 1999, ApJ, 512, 322
- Comeron & Kaper (1998) Comeron, F. & Kaper, L. 1998, A&A, 338, 273
- Couch & Malin (1989) Couch, W. J., Malin, D. F. 1989, IAU Circ.4739
- Couderc (1939) Couderc, P. 1939, Ann d’Ap, 2, 271
- Crotts & Heathcote (1991) Crotts, A. P. S. & Heathcote, S. R. 1991, Nature, 350, 683
- Crotts & Heathcote (2000) Crotts, A. P. S. & Heathcote, S. R. 2000, ApJ, 528, 426
- Crotts & Kunkel (1989) Crotts, A. P. S., Kunkel, W. E. 1989, IAU Circ.4741
- Crotts & Kunkel (1991) Crotts, A. P. S. & Kunkel, W. E. 1991, ApJ, 366, L73
- Crotts et al. (1995) Crotts, A. P. S., Kunkel, W. E. & Heathcote, S. R. 1995, ApJ, 438, 724 (CKH95)
- Crotts et al. (1989) Crotts, A. P. S., Kunkel, W. E., & McCarthy, P. J. 1989, ApJ, 347, L61
- Danforth & Chu (2001) Danforth, C. W. & Chu, Y. 2001, ApJ, 552, L155
- D’Ercole (1992) D’Ercole, A. 1992, MNRAS, 255, 572
- Dopita (1988) Dopita, M. A. 1988, Nature, 331, 506
- Dwarkadas et al. (1996) Dwarkadas, V. V., Chevalier, R. A., & Blondin, J. M. 1996, ApJ,457, 773
- Feast (1999) Feast, M. 1999, PASP, 111, 775
- Fischera et al. (2002) Fischera, J., Tuffs, R. J., & Völk, H. J. 2002, A&A, 395, 189
- Frank & Mellema (1994) Frank, A. & Mellema, G. 1994,ApJ, 430, 800
- Fransson et al. (1989) Fransson, C., et al. 1989, ApJ, 336, 429
- Garcia-Segura, Langer, & Mac Low (1996) Garcia-Segura, G., Langer, N., & Mac Low, M.-M. 1996, A&A, 316, 133
- Gould & Uza (1998) Gould, A., & Uza, O. 1998, ApJ, 494, 118
- Hofmeister et al. (1964) Hofmeister, E., Kippenhahn,R., & Weigert, A. 1964, Zeitschrift fur Astrophysics, 60, 57
- Humphreys & Davidson (1978) Humphreys, R. M., & Davidson, K. 1978, ApJ, 232, 409
- Humphreys & McElroy (1984) Humphreys, R. M., & McElroy, D. B. 1984, ApJ, 284, 565
- Jakobsen et al. (1991) Jakobsen, P., et al. 1991, ApJ, 369, L63
- Koo & McKee (1992a) Koo, B. & McKee, C. F. 1992a,ApJ, 388, 103
- Koo & McKee (1992b) Koo, B. & McKee, C. F. 1992b, ApJ, 388, 93
- Kudritzki et al. (1989) Kudritzki, R. P., Pauldrach,A., Puls, J., Abbott, D. C. 1989, A&A, 219, 205
- Kwok (1982) Kwok, S.O 1982, ApJ, 258, 280
- Lamers & Cassinelli (1999) Lamers, H. J. G. L. M. & Cassinelli, J. P. 1999, Introduction to Stellar Winds (New York: Cambridge University Press)
- Lamers & Pauldrach (1991) Lamers,H. J. G. L. M. & Pauldrach, A. W. A. 1991, A&A, 244, L5
- Lawrence et al. (2000) Lawrence, S. S., Sugerman, B. E., Bouchet, P., Crotts, A. P. S., Uglesich, R. R., & Heathcote, S. R. 2000, ApJ, 537, 123
- Lloyd, O’Brien, & Kahn (1995) Lloyd, H. M., O’Brien, T. J., & Kahn, F. D. 1995, MNRAS, 273, L19
- Luo & McCray (1991a) Luo, D. & McCray, R. 1991a, ApJ, 372, 194
- Luo & McCray (1991b) Luo, D. & McCray, R. 1991b, 379, 659
- Mac Low & McCray (1988) Mac Low, M. M., & McCray, R. 1988, ApJ, 325, 776
- Manchester et al. (2002) Manchester, R. N., Gaensler, B. M., Wheaton, V. C., Staveley-Smith, L., Tzioumis, A. K., Bizunok, N. S., Kesteven, M. J., & Reynolds, J. E. 2002, Pub. ASAu, 19, 207
- Martin & Arnett (1995) Martin, C. L., Arnett D. 1995, ApJ, 447, 378 (MA95)
- McKee et al. (1984) McKee, C. F., van Buren, D., & Lazareff, B. 1984, ApJ, 278, L115
- Meyer (1997) Meyer, F. 1992, MNRAS, 285, L11
- Meynet (2004) Meynet, G. 2004, in EAS Pub. Ser. 13, Evolution of Massive Stars, Mass Loss and Winds, ed. M. Heydari-Malayeri et al. (France: EDP), 21
- Michael et al. (2002) Michael, E., et al. 2002, ApJ, 574, 166
- Morris (1981) Morris, M. 1981, ApJ, 249, 572
- Morris (1987) Morris, M. 1987, PASP, 99, 1115
- Nieuwenhuijzen & de Jager (1990) Nieuwenhuijzen, H., & de Jager, C. 1990, A&A, 231, 134
- Nomoto et al. (1988) Nomoto, K., Shigeyama, T.,Kumaga, S., & Hashimoto, M. 1988, Proc. ASAu, 7, 490
- Panagia et al. (1987) Panagia, N., Gilmozzi, R., Cassatella, A., Wamsteker, W., Kirshner, R. P., Sonneborn, G., & Beresford, A. C. 1987, IAU Circ., 4514, 2
- Panagia (1973) Panagia, N. 1973, AJ, 78, 929
- Plait et al. (1995) Plait, P., Lundqvist, P., Chevalier, & R., Kirshner, R. 1995, ApJ, 439, 730
- Podsiadlowski (1992) Podsiadlowski, P. 1992, PASP, 104, 717
- Podsiadlowski, Fabian, & Stevens (1991) Podsiadlowski, P., Fabian, A. C., & Stevens, I. R. 1991, Nature, 354, 43
- Posdiadlowski & Joss (1989) Podsiadlowski, Ph. & Joss,P. C. 1989, Nature, 338, 401
- Posdiadlowski et al. (1990) Podsiadlowski, Ph., Joss, P. C., & Rappaport, S. 1990, A&A, 227, L9
- Rasio & Livio (1996) Rasio, F. A. & Livio, M. 1996,ApJ, 471, 366
- Romaniello et al. (2000) Romaniello, M., Salaris, M., Cassisi, S., & Panagia, N. 2000, ApJ, 530, 738
- Rousseau et al. (1978) Rousseau, J., et al. 1978, A&AS, 31, 243
- Sanduleak (1969) Sanduleak, N. 1969, Contr. CTIO, 89, 1
- Scuderi et al. (1996) Scuderi, S., Panagia, N., Gilmozzi, R., Challis, P. M., & Kirshner, R. P. 1996, ApJ, 465, 956
- Shigeyama et al. (1987) Shigeyama, T., Nomoto, K.,Hashimoto, M., & Sugimoto, D. 1987, Nature, 328, 320
- Soker & Livio (1994) Soker, N. & Livio, M. 1994, ApJ, 421, 219
- Soker (1999) Soker, N. 1999, MNRAS, 303, 611
- Sugerman et al. (2002) Sugerman, B. E. K., Lawrence, S. S., Crotts, A. P. S., Bouchet, P., Heathcote, S. R., 2002, ApJ, 572, 209
- Sugerman et al. (2005) Sugerman, B. E. K., Crotts, A. P. S., Kunkel, W. E., Heathcote, S. R., & Lawrence, S. S., 2005a, ApJS, in press (Paper II)
- Sugerman (2003) Sugerman, B. E. K., 2003, AJ, 126, 1939
- Tomaney & Crotts (1996) Tomaney, A., & Crotts, A. P. S. 1996, AJ, 112, 2872
- Tweedy & Kwitter (1996) Tweedy, R. W. & Kwitter, K. B. 1996, ApJS, 107, 255
- von Zeipel (1924) von Zeipel, H. 1924, MNRAS, 84, 665
- Walborn et al. (1989) Walborn, N. R.,Prevot, M. L., Prevot, L., Wamsteker, W., Gonzalez, R., Gilmozzi, R.,& Fitzpatrick, E. L. 1989, A&A, 219, 229
- Walker & Suntzeff (1990) Walker, A. R. & Suntzeff,N. B. 1990, PASP, 102, 131
- Wampler et al. (1990a) Wampler, J., D’Odorico, S., Gouiffes, C., Tarenghi, M., & Wang, L.-F. 1990, IAU Circ., 4943, 1
- Wampler et al. (1990b) Wampler, E. J., Wang, L., Baade, D., Banse, K., D’Odorico, S., Gouiffes, C., & Tarenghi, M. 1990, ApJ, 362, L13
- Wang & Wampler (1992) Wang, L. & Wampler, E. J. 1992, A&A, 262, L9 1987A
- Wang, Dyson, & Kahn (1993) Wang, L., Dyson, J. E., & Kahn, F. D. 1993, MNRAS, 261, 391
- Weaver et al. (1977) Weaver, R., McCray, R., Castor,J., Shapiro, P., & Moore, R. 1977, ApJ, 218, 377
- Wilkin (1996) Wilkin, F. P. 1996, ApJ, 459, L31
- Woosley et al. (1987) Woosley, S. E., Pinto, P. A., Martin, P. G., Weaver, T. A. 1987, ApJ, 318, 664
- Woosley, Pinto & Ensman (1988) Woosley, S. E., Pinto, P. A., Ensman, T. A. 1988, ApJ, 324, 466
- Woosley, Pinto & Weaver (1988) Woosley, S. E., Pinto, P. A., Weaver, T. A. 1988, Pub. ASAu, 7, 355
- Xu & Crotts (1999) Xu, J. & Crotts, A.P.S. 1999, ApJ, 511, 262
- Xu et al. (1994) Xu, J., Crotts, A. P. S. & Kunkel, W. E. 1994, ApJ, 435, 274
- Xu et al. (1995) Xu, J., Crotts, A. P. S. & Kunkel, W. E. 1995, ApJ, 451, 806 (Erratum: 463, 391)