Photoionized lines in X-ray Spectra of SMC X-1
Abstract
We present a detailed spectral analysis of Chandra/ACIS-S CC mode observations of the massive X-ray binary system SMC X-1. The system was observed during both the high and low X-ray states of the roughly 60-day superorbital period. The continuum spectra during both states are well represented by a power law with photon index =0.9 and a blackbody of kT = 0.15keV. The high state spectra are dominated by the continuum and independent of orbital phase whereas the low state spectra show a strong orbital dependence as well as line emission from O, Ne, Mg, Fe, and Si. This is consistent with the states attributed to disk precession: during the high state X-ray emission is dominated by the compact source which is abrubtly eclipsed and during the low state the compact object is hidden by the disk and a larger, less luminous scattering region is responsible for the X-ray emission. A prominent Ne IX feature places a stringent limit (Log = 2.0-2.5) on the ionization parameter which constrains the wind dynamics of the system. The Fe line fluxes are related linearly to the blackbody fluxes indicating that both originate in the same region or are excited by the same mechanism. There is evidence for structure in the Fe-line that cannot be fully resolved by the current observations. The pulse period measured during our observations, 0.70571470.00000027s shows that the uninterrupted spin-up trend of SMC X-1 continues. We discuss the implications of our results for models of SMC X-1.
1 Introduction
The massive X-ray binary system SMC X-1/SK160 is one of only two sources known to show both pulses and bursts; Li and van den Heuvel (1997) suggest that this is due to the magnetic moment of SMC X-1, 1029G cm3, which is an order of magnitude lower than those of typical X-ray pulsars. SMC X-1 is the only X-ray pulsar for which no spin-down episodes have been observed (Kahabka and Li, 1999). If the magnetic moment of SMC X-1 is as low as Li and van den Heuvel suggest, then the spin-up trend can be explained by classical accretion torque models (Kahabka and Li, 1999). In addition to showing X-ray pulses with a 0.71s period, SMC X-1 is eclipsed by its B0 supergiant companion for 15 hours during every 3.89 day binary orbit. The uneclipsed X-ray flux exhibits aperiodic variabilities on timescales from milliseconds to months. These include quasi-periodic oscillation at 0.06 Hz (Wojdowski et al., 1998), X-ray bursts (Angelini et al., 1991), and a longterm “superorbital” period of 50-60 d, reported by Gruber and Rothschild (1984) and confirmed by RXTE (Levine et al., 1996) and several other X-ray observatories (Wojdowski et al., 1998). For SMC X-1 we assume that the long-term period is due to a warping and precession of the disk induced by the effects of uneven X-ray irradiation on the disk, as is the case for Her X-1 and LMC X-4 (Cheng, Vrtilek, and Raymond, 1995; Vrtilek et al., 1997) and as is consistent with requiring a classical accretion torque model for SMC X-1.
The ultraviolet spectra of SMC X-1 are similar to those of the massive X-ray binary system LMC X-4 and its 15 O star companion; both show ultraviolet P-Cygni lines that vary dramatically with orbital phase, with strong broad absorption near X-ray eclipse and narrow absorption when the X-ray source is in the line-of-sight (Vrtilek et al., 2001). The latter have been interpreted as a result of X-ray photoionization of the stellar wind; when the neutron star is in front of the normal star, the wind absorption disappears and mainly the photospheric absorption lines are visible (Vrtilek et al., 1997; Boroson et al., 1999). Detailed modelling of the P-Cygni line profiles of LMC X-4 provides measurements of the stellar wind parameters and indicates the presence of inhomogeneities in the wind (Boroson et al., 1999).
Here we report on our analysis of the pulse averaged X-ray data. In Section 2 we describe the observations, in Section 3 we present the results from our spectrum analysis, and in Section 4 we consider the implications of our results and future work.
2 Observations
Eight observations of SMC X-1 were made with the ACIS-S on Chandra
from 2000 October to 2001 April; these were coordinated
with 10 observations
made by HST/STIS. Preliminary results of the multiwavelength campaign
were presented in Vrtilek et al. (2001).
Here we present a detailed spectral analysis
of the X-ray observations as listed in Table 1.
The orbital phases listed in Table 1 were calculated using
the orbital period and ephemeris given by Wojdowski et al. (1998) with
T0 updated for N=2310 (where N is the number of orbits since the
ephemeris of Wojdowski et al.)
relative to their ephemeris:
T0(JD) = 2451827.50374 + 3.8922909N - 6.953E-8N2
Since SMC X-1 is a bright source the CCD detectors were subject to “pileup”: this occurs when two or more photons are incident on the same pixel during the CCD time-resolution element or “frame-time.” In order to mitigate this effect we used ACIS-S3 in the continuous clocking (CC) mode. In CC mode the frame-time is .00855s. This proved sufficient during the X-ray low states and during eclipse but significant pileup fractions occurred during the X-ray high state. The high-state out-of-eclipse countrates (40-54 cts/sec) translate to 0.4-0.5 cts/frame corresponding to pileup fractions of 16-18%. During eclipse and the low-state we had less than .03 cts/frame and pileup is less than 1%. The source counts were extracted from a rectangular area 4 by 1 pixels from the CC image and an equivalent area spaced 100 pixels away was used for the background. The background was negligible during the high state and less than 3% of the source counts during the low-state.
The data were processed using the CIAO version 3.0.3. data analysis package. The current analysis includes a correction for spacecraft dither that was not available when the preliminary results were published; in addition, observations affected by ACIS pileup were corrected. We deviated from the standard ACIS processing since the pipeline program “acis_detect_afterglow” misidentifies up to 20% of actual events as cosmic ray afterglow events. The source photons are rejected in systematic, non-uniform ways. In order to correct for pileup we start with data files before they undergo standard processing (level 1 files). We then use MKARF to construct an ARF appropriate for our observation. MKARF takes observation-specific dither and bad pixels into account, and determines fractional exposure time lost to dithering over bad pixels.
3 Spectral Analysis
Analysis of products produced with CIAO tools was performed with the Interactive Spectral Interpretation System (ISIS); (Houck and Denicola, 2000) and the pileup kernel developed by (Davis, 2001a, b) and incorporated into ISIS by Houck (2002) was utilized.
The pulse-averaged (0.1-200keV) X-ray spectrum of SMC X-1 during the high-state of the superorbital cycle has been described as a power-law () with a high-energy cutoff (5.6keV with a 15 keV folding energy), a thermal component (blackbody with kT = 0.15keV) at low energies, and Fe K-shell emission (Woo et al., 1995). During X-ray eclipse Wojdowski, Clark, and Kallman (2000) fit ASCA data to a power law with photon index (=0.94) and a high-energy cutoff at 10 keV with a 15 keV folding energy. Naik and Paul (2004) fit BeppoSax observations of SMC X-1 with a power-law of photon index (=0.8-0.9), blackbody with kT=0.16-0.19, and a high energy cutoff at 6.3 keV with a 11 keV folding energy. In all cases we include the equivalent neutral column density (NH) using Wisconsin (Morrison and McCammon, 1983) cross-sections: N(E) = exp where is the photo-electric cross-section (excluding Thomson scattering) with Anders and Ebihara (1982) relative abundances.
These models are similar to those used to fit the closely related systems LMC X-4 and Her X-1 (Hickox, Narayan, and Kallman, 2004; Zane et al., 2004) with the exception that neither LMC X-4 nor Her X-1 require high energy cutoffs withing the Chandra energy range. Since the cutoff energy and e-folding energy invoked for SMC X-1 differ for different instruments as our first attempt in fitting the continuum for SMC X-1 we use a simple power law plus a blackbody.
3.1 Fits to High-state Spectra
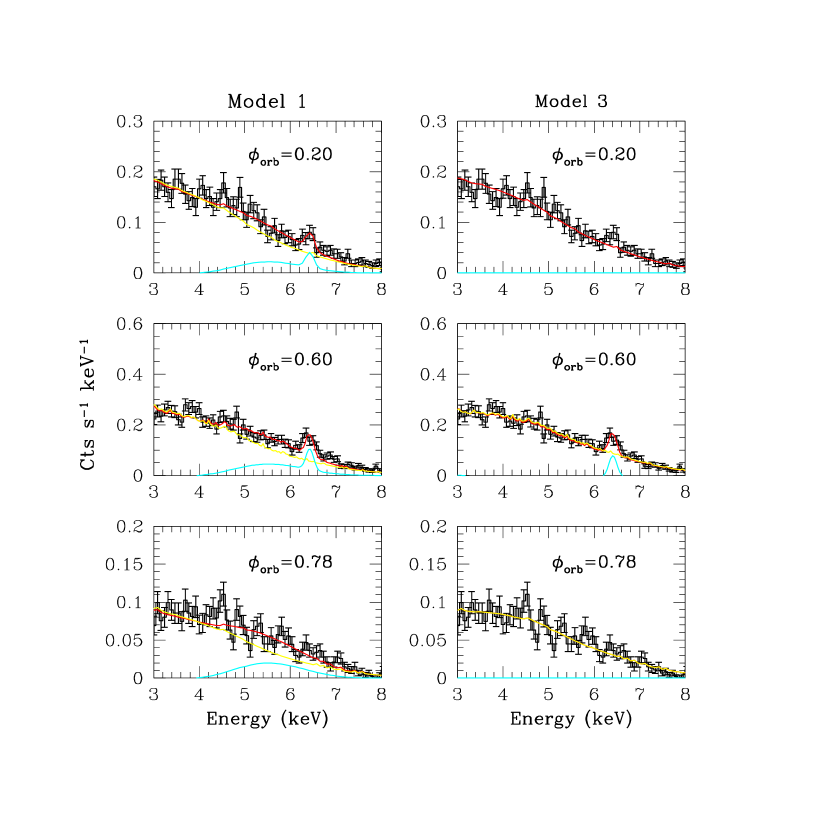
Because of the limited energy range of the ACIS-S in fitting the high state spectra we kept the power law photon index at the value ( = 0.9) found by several observers using different instruments (Woo et al., 1995; Wojdowski et al., 1998; Naik and Paul, 2004). We note that when the photon index is allowed to vary it converges to values between 0.8 to 1.0. We used the energy range 0.6-9.8 keV for fits but excluded the region 1.7-2.8 keV to take into consideration instrumental effects: the reflectivity of the HRMA is presently underestimated by about 10-15% around the IR-M edge at 2.1 keV (a likely source of the problem is a 7 layer of carbon on the mirrors which increases the reflectivity near edges; L. David personal communication). This is particularly troublesome for high count rate data. The blackbody temperature was allowed to vary and converged to the value found by the earlier observers. This simple continuum model (hereafter Model 1) provided reasonable fits to the high-state data as shown in Figure 1 for the parameters listed in Table 2a. The spectra are remarkably independent of orbital phase during the high-state. This suggests that during the high state the X-ray emission is dominated by the NS and it gets eclipsed rapidly by the companion. During the low state the NS is not directly in our line of sight and the diffuse material that then dominates is eclipsed gradually.
Although the simple power-law plus blackbody provided good fits to the high-state continuum spectra, since previous observers had included high-energy cut-offs we also fit our data to models that included this additional constraint (Model 2). We found that the cutoff energy and e-folding parameters could not be constrained by our data and converged to different values depending on the initial guess. Table 2b shows the results when the powerlaw photon index is allowed to vary; holding the photon index at 0.9 did not result in better constraints on the high energy cutoff and e-folding values.
Finally, we used a model in which soft photons are Comptonized in a hot plasma as generalized by Titarchuk (1994). This model (Model 3: ComptT) provided fits that were comparable to the simple power-law plus blackbody model in the sense that the reduced chisq converged to 1. However, the individual parameters of the model were not well constrained by the data and converged to different values depending on the initial guess.
We conclude that a blackbody of around 0.15 keV provides an excellent fit to the low-energy flux from SMC X-1 but that the current data are not of sufficient quality and energy range to uniquely constrain the high-energy flux.
3.2 Fits to Low-state Spectra
Since the eclipse and low-state spectra show evidence of spectral lines we augmented the continuum models with bright recombination lines determined using the XSTAR code (Kallman and Krolik, 1999). We used as input to XSTAR our best-fit continuum models with different values of the ionization parameter =L (Tarter, Tucker, and Salpeter, 1969); where Lx is the X-ray luminosity, is the proton number density, and r is the distance from the ionizing source). We used a metal abundance of 1/5th solar as expected for the SMC (Wojdowski, Clark, and Kallman, 2000). Our observations are consistent with emission from a photoionized plasma when the ionization parameter is in the range 2.0 log 2.5. We further restricted ourselves to lines that had been reported in the literature (using higher energy resolution data than the ACIS-S) for HMXB systems similar to SMC X-1. Since both models (Jimenez-Garate et al., 2001) and observations of several similar systems (Sako et al., 1999; Paerels. et al., 2000) indicate that radiative recombination continua (RRC: an unambiguous indicator of excitation by recombination in X-ray-photoionized gas) should be present at strengths up to half the intensities of the Lyman lines we have included reported RRC in our fits. Table 3 gives a list of lines and RRC that were searched for to fit our observations. In each case we added lines using the F test criterion (F F) for inclusion of additional terms (Bevington, 1969):
The observed countrates varied by a factor of 60 during our observations. In order to ensure sufficient counts per bin for spectral fitting low count spectra were binned before fitting: typically for the low state N was 125. Since we are dealing with relatively low resolution CCD data the line widths were constrained at 50 eV; hence only the line strength was a free variable. Some of the lines listed in Table 3 are blended in ACIS (for example we can not distinguish Ne IX [0.91 keV] from O VIII RRC [0.89 keV] or O VIII Lyβ [0.77 keV] from O VII RRC [0.74 keV]). However, the O VIII Lyα should be comparable to the RRC, and it is weak. At orbital phase 0.2 the feature at 2.4 keV may be identified as Si XIII RRC but Si XIII Lyα (2.0 keV) is below our detection limit.
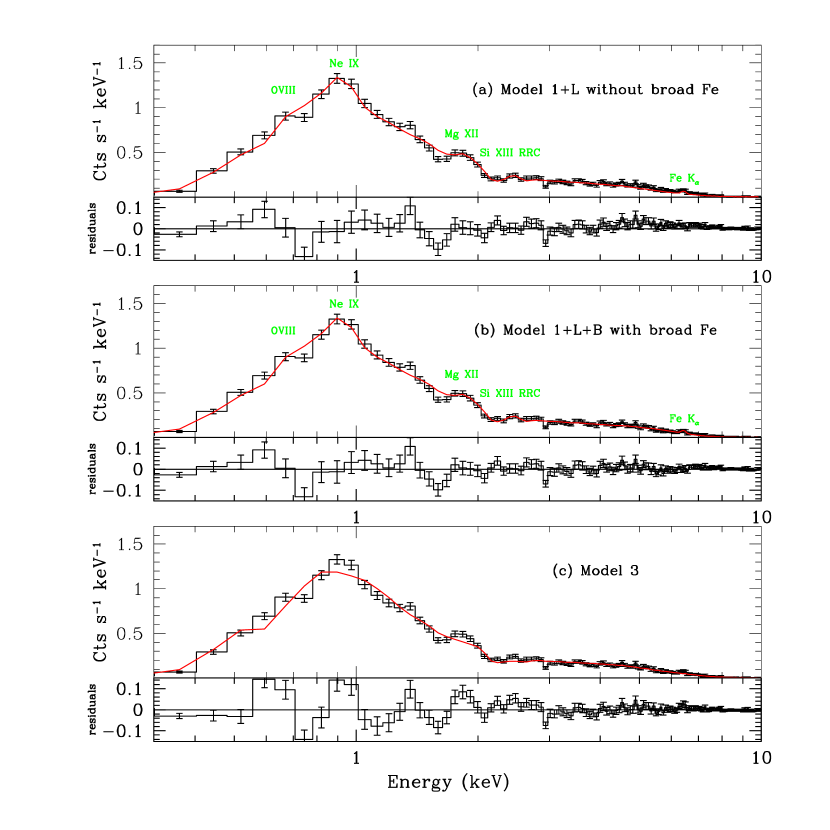
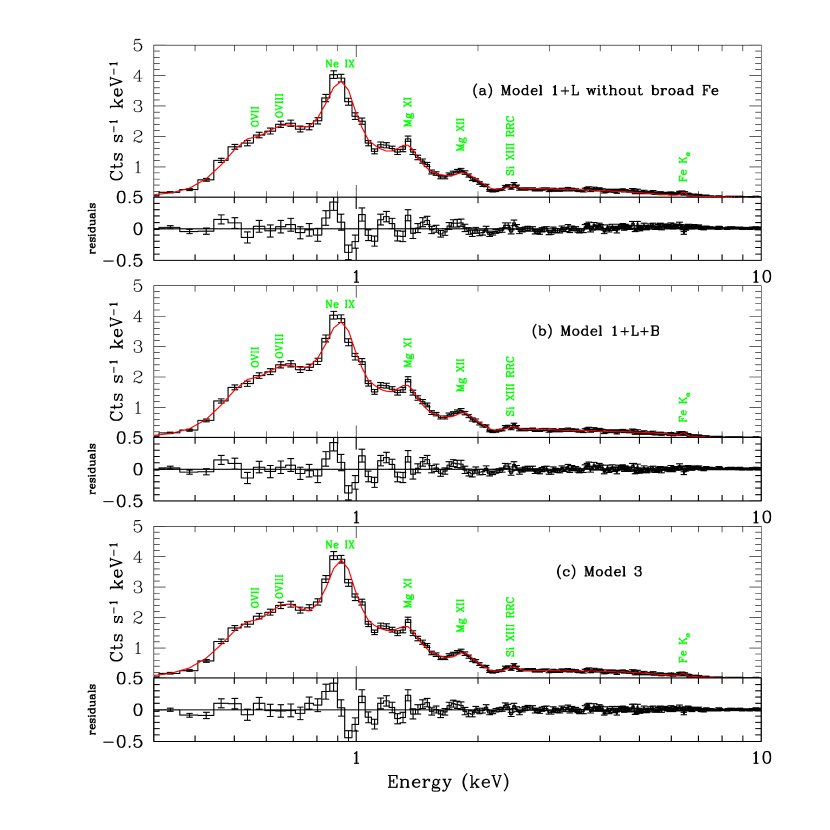
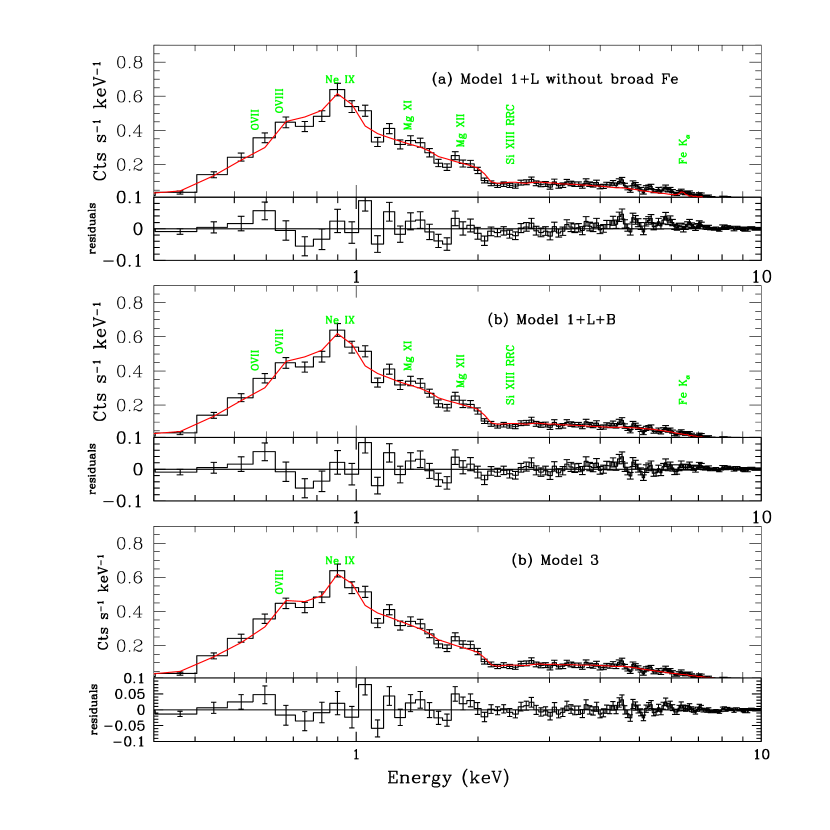
For our first attempt we used the simple power-law plus blackbody used for the High State augmented with the lines listed in Table 3 (Model 1+L). While this model provided good fits to the data (Table 4a) we noticed that the residuals show an excess near 6 keV that could not be modeled with narrow line emission. ASCA observations of SMC X-1 showed a broad ( = 0.85 keV) feature at 6 keV that could be attributed to Compton scattering of Fe K (Stahle et al., 1997). Since excess emission near this energy has been modeled with a skewed broad line (associating the broad line with the compact object) for several HMXBs (Miller et al., 2002a, b, 2004a, 2004b) we tried adding this feature to our models. We found that the fits were significantly improved with the addition of a skewed broad feature. In Table 4a we list the reduced when a broad ( = 800 eV) feature at 5.8 keV is included in the fits. Figures 2-4 show the low state data and our best fits with (Model 1+L+B) and without inclusion of a broad Fe line.
For completeness we fit the low-state data to all the models used for the high-state data. Again, for Model 2 the high-energy and e-folding values could not be constrained. Stahle et al. (1997) also found that the ASCA data showed poor fits when using a cutoff powerlaw rather than a simple powerlaw plus broad gaussian. The results for Model 3 as listed in Table 4b and shown in figures 2-4 provided formally good fits to the data without requiring broad Fe emission but again the individual parameters are not well constrained.
3.3 Fits to Eclipse data
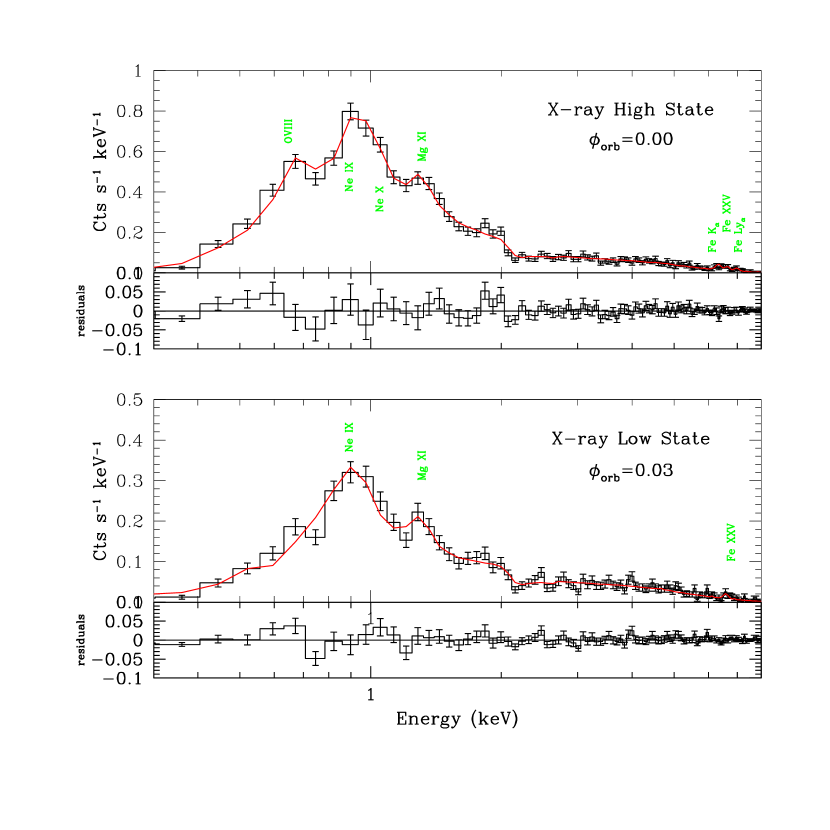
Since correction of spacecraft dither effects had not been implemented for CC mode data during our initial analysis of the eclipse data presented in Vrtilek et al. (2001) we have reanalyzed them. The best fit parameters are listed in Table 5 and plotted in Figure 5. The main effect of the correction is a reduction of background counts which resulted in a better determination of the continuum and correspondingly better confidence in the line detection. No broad Fe features were required during eclipse as is consistent with associating the broad feature (if it is real) with the neutron star.
3.4 The Fe line
For Model 1 both the Fe Kα and broad Fe line fluxes are positively correlated with the black body flux indicating either that they arise in the same region or are excited by the same process (Figure 6). If we interpret the blackbody radiation as hard X-rays reprocessed in the disk following Hickox, Narayan, and Kallman (2004), the emission radius ( = L) is a few times 108 cm, corresponding to the inner edge of the accretion disk. This interpretation considers a thick, partially spherical shell centered on the neutron star and subtending a solid angle, , at the X-ray source and differs from some estimates for Rbb, which assume the soft luminosity is radiated from a full sphere at Rbb (see Hickox, Narayan, and Kallman (2004) Figure 9). This is consistent with the pulse profile analysis of these data by Neilsen, Hickox, and Vrtilek (2004): they find that the soft pulses and the blackbody component both originate in the inner edge of the accretion disk. For Model 3 there is no particular correlation between the Fe-line and either of the continuum fluxes).
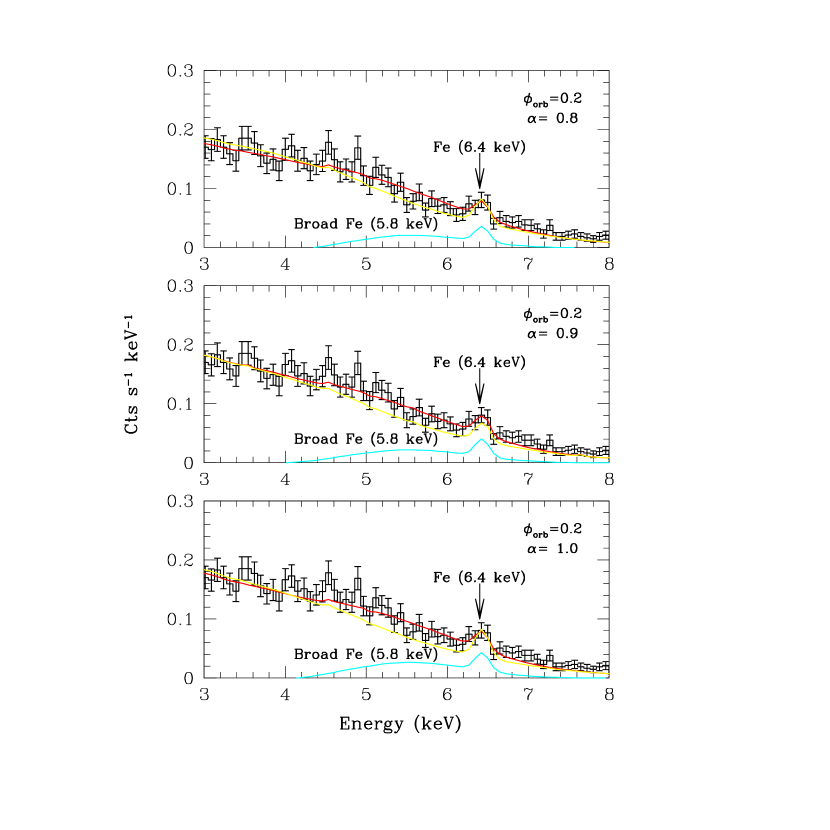
In Figure 7 we show closeups of the Fe-line regions of the low state spectra showing the narrow and broad components. For Model 1 the profiles are similar to Fe line profiles seen in AGN and Galactic black hole candidates. since we had restrained our fits to photon index =0.9 whereas allowed range during the high state is 0.8=1.0 we computed our values for the extremes of photon index as listed in Table 4b and plotted in Figure 8. The fact that the ComptT models do not require broad Fe lines suggests that ACIS-S cannot resove the Fe-line profile. The low count statistics and limited energy range (which makes continuum determination difficult) are also factors requiring consideration. We therefore caution the interpretation of observations taken with instruments at the resolution of the ACIS-S or poorer that claim to detect broad Fe lines unless the continuum is well-constrained by other means. The factor of 10 improvement in energy resolution and collecting power of ASTRO-E2 over the Chandra HETG near 6 keV may help resolve this issue.
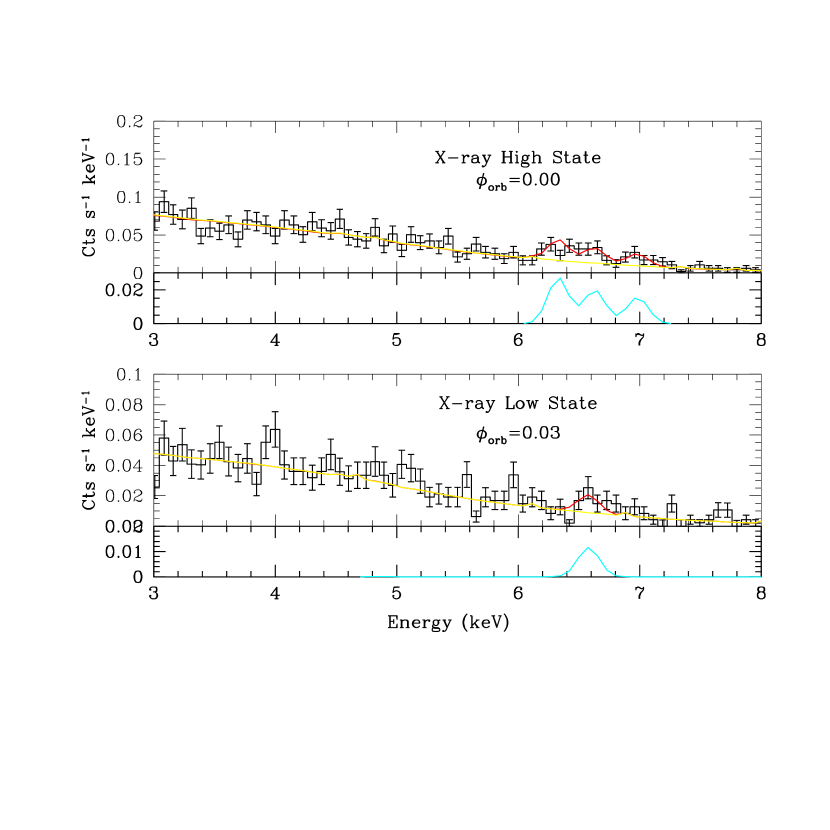
Zooming in on the Fe line region for the eclipse observations (Figure 9) shows both hydrogenic and helium-like Fe for the eclipse during the high state whereas only Fe Kα is seen during the low-state eclipse. There is no hint of a broad Fe feature.
4 Discussion and Conclusions
The gross structure of accretion disks and mass transfer has been explained as a problem governed by classical hydrodynamics with boundary conditions set by the masses and separation of the two stars (Shakura and Sunyaev, 1973; Lubow and Shu, 1975). However complications arise because X-ray heating is important even in the presence of strong viscous heating in the disk interior (Dubus et al., 1999) and instabilities driven by the radiation play a significant role on the dynamics (Pringle, 1996; Maloney, Begelman, and Pringle, 1996). Important physical processes in accretion disks, such as the viscous transport of angular momentum, the generation of magnetic fields, the nature of disk coronae and winds (Begelman and McKee, 1983; Begelman, McKee, and Shields, ), and turbulence within the disk and in the interaction with the gas stream from the companion (Armitage et al., 1998) have been characterized or parameterized, but our understanding is still in an exploratory stage.
In addition for high-mass X-ray binaries (HBXBs) such as SMC X-1 the stellar wind plays an active role as a partial source of fuel for the X-ray luminosity; the wind also plays a passive role because the X-ray spectrum is modified as it passes through the wind (Blondin and Woo, 1995).
One path toward obtaining clarifying information on these open issues is the study of discrete spectral features. The CCD on Chandra provides sufficient resolution to identify some of these features, although we note that higher energy resolution observations are necessary to exploit fully the information contained in them. For example, the detection of more than two dozen recombination emission lines in Chandra HETG spectra of Her X-1 allowed Jimenez-Garate et al. (2004) to measure the density, temperature, spatial distribution, elemental composition, and kinematics of the plasma; the absence of detected Doppler broadening in the lines allowed them to constrain the dynamics of the disk atmosphere and the geometry of the disk. XMM RGS observations of recombination lines in the eclipse spectrum of high-mass X-ray binary, 4U1700-37, allowed van der Meer et al. (2004) to conclude that the formation region extends beyond the size of the O supergiant. Observations of SMC X-1 with either the HETG on Chandra or the XRS on ASTRO-E2 (which provides factor-of-10 improvements in energy resolution and collecting power over the HETG near 6 keV) promise to extend this work in significant ways.
Our continuum fits during the high and low X-ray states are consistent with precession of an accretion disk in SMC X-1. During the high state the continuum displays little or no orbital variation out of eclipse: this is consistent with the central source being directly in our line-of-sight. The X-ray flux is reduced abruptly during eclipse. During the low-state the central source is blocked by the precessing accretion disk and we see emission from a larger scattering area with a radius of a few times 108 cm corresponding to the inner edge of the accretion disk; this larger area is gradually covered leading to the observed orbital variation. The X-ray flux during the low-state eclipse is roughly half that during the high-state eclipse because half the larger scattering area is obscured by the disk blocking the central source.
We have detected lines due to O, Ne, Mg, Fe, and Si as well as a possible RRC feature from Si in the low-state X-ray spectra of SMC X-1 using the Chandra ACIS-S in CC mode. A stringent limit on the ionization parameter is placed by the prominent Ne IX feature (Log = 2.0-2.5; see Fig. 5 in Wojdowski et al. (2001)). Because ASCA’s energy resolution was not sufficient to detect these lines Wojdowski et al. (2001) had concluded that the ionization parameter was either greater than 3 or less than 1 requiring the presence of circumstellar gases with both high and low ionization. Our result solves this problem and is consistent with the density distribution derived by Blondin and Woo (1995) using three-dimensional hydrodynamic simulations of the SMC X-1 system. This value of the ionization parameter is also consistent with the Hatchett-McCray effect seen in ultraviolet lines observed during our simultaneous observations with HST/STIS (Vrtilek et al., 2001) as well as recent observations of the OVI 1032 line with FUSE showing a similar Hatchett-McCray effect (Iping et al., 2004).
Jimenez-Garate et al. (2001) have modeled X-ray line emission from accreting disk atmospheres. They find a clear difference between evaporating or condensing disk atmospheres that should be detectable for either high-inclination systems or for systems where the central source is obscured but the extended disk emission is still visible: for example the O VIII Lyα to O VII He flux ratio in a condensing disk model is five times that of the evaporating disk model; and O VII RRC for the evaporating disk model has two times the flux predicted for the condensing disk model. At orbital phase 0.6 during the low state (which corresponds to a time when the central source is obscured) our O VIII Lyα to O VII He flux ratio is consistent within errors with that expected for an evaporating disk model. We do not have the sensitivity to detect the O VII RRC feature at 0.74 keV.
During orbital phase 0.0 in the high-state we find evidence for both hydrogenic and helium-like Fe in addition to the resonance line with relative ratios similar to those reported for Cen X-3 by Wojdowski et al. (2003). However, the relatively poor resolution of the CCD does not allow us to determine line ratios accurately. The fact that these features are not detected during low state eclipse is consistent with the fact that we see considerably more of the scattering material during the high state. The low state eclipse is effectively a fraction of the high state spectrum because the scattering region around the B star sees more of the disk. Grating observations are needed in order to test if the resonant X-ray line scattering model proposed for Cen X-3 by Wojdowski et al. (2003) is applicable to SMC X-1.
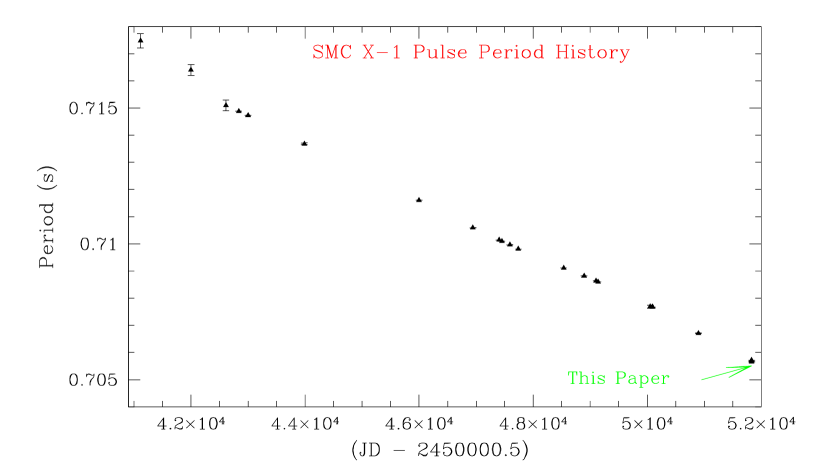
Finally, we have measured the pulse period of SMC X-1 during the epoch of our observations and find that it continues to show steady spin-up at an average rate of -1.2s s-1 (Figure 10). SMC X-1 thus continues to be the only X-ray pulsar for which no spin-down episodes has been observed. Pulse profile analysis of the high state data show a hard pulse profile that is consistently double-peaked with a soft pulse profile that varies in shape between single and double peak (Neilsen, Hickox, and Vrtilek, 2004). Although the data cover a small fraction of the superorbital cycle these profiles are consistent with the a model in which the soft pulses occur by reflection of the hard pulses at the inner edge of the accretion disk with different segments of the inner edge in the observer’s line of view as a function of superorbital phase. This picture is consistent with the soft flux (blackbody) coming from the inner edge of the accretion disk as well as the Fe line.
References
- Anders and Ebihara (1982) Anders, E., & Ebihara, M. 1982, Geochimica et Cosmochimica Acta 46, 2363
- Angelini et al. (1991) Angelini, L., Stella, L., & White, N.E. 1991, ApJ, 371, 332
- Armitage et al. (1998) Armitage, P.J., & Livio, M. 1998, ApJ, 493, 898
- Begelman and McKee (1983) Begelman, M.C., & McKee, C.F. 1983, ApJ, 271, 89
- (5) Begelman, M.C., McKee, C.F. & Shields, G.A. 1983,ApJ, 271, 70
- Bevington (1969) Bevington, P.R. “Data Reduction and Error Analysis for the Physical Sciences” 1969, New York: McGraw-Hill Book Company
- Blondin and Woo (1995) Blondin, J.M., & Woo, J.W. 1995, ApJ, 445, 889
- Boroson et al. (1999) Boroson, B., Kallman, T., McCray, R., Vrtilek, S.D., & Raymond, J.D. 1999, ApJ, 519, 191
- Cheng, Vrtilek, and Raymond (1995) Cheng, F.-H., Vrtilek, S.D., & Raymond, J. 1995, ApJ, 452, 825
- Davis (2001a) Davis, J.E. 2001a, ApJ, 548, 1010
- Davis (2001b) Davis, J.E. 2001b, ApJ, 562, 575
- Dubus et al. (1999) Dubus, G., Lasota, J., Hameury, J., & Charles, P. 1999, MNRAS, 303, 139
- Gruber and Rothschild (1984) Gruber, D.E., & Rothschild, R.E. 1984, ApJ, 283, 546
- Hickox, Narayan, and Kallman (2004) Hickox, R.C., Narayan, R., & Kallman, T.R. 2004, ApJ, 614,881
- Houck (2002) Houck, J.C. 2002, High Resolution X-ray Spectroscopy with XMM-Newton and Chandra. MSSL, University College London. Ed. G. Branduardi-Raymont, published electronically and stored on CD., p. E17
- Houck and Denicola (2000) Houck, J.C., & Denicola, L.A. 2000, ADASS, 9, 591
- Iping et al. (2004) Iping, R.C., Sonneborn, G., Kaper, L., & Hammerschlag-Hensberge, G. 2004, astro-ph 0410539
- Jimenez-Garate et al. (2001) Jimenez-Garate, M.A., Raymond, J.C., Liedahl, D.A., & Hailey, C.J. 2001, ApJ, 558, 448
- Jimenez-Garate et al. (2004) Jimenez-Garate, M.A., Raymond, J.C., Liedahl, D.A., & Hailey, C.J. ApJ, in press. Astro-ph 0411780.
- Kahabka and Li (1999) Kahabka, P. & Li X.-D. 1999, A&A, 345, 117
- Kallman and Krolik (1999) Kallman, T.R. & Krolik, J.H., 1999, XSTAR, a Spectral Analysis Tool (Greenbelt: NASA/GSFC HEASARC)
- Levine et al. (1996) Levine, A.M., Bradt, H., Cui, W., Jernigan, J.G., Morgan, E.H.,
- Morrison and McCammon (1983) Morrison, R., & McCammon, D. 1983, ApJ, 270, 119 Remillard, R., Shirey, R.E., & Smith, D.A. 1996,ApJ, 469, L33
- Li and van den Heuvel (1997) Li, X.-D., & van den Heuvel, E.P.J. 1997, A&A, 321, L25
- Lubow and Shu (1975) Lubow, S.H., & Shu, F.H. 1975,ApJ, 198, 383
- Maloney, Begelman, and Pringle (1996) Maloney, P.R., Begelman, M.C., & Pringle, J.E. 1996,ApJ, 472, 582
- Miller et al. (2004a) Miller, J.M., Fabian, A.C., Nowak, M., & Lewin, W.H.G. 2004a, astro-ph/040 2101
- Miller et al. (2002a) Miller, J.M. et al. 2002a, ApJ, 578, 348
- Miller et al. (2002b) Miller, J.M. et al. 2002b, ApJ, 570, L69
- Miller et al. (2004b) Miller, J.M. et al. 2004b, ApJ, 601, 465
- Naik and Paul (2004) Naik, S., & Paul, B 2004, A&A, 418, 655, astro-ph/0402096
- Neilsen, Hickox, and Vrtilek (2004) Neilsen, J., Hickox, R.C., & Vrtilek, S.D., & Hickox, R.C. 2004, ApJ, 616L, 135
- Paerels. et al. (2000) Paerels, F. et al. 2000,ApJ, 533, L135
- Pringle (1996) Pringle, J.E. 1996, MNRAS, 281, 357
- Sako et al. (1999) Sako, M., Liedahl, D.A., Kahn, S.M., & Paerels, F. 1999,ApJ, 525, 921
- Shakura and Sunyaev (1973) Shakura, N.I., & Sunyaev, R.A., 1973, A&A, 24, 337
- Stahle et al. (1997) Stahle, C.K., Ebisawa, K., Kelley, R.L., Mukai, K. & White, N. 1997, in X-Ray Imaging and Spectroscopy of Cosmic Hot Plasmas”, eds. F. Makino and K. Mitsuda, Tokyo: Universal Academy Press
- Tarter, Tucker, and Salpeter (1969) Tarter, C.B., Tucker, W.H., & Salpeter, E.E. 1969,ApJ, 156, 943
- Titarchuk (1994) Titarchuk, L. 1994, ApJ, 434, 570
- van der Meer et al. (2004) van der Meer, A., Kaper, L., Di Salvo, T., Mendez, M., van der Klis, M. Barr, P., & Trams, N.R. 2004. Astro-ph 0412021
- Vrtilek et al. (1997) Vrtilek, S.D., Boroson, B., McCray, R., Nagase, F., & Cheng, F. 1997, ApJ, 490, 377
- Vrtilek et al. (2001) Vrtilek, S.D., Raymond, J.C., Boroson, B., Kallman, T., Quaintrell, H., & McCray, R. 2001,ApJ, 563, L139
- Wojdowski, Clark, and Kallman (2000) Wojdowski, P., Clark, G.W., & Kallman, T.R. 2000,ApJ, 541, 963
- Wojdowski et al. (1998) Wojdowski, P., Clark, G.W., Levine, A.M., Woo, J.W., & Zhang, S.N. 1998,ApJ, 502, 253
- Wojdowski et al. (2003) Wojdowski, P., Liedahl, D.A., Sako, M., Kahn, S.M., & Paerels, F. 2003, ApJ, 582, 959
- Wojdowski et al. (2001) Wojdowski, P., Liedahl, D.A., & Sako, M. 2001,ApJ, 547, 973
- Woo et al. (1995) Woo, J.W., Clark, G.W., Blondin, J.M., Kallman, T.R., & Nagase, F. 1995,ApJ, 495, 896
- Zane et al. (2004) Zane, S., Ramsay, G., Jimenez-Garate, M. A., Willen dem Herder, J., & Hailey, C.J. 2004, MNRAS, 350, 506


| Table 1: Log of SMC X-1 Chandra/ACIS Observations | ||||
| Sequence | Julian Date | Good time | Orbital phase | X-ray |
| Number | at Start | (s) | at midpoint | State |
| 400101 | 2451831.3904 | 6194 | 0.00 | High |
| 400102 | 2451832.1694 | 6244 | 0.20 | High |
| 400103 | 2451833.3365 | 6133 | 0.50 | High |
| 400104 | 2451834.3083 | 6465 | 0.75 | High |
| 400105 | 2451855.5201 | 6137 | 0.20 | Low |
| 400106 | 2451857.0972 | 6329 | 0.60 | Low |
| 400107 | 2452025.1074 | 6124 | 0.78 | Low |
| 400108 | 2452026.0973 | 6156 | 0.03 | Low |
| Table 2a. Fits to High State Spectra: Model 1 (Power-law + BB) | |||
|---|---|---|---|
| Parameter | =0.20 | =0.50 | =0.75 |
| NH (1022 cm-2) | 0.18 | 0.24 | 0.19 |
| I | .056 | 0.058 | .056 |
| 0.9 | 0.9 | 0.9 | |
| I | .0012 | .0019 | .0021 |
| Ebb(keV) | 0.18 | 0.19 | 0.18 |
| 1.0 | 1.1 | 1.0 | |
| Pileup Fraction | 0.16 | 0.17 | 0.16 |
∗Powerlaw photon index held at value found for SMC X-1 using Ginga (Woo et al. 1995) and ASCA (Wojdowski et al. 2000) observations. ∗∗(photons keV-1cm-2s
| Table 2b. Fits to High State Spectra: Model 2(Cutoff Power-law + BB) | |||
|---|---|---|---|
| Parameter | =0.20 | =0.60 | =0.75 |
| NH (1022 cm-2) | 0.16 | 0.25 | 0.16 |
| Ipl∗∗ | .05 | 0.06 | .05 |
| 1.0 | 1.0 | 0.3 | |
| Ec | 6 | 32870 | 3 |
| Ef | 6 | 50 | 6 |
| Ibb∗∗ | 001 | .0020 | .0011 |
| Ebb(keV) | 0.19 | 0.18 | 0.20 |
| 1.0 | 1.1 | 1.0 | |
| Pileup Fraction | 0.18 | 0.18 | 0.16 |
∗Powerlaw photon index held at value found for SMC X-1 using Ginga (Woo et al. 1995) and ASCA (Wojdowski et al. 2000) observations. ∗∗(photons keV-1cm-2s Ec is the cutoff energy and Ef the e-folding energy as defined by (Woo et al. 1995).
| Table 2c. Fits to High State Spectra: Model 3 (ComptT + BB) | |||
|---|---|---|---|
| Parameter | =0.20 | =0.60 | =0.75 |
| NH (1022 cm-2) | 0.17 | 0.24 | 0.17 |
| IComptT | .045 | 0.008 | .046 |
| ComptT kT | 110 | 496 | 102 |
| ComptT TO | tied to Ebb | tied to Ebb | tied to Ebb |
| ComptT Tau | 21.4 | 44 | 21.6 |
| ComptT Redshift | fixed at 0 | fixed at 0 | fixed at 0 |
| ComptT Approx | fixed at 2 | fixed at 2 | fixed at 2 |
| Ibb | .001 | .0019 | .0021 |
| Ebb(keV) | 0.16 | 0.18 | 0.18 |
| 1.0 | 1.1 | 1.0 | |
| Pileup Fraction | 0.18 | 0.18 | 0.18 |
∗∗(photons keV-1cm-2s
| Table 3∗: Lines used in fitting low-state and eclipse spectra | ||
| Ion | Wavelength (Å) | Energy (keV) |
| O VII He | 21.80 | 0.56 |
| O VIII Lyα | 18.97 | 0.65 |
| O VIII Lyβ; O VII RRC | 16.5 | 0.75 |
| Ne IX; OVIII RRC? | 13.45 | 0.91 |
| Ne X Lyα | 12.13 | 1.02 |
| Mg XI | 9.17 | 1.34 |
| Mg XII Lyα | 8.50 | 1.47 |
| Mg XII | 7.09 | 1.75 |
| Si XIII He | 6.70 | 1.85 |
| S XIV Lyα | 6.20 | 2.00 |
| S XV; Si XIII RRC | 5.20 | 2.44 |
| S XVI Lyα | 4.75 | 2.62 |
| Si XIV RRC | 4.65 | 2.66 |
| Ar XVIII Lyα | 3.75 | 3.30 |
| Broad Fe | 2.13 | 5.82 |
| Fe Kα | 1.94 | 6.38 |
| Fe XXV He | 1.86 | 6.70 |
| Fe XXVI Ly α | 1.78 | 7.00 |
∗Lines marked with a: have been seen in XMM/RGS observations of SMC X-1 during eclipse (Wojdowski 2003); have been detected in ASCA SIS observations of Vela X-1 (Sako et al. 1997); have been seen in Chandra/HETGS observations of Cen X-3 (Wojdowski et al. 2003); and with have been seen in Chandra/HETGS observations of Cyg X-3 (Paerels et al. 2000).
| Table 4a∗. Fits to Low State Spectra: (Model 1+L and Model 1+L+B ) | |||
|---|---|---|---|
| Orbital Phase | 0.20 | 0.60 | 0.78 |
| NH (10cm-2 | 0.30 | 0.42 | 0.29 |
| Ipl(photons keV-1cm-2s | 1.4e-3 | 2.1e-3 | 6.9e-4 |
| 0.9 | 0.9 | 0.9 | |
| Ibb(photons keV-1cm-2s | 8.0e-5 | 3.9e-4 | 3.2e-5 |
| EBB(keV) | 0.16 | 0.14 | 0.15 |
| O VII 0.56 | … | 1.4e-3 | … |
| O VIII 0.65 | 4.3e-4 | 1.3e-3 | 3.1e-4 |
| Ne IX 0.91 | 2.8e-4 | 2.0e-3 | 1.5e-4 |
| Mg XI 1.34 | … | 2.6e-4 | … |
| Mg XII 1.84 | 2.7e-5 | 9.8e-5 | … |
| Si XIII RRC 2.44 | 3.5e-5 | 5.9e-5 | … |
| Broad Fe 5.8 | 2.1e-4 | 4.3e-4 | 1.9e-4 |
| Fe Kα 6.38 | 4.4e-5 | 1.2e-4 | … |
| without broad Fe | 1.7 | 1.6 | 1.4 |
| with broad Fe | 1.2 | 1.2 | 1.0 |
| Pileup fraction | .007 | .014 | .003 |
∗All line widths were held constant at 50 eV. The broad Fe feature
was held at a width of 800eV.
Errors listed are 1. Lines detected below 3 are not listed.
∗∗Powerlaw photon index held at value found for SMC X-1 using Ginga
(Woo et al. 1995), ASCA
(Wojdowski et al. 2000), and BeppoSAX (REF) observations.
| Table 4b∗. As in 4a for = 0.2 for extremes of Powerlaw photon index ) | |||
|---|---|---|---|
| NH (10cm-2 | 0.29 | 0.30 | 0.30 |
| Ipl(photons keV-1cm-2s | 1.2e-3 | 1.4e-3 | 1.5e-3 |
| 0.8 | 0.9 | 1.0 | |
| Ibb(photons keV-1cm-2s | 8.0e-5 | 8.0e-5 | 8.0e-5 |
| EBB(keV) | 0.17 | 0.16 | 0.16 |
| O VIII 0.65 | 4.1e-4 | 4.3e-4 | 4.2e-4 |
| Ne IX 0.91 | 2.6e-4 | 2.8e-4 | 2.8e-4 |
| Mg XII 1.84 | 3.6e-4 | 2.7e-5 | 2.8e-5 |
| Si XIII RRC 2.44 | 3.9e-5 | 3.5e-5 | 3.7e-5 |
| Broad Fe 5.8 | 1.5e-4 | 2.1e-4 | 2.6e-4 |
| Fe Kα 6.38 | 4.4e-5 | 4.4e-5 | 4.4e-5 |
| without broad Fe | 1.5 | 1.7 | 2.1 |
| with broad Fe | 1.3 | 1.2 | 1.5 |
| Pileup fraction | .007 | .007 | .007 |
∗All line widths were held constant at 50 eV with the exception of the broad Fe feature which was held at 800 eV. Errors listed are 1. Lines detected below 3 are not listed.
Table 4c∗. Fits to Low State data: Model 3 (ComptT)
| Model | 0.20 | 0.60 | 0.78 |
|---|---|---|---|
| NH (10cm-2 | 0.40 | 0.33 | 0.22 |
| I | 2.99e-3 | 3.0e-3 | 1.0e- 3 |
| CompttkT | 6 | 6.9 | 4.3 |
| CompttTO | tied to EBB | tied to EBB | tied to EBB |
| ComptTau | 23 | 28 | 30 |
| ComptRedshift | held at 0 | held at 0 | held at 0 |
| ComptApprox | held at 2 | held at 2 | held at 2 |
| I | 2.2e-4 | 2.1e-4 | 1.8e-5 |
| EBB(keV) | 0.14 | 0.16e-3 | 0.19 |
| O VII 0.56 | … | 6.3e-3 | … |
| O VIII 0.65 | … | 2.3e-3 | 3.0e-4 |
| Ne IX 0.91 | … | 1.8e-3 | 1.4e-4 |
| Mg XI 1.34 | … | 2.0e-4 | … |
| Mg XII 1.84 | … | 1.1e-4 | … |
| Si XIII 2.40 | … | 8.2e-5 | … |
| Broad Fe 5.8 | … | … | … |
| Fe Kα 6.38 | … | 1.2e-4 | … |
| 1.2 | 1.1 | 1.0 | |
| Pileup fraction | 0.0 | 0.0 | 0.0 |
∗All line widths were held constant at 50 eV.
Errors listed are 1. Lines detected below 3 are not listed.
∗∗ (photons keV-1cm-2s-1)
| Table 5∗: Fits to Eclipse Spectra | ||
|---|---|---|
| Orbital Phase | 0.00 | 0.03 |
| NH (10cm-2 | 0.21 | 0.57 |
| Ipl(photons keV-1cm-2s | 5.8e-4 | 3.9e-4 |
| 0.94 | 0.94 | |
| Ibb(photons keV-1cm-2s | 1.3e-5 | 1.2e-4 |
| EBB(keV) | 0.22 | 0.11 |
| O VIII 0.65 | 4.5e-4 | … |
| Ne IX 0.91 | 2.1e-4 | 2.1e-4 |
| Ne X 1.02 | 9.0e-5 | … |
| Mg XI 1.34 | 4.5e-5 | 3.6e-5 |
| Fe Kα 6.38 | 2.4e-5 | … |
| Fe XXV 6.6 | 3.4e-5 | 1.9e-5 |
| Fe LYα 7.0 | 3.6e-5 | … |
| 0.9 | 1.0 | |
| Pileup fraction | .000 | .001 |
∗All line widths were held constant at 50 eV. Errors listed are 1. Lines detected below 3 are not listed. ∗∗Powerlaw photon index held at value found for SMC X-1 using Ginga (Woo et al. 1995) and ASCA (Wojdowski et al. 2000) observations.