Towards an understanding of the rapid decline of the cosmic star formation rate
Abstract
We present a first analysis of deep 24m observations with the Spitzer Space Telescope of a sample of nearly 1500 galaxies in a thin redshift slice, . We combine the infrared data with redshifts, rest-frame luminosities, and colors from COMBO-17, and with morphologies from Hubble Space Telescope images collected by the GEMS and GOODS projects. To characterize the decline in star-formation rate (SFR) since , we estimate the total thermal infrared (IR) luminosities, SFRs, and stellar masses for the galaxies in this sample. At , nearly 40% of intermediate and high-mass galaxies (with stellar masses M⊙) are undergoing a period of intense star formation above their past-averaged SFR. In contrast, less than 1% of equally-massive galaxies in the local universe have similarly intense star formation activity. Morphologically-undisturbed galaxies dominate the total infrared luminosity density and SFR density: at z 0.7, more than half of the intensely star-forming galaxies have spiral morphologies, whereas less than 30% are strongly interacting. Thus, a decline in major-merger rate is not the underlying cause of the rapid decline in cosmic SFR since . Physical properties that do not strongly affect galaxy morphology — for example, gas consumption and weak interactions with small satellite galaxies — appear to be responsible.
1 Introduction
It has become clear in the last decade that the average star-formation rate (SFR) per unit comoving volume — the so-called cosmic SFR — has declined by an order of magnitude since (Lilly et al., 1996; Madau, Pozzetti, & Dickinson, 1998; Hogg et al., 1998; Flores et al., 1999; Haarsma et al., 2000; Hopkins, 2004). A number of physical processes may contribute to this decline: e.g., a declining rate of major galaxy mergers, a drop in the rate of minor tidal interactions, or the progressive consumption of cold gas. Yet, many empirical aspects of this declining cosmic SFR are frustratingly unclear. Does the star formation in disks evolve slowly, while merger-induced starbursts evolve rapidly? Does the decreasing number density of galaxies with high SFR reflect a decline in SF in Milky-Way mass galaxies or reflect a disappearance of a population of bursting dwarf galaxies? In this paper, we present a first basic analysis of deep 24µm observations taken by the MIPS Team (Rieke et al., 2004; Papovich et al., 2004; Rigby et al., 2004). We combine these infrared (IR) data with the COMBO-17 redshift and spectral energy distribution (SED) survey (Wolf et al., 2004a) and the largest existing Hubble Space Telescope (HST) ACS mosaic (GEMS; the Galaxy Evolution from Morphology and SEDs; Rix et al., 2004) to study nearly 1500 galaxies with in the 30 extended Chandra Deep Field South (CDFS), with the goal of exploring the morphologies, stellar masses and SFRs of galaxies, and probing the physics driving the decrease in the cosmic SFR to the present day.
1.1 Understanding the form of the cosmic star formation history
The basic form of the cosmic star-formation history (SFH) was initially established using observations of rest-frame ultraviolet (UV) luminosity (Lilly et al., 1996; Madau et al., 1996; Madau, Pozzetti, & Dickinson, 1998; Steidel et al., 1999), which in the absence of dust is an excellent indicator of the bolometric light output from young, massive stars. As rest-frame UV is redshifted into the optical, it becomes observationally straightforward to establish a deep census of unobscured young stars, well below the knee of the luminosity function. Yet, studies of both local and distant galaxies have shown that only a small fraction of the UV photons from galaxies escape unhindered (dwarf galaxies are often optically thin to UV photons, but do not significantly contribute to the SFR density; Wang & Heckman, 1996; Adelberger & Steidel, 2000; Bell, 2003). Thus, the observed drop in UV luminosity density may not track quantitatively the drop in cosmic SFR.
Mindful of the limitations of rest-frame UV, other SFR indicators have been explored. Rest-frame optical line emission reflects the ionizing photon output from very massive young stars, in the absence of dust extinction (see Kennicutt, 1998, for a detailed discussion). Emission line-derived SFRs have been studied intensively in the local universe (Gallego et al., 1995; Brinchmann et al., 2004), and have been probed out to for the very brightest galaxies using rest-frame Oii and Balmer line emission (Hogg et al., 1998; Yan et al., 1999; Glazebrook et al., 1999; Tresse et al., 2002; Hippelein et al., 2003; Erb et al., 2003). These studies find a considerable drop in the average SFR per unit volume in luminous galaxies since , but owing to the difficulty of measuring Balmer decrements of high redshift galaxies, considerable uncertainties remain.
Radio and X-ray emission from distant galaxies also constrains their SFRs (Condon, 1992; Cohen, 2003). Observational constraints limit the applicability of both indicators to just the brightest sources at this stage; a substantial drop in the volume-averaged SFR in very luminous sources is again seen since (e.g., Haarsma et al., 2000; Cohen, 2003). Yet, both X-ray and radio luminosities are strongly boosted by the presence of an active galactic nucleus (AGN), and the physical origin of both is not well-understood.
One of the most intuitive SFR indicators is the luminosity of a galaxy in the thermal IR. For most star-forming galaxies, the thermal IR emission is dominated by reprocessed UV photons from massive young stars that are dust-enshrouded (see Kennicutt, 1998, for an excellent review). For most galaxies the combined IR and UV luminosity is a relatively robust indicator of the bolometric output from young stars, and therefore a good proxy for SFR (e.g., Gordon et al., 2000; Buat et al., 2002; Bell, 2003), especially if the modest contribution to the IR flux from dust-reprocessed light from older stellar populations is accounted for (typically % or less; Misiriotis et al., 2001; Bell, 2003). Until recently, instrumental sensitivity has been a key limitation at these wavelengths; only galaxies with IR luminosities have been observed at cosmologically-interesting redshifts by the Infrared Space Observatory (ISO). Through detailed modeling and analysis of these observations, it is clear that highly-luminous IR galaxies were much more common at than they are today (e.g., Flores et al., 1999; Elbaz et al., 2002; Mann et al., 2002; Pozzi et al., 2004). Observations of sub-mm emission from distant, intensely star-forming galaxies have extended this picture to (e.g., Blain et al., 1999). Yet, despite this encouraging progress, it is still unclear how the evolution of these highly-luminous galaxies is linked to the much more numerous fainter galaxies that dominate the volume-averaged SFR.
1.2 Understanding the physical drivers of star formation
A wide range of processes may contribute to the order-of-magnitude drop in cosmic SFR since : major mergers, tidal interactions, gas consumption, ram-pressure stripping, galaxy harassment, or the secular evolution of bars. Deciding which processes dominate involves a number of observational and interpretive challenges. As an example, it is challenging to measure the major merger rate robustly; close pair statistics suffer from contamination, automated asymmetry measures are sensitive to contamination from irregular galaxies and very close projected pairs, and visual morphological classifications are subjective, and less sensitive to prograde interactions owing to their lack of pronounced tidal tails.
There is evidence that these different physical processes play a role in shaping the SFRs of galaxies. Many merging galaxies form stars intensely (e.g., Sanders & Mirabel, 1996). Given the observational evidence for a drop in the merger rate since (e.g., Le Fèvre et al., 2000; Patton et al., 2002; Conselice et al., 2003), it is indeed plausible that the decline in the volume-averaged cosmic SFR is driven at least in part by this drop in merger rate. Furthermore, minor interactions seem to enhance SFRs, at least in the local universe (e.g., Barton, Geller, & Kenyon, 2000), plausibly by exciting unstable modes such as bars or strong transient spiral arms in the affected galaxies. The exhaustion of cold gas could also play a role. Indeed, most massive nearby galaxies have low gas fractions % (e.g., Kennicutt, Tamblyn, & Congdon, 1994; Bell & de Jong, 2000), and the current SFRs of many local galaxies will exhaust the available gas supply in Gyr (e.g., Kennicutt, Tamblyn, & Congdon, 1994). It is possible that fresh infall or recycled gas can help to sustain star formation for a longer time. Yet, it is also possible that we live in a special epoch, when the star formation in massive galaxies is switching off.
1.3 The object of this paper
This paper is one of a series in which we explore different aspects of the declining cosmic SFR. Wolf et al. (2005) study the contribution of different galaxy morphologies to the rest-frame 2800Å luminosity density for rest-frame -band selected galaxies in a thin redshift slice from COMBO-17 and GEMS. In this paper, we supplement this optically-selected sample with 24µm data from Spitzer, to explore the contribution of obscured star formation111An additional advantage of adopting such a narrow redshift slice for this paper is that the effects of differential surface brightness dimming, morphological -corrections, and uncertainties in the conversion of 24µm flux to total IR are minimized.. Le Floc’h et al. (in preparation) explore the IR luminosity function over the range using MIPS 24µm data and COMBO-17 redshifts. Papovich et al. (in preparation) explore the morphologies of the galaxies that dominate the turn-over in the 24µm number counts, as a clue to understanding the drivers of IR-obscured star formation.
In this paper, we study the MIPS 24µm properties of a complete sample of rest-frame -band selected galaxies in the CDFS222At this stage, we cannot and do not study completely obscured galaxies with extremely faint or non-existent UV/optical detections. Preliminary indications are that these optically faint IR sources are optically faint largely owing to their relatively high redshift (; e.g., Papovich et al., 2004) rather than having a lower redshift and higher obscuration. See Appendix A, where this issue is explored in more detail.. Owing to the high sensitivity and relatively tight point spread function of 24µm Spitzer observations, many more star-forming galaxies are detected at 24µm than at 70µm and 160µm. We use IR template spectra, tuned to reproduce the whole range of local galaxy IR SEDs, to transform 24µm luminosity into total IR luminosity. For the smaller area imaged by Chandra to date, we incorporate the Chandra X-ray data (Alexander et al., 2003) to explore the importance of AGN at 24µm (see also Rigby et al., 2004). Our main goals are to identify all galaxies with high SFRs, explore their morphologies, and characterize the importance of massive starbursting galaxies compared to the present-day universe, as a probe of the physics driving the declining cosmic SFR.
The paper is set out as follows. In §2 we discuss the data. In §3 we outline the methods used to estimate total IR flux, SFR and stellar mass, and the main sources of uncertainty. In §4 we present trends in the IR/UV ratio. In §5 we explore the contribution of different morphological types to the total SFR at . In §6 we discuss intense star formation in massive galaxies, and how this changes over the last 7 Gyr. In §7 we compare with existing data, explore the contribution of AGN, compare with theory, and discuss future improvements in this analysis. In §8 we present our conclusions. Appendices A and B discuss possible incompleteness in our optically-selected catalog, and uncertainties in the galaxy morphological classifications. Throughout, we express the estimated integrated UV and IR luminosities in terms of the bolometric luminosity of the sun W. We assume , , and km s-1 Mpc-1 (Spergel et al., 2003). Estimates of SFR and stellar mass assume a universally-applicable Kroupa (2001) IMF333 In the case where the stellar IMF varies as a function of time and/or from galaxy-to-galaxy, neither SFRs nor stellar masses will be robust except perhaps at the order-of-magnitude level..
2 The Data
2.1 MIPS Data
Spitzer observed a field around the CDFS in January and February 2004 as part of the time allocated to the Spitzer Guaranteed Time Observers (GTOs). The MIPS 24µm data was taken in slow scan–map mode, with individual exposures of 10 s. We reduced the individual image frames using a custom data–analysis tool (DAT) developed by the GTOs (Gordon et al., 2005)444To date, our preliminary tests indicate that the DAT reduction of MIPS 24µm data is nearly identical to that provided by the Spitzer Science Center pipeline.. The reduced images were corrected for geometric distortion and combined to form full mosaics. The final mosaic has a pixel scale of pixel-1 and an image PSF FWHM of ″. The Spitzer astrometry is aligned to the ESO Imaging Survey (EIS; Arnouts et al., 2001) with a typical accuracy 0.5″. The overall astrometric solution is then shifted by nearly 1″ by matching to the much sparser Two Micron All Sky Survey catalog (2MASS). This revised astrometric solution is matched to ″with the COMBO-17 coordinate system.
Source detection and photometry were performed using techniques described in Papovich et al. (2004); based on the analysis in that work, we estimate that our source detection is 80% complete at 83 Jy in the 24µm image. Based on our noise estimates, the photon noise in the 24µm image is roughly equal to the confusion noise at this depth (see, e.g., Dole et al., 2004).
2.2 Optical Data: COMBO-17 and GEMS
To date, COMBO-17 has surveyed three disjoint southern and equatorial fields to deep limits in 5 broad and 12 medium passbands. Using these deep data in conjunction with non-evolving galaxy, star, and AGN template spectra, objects are classified and redshifts assigned for % of the objects to a limit of . Typical galaxy redshift accuracy is (Wolf et al., 2004a), allowing construction of mag accurate rest-frame colors and absolute magnitudes (accounting for distance and -correction uncertainties). Astrometric accuracy is ″.
To explore galaxy morphology in the rest-frame optical from a single observed passband, we study galaxies in one thin redshift slice. Here, we select galaxies from COMBO-17 in the CDFS for morphological classification in the narrow interval (corresponding to Gyr, minimizing galaxy evolution across this slice). At this redshift, F850LP samples roughly rest-frame -band, and Spitzer’s 24µm passband samples rest-frame 14µm, allowing comparison with local samples. Furthermore, is close to the median redshift of COMBO-17, maximizing the sample size.
We use F850LP imaging from the GEMS survey (Rix et al., 2004) to provide resolution rest-frame -band data for 1492 galaxies with . GEMS surveys a portion of the CDFS in the F606W and F850LP passbands to deep limits using the Advanced Camera for Surveys (Ford et al., 2003) on the HST. The GEMS area is covered by a multiple, overlapping image mosaic that includes the smaller but deeper GOODS area (Giavalisco et al., 2004). One orbit per pointing was spent on each passband (63 GEMS tiles and 15 GOODS tiles), allowing galaxy detection to a limiting surface brightness within the half-light radius of mag arcsec-2 (Rix et al., 2004). At , ACS resolution corresponds to pc resolution, roughly equivalent to resolution at Coma cluster distances.
Galaxy classification was carried out by-eye on the sample by EFB, CW and DHM using the GEMS F850LP imaging555Automated classification using profile fitting is highly consistent with the by-eye classifications that we adopt here, in terms of differentiating between bulge-dominated galaxies and disk-dominated galaxies (Bell et al., 2004). Work on automated diagnostics of galaxy interactions in GEMS is ongoing, and will be discussed in a future work. . In what follows, we adopt by-eye classification bins of E/S0, Sa–Sd, irregular/compact (Irr), and peculiar/clearly interacting (Pec/Int). Galaxies were classified on the basis of both central light concentration and smoothness. E/S0 galaxies were required to have dominant spheroids and smooth light distributions. Sa–Sd galaxies were required to have prominent disks with signs of ongoing star formation. Galaxies classified as irregular are chosen to be similar in morphology to low surface brightness and Magellanic irregular galaxies in the local universe; their irregular light distributions appear to the eye to result from stochastic variations and bursts in their star formation history rather than from any interaction. In contrast, the peculiar/clearly interacting designation requires that galaxies have signs of tidal features and/or multiple nuclei, with morphologies suggestive of a major galaxy merger or merger remnant666In many works galaxies that do not fit onto the Hubble sequence are labeled irregular, where no attempt is made to characterize the driver of the irregularities. Because we wish to gain insight into the role of interactions in driving the star formation activity of galaxies, we attempt, perhaps naively, to distinguish between galaxies with clear signs of interaction (Pec/Int) and those without (Irr).. These classifications are discussed in detail and examples of each class shown in Wolf et al. (2005).
Obviously, these classifications are subjective and depend on the depth of the imaging material. In particular, comparison with deeper GOODS data for a subset of 290 galaxies in this redshift slice has shown that the fraction of faint clearly interacting galaxies in GEMS is slightly underestimated (Wolf et al., 2005). While the ideal solution would be to simply consider only the GOODS data, number statistics is a key limitation: there are galaxies at in the GOODS area that are detected at 24µm, compared to the galaxies detected in the whole GEMS area. We therefore choose to study galaxies from the whole GEMS area, adjusting the GEMS-only classifications as a function of IR luminosity to account for the underestimated faint interaction fraction. We address this topic, and the scatter among the three different classifiers where relevant in §5 and Appendix B.
2.3 Cross-correlation of the IR and optical data
At this stage, we have simply correlated the 24µm imaging catalog with the COMBO-17 catalog. The 24µm footprint does not exactly match that of COMBO-17; of the 1727 COMBO-17 galaxies in our redshift slice, 1436 are covered by the 24µm data. A subsample of 1306 of these are covered by the GEMS mosaic, and have full morphological, 24µm and redshift information. Sources are matched within 2″. Roughly 96% of 24µm sources have only one match in the COMBO-17 catalog. The other 4% have two matches in the COMBO-17 catalog; the closest positional match is taken in these cases777This effect may lead to 1–2% incompleteness if two sources with 24µm emission are mistakenly blended into one source. A 24µm catalog constructed using optical positions as prior constraints would address many of these limitations, but is challenging to implement at this stage; we defer a complete analysis of this type to a later date. In total, 442 galaxies with are detected at 24µm and have a match in COMBO-17 (397 overlap with GEMS); the rest of the COMBO-17 sources without 24µm detections are assigned upper limits of 83Jy888Sources near the map edges where the noise is non-uniform have been disregarded in this work.. In appendix A we explore the possibility that our sample selection may be biased against highly-obscured IR-luminous galaxies. We find that IR-luminous galaxies should be bright enough to be detected and successfully classified by COMBO-17, suggesting that the sample selection and main conclusions of this paper should be robust to this potential source of incompleteness.
3 Analysis
3.1 Estimating total IR luminosity
Local IR-luminous galaxies show a tight correlation between rest-frame 12–15µm luminosity and total IR luminosity (e.g., Spinoglio et al., 1995; Chary & Elbaz, 2001; Roussel et al., 2001; Papovich & Bell, 2002), with a scatter of dex. Following Papovich & Bell (2002), we use this correlation to construct total IR luminosity from the observed-frame 24µm data (corresponding to rest-frame µm). We use the full range of Dale et al. (2001) model template spectra to calculate the conversion from observed-frame 24µm to 8–1000µm total IR luminosity999Total 8–1000µm IR luminosities are dex higher than the 42.5–122.5µm luminosities defined by Helou et al. (1988), with an obvious dust temperature dependence. ; we adopt the mean value as our estimate of IR luminosity and the RMS as our estimate of conversion uncertainty. The mean correction factor corresponds approximately to (24µm) to within 20% where (24µm) is the monochromatic luminosity at observed-frame 24µm; the template scatter around this mean is larger, dex. Different choices of template (e.g., Devriendt et al., 1999), or the adoption of a luminosity-dependent conversion yield similar results. The detection limit of 83Jy corresponds to limiting IR luminosity of or in terms of an IR-derived SFR.
The conversion from the 24µm photometry to µm IR luminosity should be accurate a factor of two or better, which is adequate for our purposes. There are two types of error. First, the conversion depends on fitting templates to the galaxy SEDs. There is a total range of a factor of two difference between the conversion that would be predicted by various templates for galaxies in the appropriate luminosity range of (Devriendt et al., 1999; Dale et al., 2001; Chary & Elbaz, 2001; Lagache, Dole, & Puget, 2003; Lagache et al., 2004). Second, there is a possibility that the infrared properties of typical high-luminosity galaxies differ at z 0.7 from those of the local galaxies used in developing the templates. The evidence available to us now suggests that the IR SEDs of seem to be adequately spanned by the IR SEDs of local galaxies: the evolution of the MIR–radio correlation to (Elbaz et al., 2002; Appleton et al., 2004, e.g.,), 15–24µm flux ratios from ISO and Spitzer for galaxies at (Elbaz et al., 2005), and mid-IR spectra from Spitzer of ULIRGs (L. Yan, private communication). This issue will be significantly clarified by future work from Spitzer and Herschel.
3.2 Estimating star formation rates
We estimate SFRs using the combined UV and IR emission of the sample galaxies. This SFR estimator accounts for both direct light from young stars from the UV and obscured light from the IR, giving a complete census of the bolometric luminosity of young stars in the galaxy (e.g., Gordon et al., 2000). The primary difficulties affecting this SFR estimator are (1) the poorly-constrained fraction of IR light from dust heated by old stars, and (2) geometry, in the sense that the IR light is radiated isotropically, whereas the UV light escapes along preferred directions (such as out of the plane of a disk galaxy). Future works will be able to address point (1) through more detailed modeling of UV/optical/IR SEDs, and will be able to ascertain to which extent averaging over inclination angles effectively addresses point (2).
In practice, we estimate the SFR using a calibration derived from the PEGASE stellar population models (see Fioc & Rocca-Volmerange, 1997, for a description of an earlier version of the model), assuming a 100 Myr-old stellar population with constant SFR and a Kroupa (2001) IMF:
| (1) |
where is the total IR luminosity and is a rough estimate of the total integrated 1216Å–3000Å UV luminosity, derived using the 2800Å rest-frame luminosity from COMBO-17. The factor of 1.5 in the 2800Å-to-total UV conversion accounts for the UV spectral shape of a 100 Myr-old population with constant SFR. The SFR is derived assuming that reflects the bolometric luminosity of young, completely obscured populations, and that reflects the contribution of unobscured stars, that must be multiplied by a factor of 2.2 to account for light emitted longwards of 3000Å and shortwards of 1216Å by the unobscured young stars. In practice, the SFRs are dominated by the IR contribution for the range of SFRs explored in this paper. This SFR calibration is derived under identical assumptions as the UV and IR SFR calibrations presented by Kennicutt (1998). Our SFR calibration is consistent with Kennicutt (1998) to better than 30% once different IMFs are accounted for. Bell (2003) tested UVIR-derived SFRs against carefully extinction-corrected H and radio-derived SFRs for a large sample of local star-forming galaxies, finding excellent agreement with 0.3 dex scatter and no offset. Accordingly, we adopt a systematic error estimate of 0.3 dex (dominated by 24µm-to-total conversion error) and 0.4 dex random error (with contributions from both 24µm-to-total conversion and limitations in UVIR-derived SFRs). These error estimates are supported by comparisons between ISO 15µm-derived SFRs with carefully-constructed Balmer-line SFRs for galaxies at : there was no offset between the SFR scales and 0.4 dex random scatter for SFRs less than 250 (Flores et al., 2004).
3.3 Estimating stellar mass
To understand how the instantaneous SFR in a galaxy compares with its mean past rate, it is necessary to estimate the existing stellar mass. Under the assumption of a universally-applicable stellar IMF there is a tight correlation between rest-frame optical color and stellar M/L, that is rather insensitive to details of galaxy SFH, dust content and metallicity (e.g., Bell & de Jong, 2001; Bell et al., 2003; Kauffmann et al., 2003). Based on this correlation, we estimate stellar mass using the rest-frame and band magnitudes:
| (2) |
where the dex term converts the stellar masses to a Kroupa (2001) IMF101010More sophisticated stellar mass estimates, based on direct modeling of COMBO-17’s observed 17-passband SED (Borch et al., in preparation), agree with these color-based estimates with no systematic offset and % random scatter.. Systematic and random errors in stellar masses are roughly 0.3 dex, owing primarily to the effects of dust, galaxy age and bursts of star formation (Bell & de Jong, 2001; Bell et al., 2003; Franceschini et al., 2003). For stellar populations completely dominated by Gyr-old stars, the luminosity at a given color is roughly a factor of three higher than for galaxies with a wider range of stellar ages. Because Eqn. 2 assumes a wide range in stellar age, the stellar masses of galaxies with recent very large bursts of star formation will be overestimated.
4 Trends in IR-to-UV ratio with SFR

The comparison of UV and IR luminosities shows that, both on a galaxy-to-galaxy basis and globally, the SFR estimates discussed below are essentially IR-derived, with a minor 30% contribution from the UV. To assess the relative importance of UV and IR light in individual galaxies at , Fig. 1 shows IR/UV as a function of SFR, as derived from the IR and UV luminosities using Eqn. 1. The range of IR/UV and the trend with total luminosity in the z 0.7 sample is very similar to that observed in the local Universe (e.g., Wang & Heckman, 1996; Adelberger & Steidel, 2000; Bell, 2003), indicating little or no evolution in the relative proportion of obscured star formation at least to 111111This is also consistent with a sample of very luminous IR-luminous starbursts from a 15µm-selected ISO sample (Aussel et al., 1999, as discussed by Adelberger & Steidel).. This is illustrated in Fig. 1, where the locus of local star-forming galaxies is also shown121212 This has been adapted from their Fig. 11a, where , accounting for our adoption of km s-1 Mpc-1. The UV luminosity is estimated by (derived using PEGASE for a 100Myr-old stellar population with constant SFR; coincidentally, the UV spectral shape cancels out, leaving 1216Å–3000Å luminosity equal to monochromatic 1600Å luminosity). These estimates of SFR and IR/UV should be consistent with our estimates, to within the considerable systematic uncertainties. . Galaxies with SFRs yr-1 have IR/UV 10, indicating that uncorrected UV SFRs are gross underestimates of the true SFR for the most intensely star-forming systems.
The cumulated total IR luminosity of all detected sources in this redshift slice is , where the error bar is dominated by our assumed error in 24m to total IR conversion131313This is the total luminosity in the volume-limited sample, and so is in essence a luminosity density. We choose to express quantities in terms of total luminosities at this time owing to concerns about cosmic variance. This topic is considered in more detail by Le Floc’h et al. (in preparation).. If we assign detections at 83Jy to all the upper limits, we derive an upper limit to the total IR luminosity of twice the value from the detected galaxies. This result agrees with the number counts and our current IR luminosity function estimates, which indicate that about 2/3 of the total background at 24m is resolved at our detection limit (Papovich et al., 2004, Le Floc’h et al., in preparation). We conclude that the total IR luminosity in this redshift slice is . In comparison, the total UV luminosity in this redshift slice is when the luminosity function is extrapolated to zero luminosity (using the 2800Å luminosity function determined for this redshift slice by Wolf et al., 2005)141414It is worth noting that there is a difference in how we define luminosity densities, compared with Wolf et al. (2003) and Wolf et al. (2005). These papers express luminosity densities in terms of monochromatic solar luminosities at a given rest-frame wavelength, whereas we choose to present in terms of bolometric solar luminosities.. Thus, at , the ratio of IR to UV luminosity density is .
5 Exploring the relationship between star formation rate and morphology
In this section, we explore which types of galaxies account for the bulk of star formation in the universe, when the universe was only half of its present age.
5.1 The relationship between optical properties and star formation
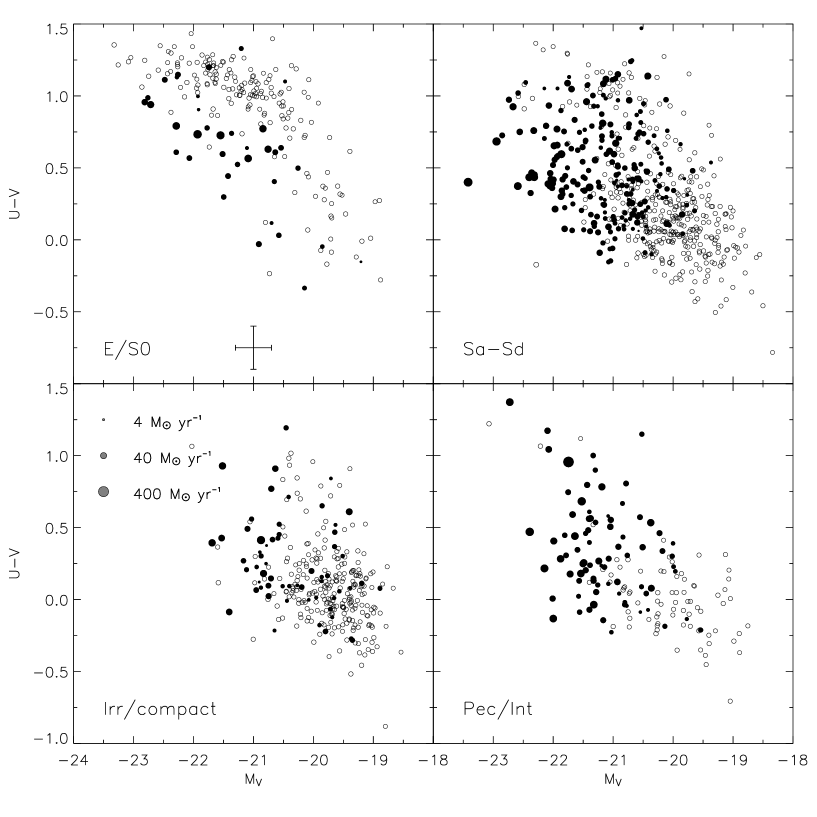
In Fig. 2, we show the rest-frame optical color and -band absolute magnitude of all galaxies in the slice, split by visual morphological type. Filled symbols denote galaxies detected at 24µm while open symbols denote galaxies for which only 24µm upper limits (83Jy) were available. In both cases, symbol size scales with the logarithm of SFR or its upper limit.
Among visually-classified E/S0 galaxies, those that are blue in the optical are also clearly detected at 24µm. Ignoring for the moment active nuclei (see §7), we attribute this 24µm flux to rapid star formation. In contrast, there are very few galaxies on the red sequence with 24µm detections. Thus, red E/S0 galaxies are IR-faint, which suggests that their red optical colors are the result of dominant old stellar populations, not dust-obscured star formation.
Blue visually-classified spiral galaxies (Sa–Sd) are frequently detected in the IR. Many optically-red spiral galaxies are IR-faint, and are thus red because of their ancient stellar populations. Yet, a rather higher fraction of red spirals are detected at 24µm compared to red E/S0 galaxies, especially at fainter optical luminosities, indicating a more important role for dust-reddened spiral galaxies. Morphologically-classified irregular galaxies are typically somewhat less luminous, and owing to their lower SFRs are less frequently detected by MIPS; however, they are qualitatively similar to low-luminosity spirals.
The vast majority of visually-classified peculiar and clearly interacting galaxies are detected at 24µm; indeed, the few non-detections are almost all relatively faint and are not expected to be detected at 24µm for plausible UV/IR ratios. Interestingly, most red Pec/Int galaxies are strong 24µm sources (including the brightest galaxy at 24µm in the slice, which is an interacting galaxy on the blue edge of the red sequence). Therefore, we conclude that i) almost all of our visually-classified Int/Pec galaxies are intensely star-forming at the epoch of observation, and ii) that the optical colors of Int/Pec galaxies largely reflect their dust content, rather than their SFH.
In summary, the optical color of morphologically-undisturbed galaxies (E/S0 and Sa–Sd galaxies) reflects SFH in a broad sense: most red early-type galaxies, and a significant fraction of red spiral galaxies, are non-star-forming; whereas the blue early and late-type galaxies have important amounts of current star formation as probed by the IR. In contrast, clearly interacting and peculiar galaxies have strong IR-luminous star formation irrespective of their optical properties (as is expected of very dusty star-forming systems).
5.2 The contribution of different galaxy types to the cosmic SFR
An important question is the relative contribution of galaxies with different morphological types to the total SFR density at . The cosmic-averaged SFR has dropped by a factor of three since as measured in the IR (e.g., Flores et al., 1999; Pozzi et al., 2004), radio (e.g., Haarsma et al., 2000), H (e.g., Tresse et al., 2002; Pérez-González et al., 2003), or UV (e.g., Lilly et al., 1996; Schiminovich et al., 2005). Thus, an understanding of the relative contribution of different galaxy types to the cosmic SFR at will constrain the types of galaxy that need to ‘switch off’ their star formation activity between and the present day, giving insight into the physical mechanisms driving this evolution.
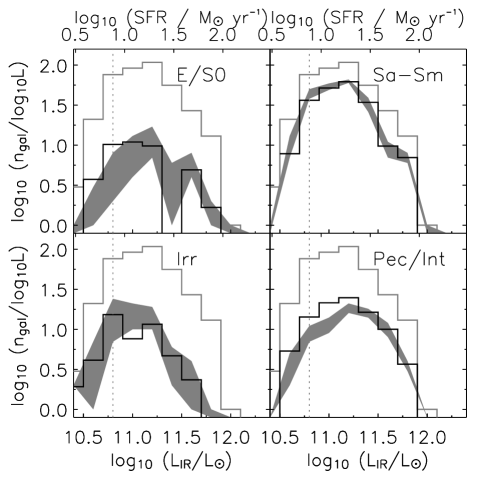
In Fig. 3, we show the distribution of estimated IR luminosity as a function of galaxy type for 24µm-detected galaxies at ; the top axes show the equivalent SFRs. We choose not to normalize the luminosity function to the observed volume at this stage owing to concerns about cosmic variance (e.g., Somerville et al., 2004); a thorough analysis of evolution in the IR luminosity function is presented in a companion paper by Le Floc’h et al. (in preparation). We do not extrapolate the IR luminosity function below the 24µm detection limit at .
The IR luminosity density for is dominated by spiral galaxies, with an important contribution from clearly interacting galaxies. Morphologically-classified E/S0 galaxies and irregulars contribute, but play lesser roles. Clearly interacting galaxies make an increasingly important contribution at . This behavior resembles that in the local universe, where almost all galaxies with show clear signs of interaction (Sanders & Mirabel, 1996). Integrating over the whole distribution of galaxies detected at 24µm, we find that the fractional contributions of spiral, E/S0, Pec/Int and irregular galaxies to the total integrated IR luminosity density are 0.51 : 0.10 : 0.28 : 0.11.
To probe the uncertainties in the relative contributions to the SFR density from different galaxy types, we explore two limiting cases: (1) all 24µm non-detections have no IR flux (i.e., their SFR is measured purely from the UV); or (2) all 24µm non-detections emit at the detection upper limit at this wavelength of 83Jy. In the first case, the split of SFR is (Spiral : E/S0 : Pec/Int : Irr) 0.51 : 0.10 : 0.26 : 0.13, very similar to the split in terms of observed IR flux (because the UV is a relatively small contribution to the total SFR density). In the second case, where limits are all taken to be marginal detections, the split is 0.47 : 0.15 : 0.18 : 0.20. Because of the preponderance of E/S0 and Irr non-detections, the relative importance of these classes is increased (arguably, rather artificially). In neither of these cases are the contributions from optically-faint galaxies (i.e., those galaxies fainter than ) accounted for. Because the integral over a luminosity function is dominated by galaxies, our limitation to relatively bright sources does not prevent us from qualitatively constraining the contribution of different galaxy types. Nonetheless, it is clear that the detailed form of the distribution of SFRs to lower limits will importantly affect the quantitative contributions of the different galaxy types, and is arguably the largest source of systematic uncertainty in this paper.
To summarize, the SFR density at is dominated by morphologically-normal spiral, E/S0, and irregular galaxies (%). Clearly interacting galaxies account for 30%. Our result is based on a combination of UV and IR luminosities, but is dominated by IR-luminous objects. Wolf et al. (2005) have examined the UV-luminous objects alone and also find that most of the rest-frame UV flux density at is in morphologically-undisturbed galaxies.
These results have important implications for the physical mechanisms which drive the factor-of-three decline in cosmic-averaged comoving SFR density from to the present day. Because clearly interacting galaxies — with morphologies suggestive of major galaxy mergers or merger remnants151515It is worth noting that relatively advanced merger remnants are also classified as clear interactions, until their tidal features have dissipated. Owing to the long dynamical times at large galactic radii, we expect that major mergers are classified as clearly interacting well after the major final burst of star formation has ceased. — contribute much less than half of the SFR density, the drastic decline in cosmic SFR is only partially driven by the decreasing frequency of major galaxy mergers at the present day (e.g., Le Fèvre et al., 2000; Patton et al., 2002). Instead, the dominant driver is a strong decrease in SFR in morphologically-undisturbed spiral galaxies. It is possible that the decreasing star-formation activity of spiral galaxies is driven primarily by gas supply and consumption in a purely quiescent mode of star formation. However, it is also possible that even in spiral galaxies much star-formation activity is triggered by relatively minor tidal interactions, that function to trigger internal instabilities such as spiral arms or bars, enhancing their SFR. Our observations cannot sensitively test these competing hypotheses at this stage: deeper redshift surveys and exploration of their gas content through, e.g., CO mass determination from the Atacama Large Millimeter Array will start to allow us to test the relative importance of these physical processes.
6 Exploring the demise of star formation in massive galaxies
We turn now to explore the relationship between SFR and stellar mass at , comparing it to . We choose to explore the ‘specific SFR’; i.e., the SFR per unit stellar mass. This is closely related to the more model-dependent birthrate parameter, , where is the past-averaged SFR. The past-averaged SFR is estimated by dividing the stellar mass by the elapsed time since star formation began in a given galaxy (see, e.g., Kennicutt, Tamblyn, & Congdon, 1994), adjusting for the mass lost by the stellar population as it ages. Roughly 50% of initially-formed stellar mass is lost within one billion years for a Kroupa (2001) IMF; therefore . In estimating , we simplistically assume the epoch of first star formation is at for all galaxies; using a present-day age of the Universe of 13.5 Gyr, this corresponds to Gyr at and Gyr at . Despite the extra model dependence introduced by having to assume a timescale when deriving , birthrate has the attractive feature that it compares the observed SFR with the SFR required to build up the existing stellar mass within a Hubble time (at that epoch).
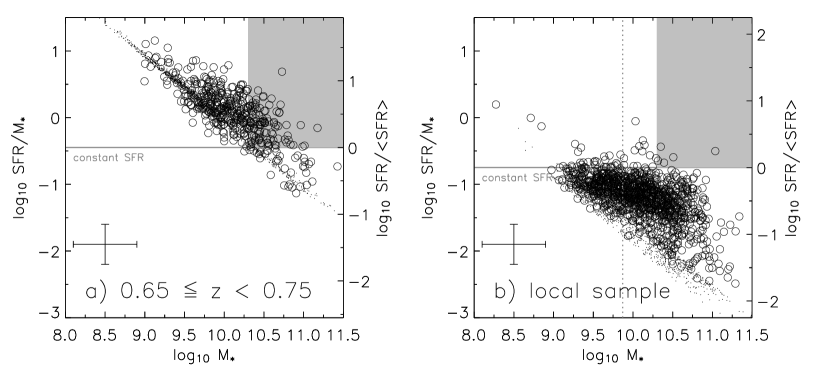
In panel a) of Fig. 4, we show specific SFR as a function of stellar mass for the 1436 galaxies in our sample. Owing to the detection limit of the 24µm observations, it is impossible to detect galaxies forming stars at anything less than a constant rate (SFR/, or equivalently ) for stellar masses less than . Yet, despite this rather stringent limitation, large numbers of galaxies have been detected at 24µm, with typical specific SFRs of 1/Gyr (i.e., if the current SFR were to continue at its present rate the stellar mass of the galaxy would double within 2 Gyr, remembering that 50% of the mass initially in stars is returned to the gas phase by stellar winds and supernovae).
Given the existence of an important population of intensely star-forming galaxies at , it is instructive to explore how this compares with the properties of star-forming galaxies in the local universe. We have therefore constructed a local ‘control’ sample of galaxies, which we show in panel b) of Fig. 4. We use the NASA/IPAC Extragalactic Database (NED) to select a pseudo volume-limited sample in the range with 2MASS -band magnitude cut , and galactic latitude . This sample is complete for galaxies above . Where they were defined, IR fluxes were taken also from NED; total 8–1000µm IR fluxes were estimated following Appendix A of Bell (2003), and are accurate to %. Upper limits on IR flux were roughly estimated assuming total IR fluxes just at the IRAS detection limit of (the conclusions do not depend on the choice of this limiting flux). A legitimate and unavoidable concern is the inhomogeneous completeness properties of NED redshifts. For the purposes of volume estimation, we estimate an overall NED redshift completeness from the number of , galaxies with redshifts divided by the number of , galaxies both with and without redshifts: 14350/23658 (or 61%). Thus, the estimated total volume probed is Mpc3. The total sample is 2177 galaxies, 1089 with IR detections and 1088 with only IR upper limits. In fact, because of large-scale overdensities in this volume, there are times more galaxies in this volume than one would expect on the basis of, e.g., the stellar mass functions or -band luminosity functions of Cole et al. (2001) or Bell et al. (2003), taking into account all the relevant selection limits. To reflect this overdensity, we assign an ‘effective volume’ to the sample of Mpc3; this ‘effective volume’ matches the actual volume in the slice. Accordingly, we use this control sample unaltered, with the rationale that in the two panels of Fig. 4 we are comparing galaxies from the same effective volumes at both cosmic epochs. None of our conclusions are affected by the detailed choice of volume or, indeed, comparison sample. Different NED-derived samples can be chosen, or a sample of GEMS/MIPS galaxies with redshifts can be used as a control, with unchanged results but a reduced number of comparison galaxies.
Stellar masses and SFRs for the local comparison sample were estimated assuming a Kroupa IMF. Stellar masses were estimated directly from the -band absolute magnitudes (where Hubble-flow distances are used, for simplicity) assuming a single -band stellar M/L of 0.6 in solar units, appropriate for a Kroupa IMF (following Bell et al., 2003; Cole et al., 2001). SFRs were estimated from total IR flux following equation 4 of Bell (2003) adjusted to a Kroupa IMF, and are not corrected for any (typically modest; %) contribution to the dust heating from old stellar populations (like the SFR estimates constructed using the 24µm data). The stellar masses and SFR estimates are accurate to dex, assuming a universally-applicable stellar IMF, and are directly comparable with stellar masses and SFRs for the redshift slice.
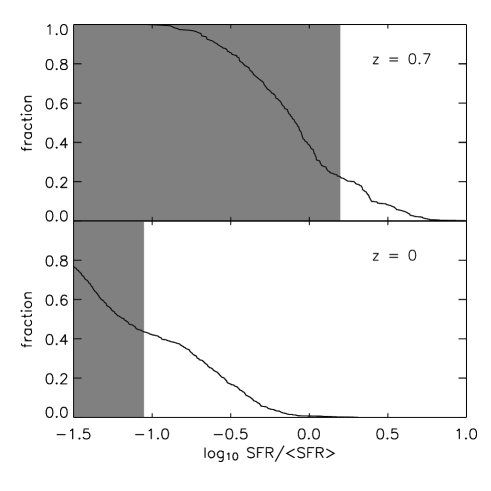
We compare the distribution of specific SFRs and stellar masses in the sample and the local control sample in Fig. 4; the cumulative histogram of birthrates is given in Fig. 5. Both datasets effectively sample Mpc3, therefore in the regions where both datasets are complete it is fair to compare the relative distributions of datapoints. The local sample is characterized by a broad distribution of star-forming galaxies with specific SFRs between 0.03 and 0.2 (; i.e., slowly declining SFR through cosmic history). Furthermore, where the detection limits permit, one observes a sizeable population of galaxies with very low specific SFRs , indicative of a largely non-star-forming subpopulation of (primarily early-type) galaxies. There are very few galaxies with bursts of star formation that are adding significantly to their existing stellar mass (i.e., birthrates ). In particular, at stellar masses in excess of , where the sample is essentially complete, 5/699 galaxies (%) of galaxies have (the grey shaded region)161616Galaxies with contain roughly 70% of present-day stellar mass (Bell et al., 2003).. While there are significant systematic uncertainties in both SFR and stellar mass, it is impossible to accommodate a large population of starbursting intermediate- and high-mass galaxies in the local universe. This result is insensitive to the adoption of a variety of plausible prescriptions for SFR and stellar masses, and indeed the rarity of galaxies with at is apparent from Fig. 24 of Brinchmann et al. (2004), who analyse accurate emission line-derived SFRs from the Sloan Digital Sky Survey.
In stark contrast, turning to the sample, there are a large number of massive galaxies with intense star formation. Quantitatively, at stellar masses in excess of , 120/311 (39%) of galaxies are forming stars at a rate faster than their past-averaged rate (; the grey shaded region in Fig. 4)171717If starbursts were defined by high specific SFRs instead, the difference between and the present day would be even more striking.. While there are always significant systematic uncertainties, including estimation of total IR luminosity, SFRs and stellar masses, these differences are large enough to be robust to systematic uncertainties of greater than a factor of three181818It is likely that our neglect of heating of dust by old stellar populations affects galaxies with low values preferentially, artificially inflating their estimates of SFR and therefore . From inspection of Fig. 4 this is likely to affect the most massive galaxies the most severely, and will affect the low redshift sample more acutely than the sample. Thus, if the heating of dust by old stars were accounted for by detailed SED modeling, it is likely that the conclusions would remain unchanged, or further strengthen.. In addition, where possible we have minimized the opportunities for systematic error by using IR-derived SFRs in both cases, and equivalent SFR and stellar mass calibrations. Indeed, adoption of the GEMS/MIPS sample as the ‘local’ control sample yields only 1 galaxy with out of 41 galaxies with . In this case, identical methodologies have been used for the and samples.
Recalling the conclusions reached in §5, it is worth briefly commenting on the visual morphologies of galaxies with . 70/124 massive spiral (Sa-Sd) galaxies, 4/5 massive irregular galaxies, and 18/23 Pec/Int galaxies have , i.e. are undergoing significant bursts of star formation. In contrast, only 20/138 massive E/S0 galaxies are forming stars intensely191919The total is 290 galaxies, which is lower than the COMBO-17MIPS number of 311 galaxies owing to the smaller areal coverage of GEMS.. Therefore, roughly 1/2 of spiral, irregular and clearly interacting galaxies are undergoing starbursts at . Furthermore, the starbursting population is dominated by spiral galaxies rather than Pec/Int galaxies. This reinforces the conclusions of §5; even amongst the most intensely star-forming galaxies, the vast majority are not forming stars intensely because of a recent major merger.
Taken together, it is fair to conclude that while a large fraction of intermediate- and high-mass galaxies are forming stars intensely 7 Gyr ago, almost none are at the present epoch. Furthermore, these intensely star-forming galaxies are primarily morphologically undisturbed, indicating that major mergers are not responsible for the bulk of this intense star formation. Instead, physical properties that do not strongly affect galaxy morphology — for example, a larger abundance of gas at earlier times or weak interactions with small satellite galaxies — appear to be responsible for the high SFRs.
7 Discussion
7.1 Comparison with previous results
Our results confirm and extend the previously-observed rapid evolution in the number of IR-luminous galaxies at intermediate and high redshift (e.g., Elbaz et al., 1999; Chary & Elbaz, 2001; Papovich et al., 2004), and with the drastic decline in the space density of intensely star-forming galaxies as probed with a variety of different SFR indicators (e.g., Cowie et al., 1996; Wolf et al., 2003; Bauer et al., 2005). Furthermore, we have been able to estimate the stellar masses of these intensely star-forming systems, finding that almost all of the intensely star-forming galaxies with (luminous infrared galaxies; LIRGs) seen at intermediate redshift have stellar masses in excess of (Fig. 4). This is in agreement with, e.g., Franceschini et al. (2003) and Zheng et al. (2004), who used optical and NIR data to estimate the stellar masses of ISOCAM 15µm-selected LIRGs, finding stellar masses in excess of , and Le Floc’h et al. (2004), who explore the properties of 26 IR-luminous sources with Spitzer, finding significant stellar masses for their sample of LIRGs.
Our conclusion that a decline in major interaction rate is not the primary cause of the decline in cosmic SFR since also confirms and extends previous observations. Follow-up observations of fields targeted by ISO tentatively suggested that the rapidly-evolving IR-luminous population may not be composed exclusively of strongly-interacting galaxies. Flores et al. (1999) found that only 6/16 galaxies in a sample with ISO and HST data had strongly disturbed morphologies, while the rest were disk-dominated, E/S0, or unresolved. Zheng et al. (2004) extended their work to a sample of 36 ISO-selected LIRGs at z 1.2, finding that 17% of their sample were obvious mergers, and placing an upper limit of 58% on the merger fraction. Our study places these indications on firm ground, pushing to fainter limits of with an order of magnitude larger sample of galaxies.
7.2 How much dust can be heated by AGN at ?
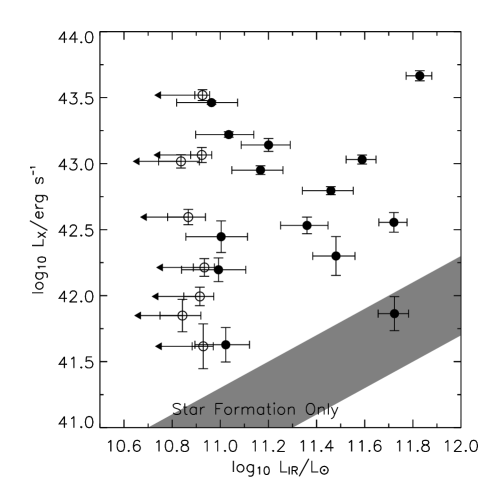
It is worth discussing the contribution of active galactic nuclei (AGN) to the 24µm total luminosity density. To aid in identifying AGN, we use the Chandra data for the CDFS to select AGN candidates. The Chandra footprint on the CDFS (Alexander et al., 2003) is considerably smaller than the GEMS and MIPS coverage of the field, therefore in this section we consider only galaxies falling completely within the Chandra coverage. This area contains 3122 galaxies with COMBO-17 photometric redshifts; the small subsample classified by COMBO-17 as galaxies with and detected by Chandra comprises 22 galaxies; 0.5–8 keV source fluxes and errors are taken from Alexander et al. (2003).
While highly-luminous X-ray sources are invariably AGN, at fainter limits a contribution from star-forming galaxies is expected. To test this possibility, we compare 24µm-derived IR luminosities and X-ray luminosities for these 22 galaxies in Fig. 6. The shaded area shows the expected locus of star-forming galaxies, derived from the empirical relationship between X-ray and -corrected 1.4GHz radio luminosities (Fig. 1 of Cohen, 2003) coupled with the radio SFR calibration of Bell et al. (2003), accounting for the 0.3 dex empirical scatter in the correlation202020This locus does not account for the mild X-ray -corrections in the observed frame 0.5–8 keV X-ray luminosity, but was defined for galaxies with with a median redshift of 0.76 and so will be accurate to dex (Cohen, 2003). It is worth noting that the use of the SFR calibration of Cohen (2003) results in a similar locus to within 0.1 dex.. It is clear that only one galaxy has X-ray emission that is consistent with a star formation origin; the others have excess X-ray emission indicative of an AGN contribution.
Considering the 21 AGN-dominated X-ray sources, we find a total IR luminosity between and , where in the first instance we ignore upper limits and in the second instance we take upper limits to represent marginal detections. The total IR luminosity in all detected sources in the Chandra footprint is , increasing to if all non-detections are taken as marginal detections at the 83Jy limit. Accordingly, we estimate that % of the total IR luminosity density is in sources with significant AGN emission. Clearly, the contribution to the IR luminosity density of AGN-heated dust may be substantially lower, as the IR luminosity in these galaxies may come from star formation. On the other hand, we have not accounted for any contribution of AGN to the IR luminosities of galaxies not detected by Chandra; bearing in mind that the Chandra observations reach deep enough to start probing star-formation-powered X-rays from galaxies with , one hopes that the AGN in non-AGN dominated galaxies will be weak and will contribute relatively little to the total IR. This conclusion is consistent with recent ISO and Spitzer results, finding 10–20% contributions at 15µm and 24µm respectively (Fadda et al., 2002; Franceschini et al., 2005), and with Silva, Maiolino, & Granato (2004) who model the AGN contribution to the IR background, suggesting that 10–20% of the IR background at mid-IR wavelengths is from AGN and their host galaxies (the AGN alone account for 5% of the IR background in this model).
7.3 Comparison with Theoretical Expectations
Gas-dynamical processes, such as star formation or feedback, are currently very challenging to include in models of galaxy formation and evolution owing largely to important resolution limitations. As a result of the complexity of these processes, it has been impossible to converge on a robust description of star formation; instead, a wide range of empirically-motivated prescriptions on kpc or larger scales have been adopted (e.g., Somerville & Primack, 1999; Springel & Hernquist, 2003a; Barnes, 2004). Current models tend to reproduce the cosmic SFH reasonably well (e.g., Cole et al., 2000; Somerville et al., 2001; Springel & Hernquist, 2003b). A few models have started to incorporate detailed dust prescriptions, and can model the evolution of IR-bright galaxies (e.g., Granato et al., 2000; Balland et al., 2003). While the progress is very encouraging, detailed observations such as the 24µm number counts are rather poorly reproduced by the models (Papovich et al., 2004), reflecting the difficulty of the ‘gastrophysics’ that must be tackled to properly reproduce the full richness of the observational datasets. For this reason, we focus in this section on qualitative features of the models, rather than a detailed comparison of IR luminosity functions, or the distribution of stellar masses and morphologies as a function of IR luminosity.
Somerville et al. (2001) present a ‘collisional starburst’ model, in which major (with mass ratios 4:1) and minor (with mass ratios between 4:1 and 10:1) mergers trigger an episode of rapid star formation, with a star formation efficiency that increases towards lower mass ratio (i.e., is higher for major mergers). At , Somerville et al. (2001) predict that 35% of star formation is triggered by minor mergers, and 2.5% of star formation is triggered by major mergers. At , 50% of star formation is triggered by minor mergers and 3.5% by major mergers. Thus, they predicted that the steep drop in the cosmic SFR since is not caused by changes in the major merger rate; however, in their model a significant part of the drop reflects a declining rate of minor mergers. There are a number of important uncertainties: a lowered star formation efficiency in minor interactions would shift more star formation into major mergers because more gas would be available to form stars in major mergers, tidal interactions (e.g., flybys) are not included in the model, untriggered star formation in a galaxy with triggered star formation is not included in the census of triggered star formation, and our observational census of ‘clearly interacting’ galaxies may well include a significant fraction of minor mergers and tidal interactions.
Nonetheless, it is encouraging that the observations and at least this model are reasonably consistent in the sense that major galaxy mergers do not drive the declining cosmic SFR from to the present day. At present, models cannot clearly predict which processes dominate: while minor mergers and tidal interactions may dominate (Somerville et al., 2001), it is also possible that a dwindling gas supply could dominate (Cole et al., 2000; Somerville et al., 2001), depending on the efficiency of triggered star formation in the real universe.
7.4 Improvements
There are a number of areas that need to be improved to more fully understand these results, and to illuminate the physics driving the cosmic SFH. We will mention a few specific examples here. A more complete, ground-based and IRAC near-IR-selected photometric and/or spectroscopic sample covering comparable or larger areas will be required to push our understanding past , into the regime where we observe rapid cosmic star formation. A wide range of morphological disturbance diagnostics must be developed and robustly tested (see, e.g., Conselice et al., 2003; Lotz, Primack, & Madau, 2004, for some promising examples of this kind of technique). Total and SFR calibrations must be tested thoroughly using IR spectral data coupled with 70µm and 160µm imaging data where available. This must be accompanied by a fuller analysis of local, well-studied control samples to explore the fraction of coming from dust heated by optical light from old stellar populations, and possible metallicity dependences in IR SEDs. The IR properties of high redshift AGN must be better constrained, including constraints on the fraction of light emitted by AGN-heated dust compared with dust heated by associated star formation in the AGN host. Yet, the two main conclusions of this paper — the rapid demise of intermediate- and high-mass star-forming galaxies between and the present-day, and the limited importance of major mergers in driving the declining cosmic SFR — are likely to hold even after these studies are completed.
8 Conclusions
In this paper, we have explored the 24µm-derived IR properties of an optically-selected sample of 1436 galaxies with in the CDFS. Optical IDs, photometric redshifts and morphologies were obtained from the COMBO-17 and GEMS surveys. From examination of local LIRGs and ULIRGs, and exploration of COMBO-17’s photometric redshift accuracy as a function of IR luminosity, we argue that the optical selection should not introduce any special bias against intensely star-forming obscured galaxies. Under the assumption that the mid-IR properties of galaxies are spanned by calibrating samples in the local universe, we have derived total IR luminosities for the 442 galaxies detected at better than at 24µm. We used these data, in conjunction with the optical data, to estimate SFRs and stellar masses.
We have found the following:
-
•
Galaxies with X-ray-luminous AGN contribute % towards the integrated IR luminosity density.
-
•
The IR-to-UV ratio is a strong, increasing, function of total SFR; this relation shows a dex scatter. There is no evidence for evolution of this relationship over the last 7 Gyr.
-
•
Morphologically-normal galaxies show a strong relationship between their optical and IR properties. Optically blue early-type and spiral galaxies are IR-bright. Optically red early-type galaxies and a significant fraction of red spiral galaxies are not detected at 24µm. Most galaxies on the red sequence are genuinely old, red and dead.
-
•
Dust strongly shapes the optical properties of morphologically-peculiar galaxies. The majority of obviously interacting galaxies are detected at the star formation-sensitive 24µm band, despite showing the full range of optical colors from very blue through to very red.
-
•
Clearly interacting galaxies with morphologies suggestive of major galaxy mergers contribute at most 30% of the integrated IR luminosity density at . Bearing in mind that there is a factor of three reduction in cosmic IR luminosity density between and the present day, this suggests that a declining major merger rate can only form a small part of this drop in cosmic SFR.
-
•
Morphologically-normal galaxies (spirals, ellipticals and Magellanic irregulars) form more than 70% of the integrated IR luminosity density in the slice. This implies that physical processes which do not strongly affect galaxy morphology, such as gas consumption and weak tidal interactions with small satellite galaxies, are likely responsible for the drastic decline in cosmic SFR since .
-
•
At , nearly 40% of intermediate- and high-mass galaxies are actively starbursting (i.e., they have and ). In contrast, only 1% of galaxies with are undergoing such active star formation. The declining SFR since is driven by drastic evolution in the SFRs of intermediate- and high-mass galaxies, rather than starbursting dwarf galaxies.
Appendix A A. Are most starbursts in the COMBO-17 sample?
A possible source of bias could be that the most heavily-obscured star-forming galaxies may be too optically faint to be reliably picked up and/or correctly classified by COMBO-17. Indeed, there are many MIPS sources without photometric redshifts () or even detections () from COMBO-17. Without a comprehensive multi-wavelength photometric redshift analysis we cannot definitively address this issue. Yet, we explore this issue briefly here to assess the potential scale of the biases, choosing to focus on two key issues: optical detectability and redshift accuracy.

One key point is that of optical brightness. In terms of affecting the total IR luminosity density or skewing the fractions of IR luminosity from each morphological type, the most IR-luminous galaxies are the most relevant; i.e., luminous (; LIRGs) and ultra-luminous (; ULIRGs) infrared galaxies. Thus, it is important to check if local ULIRGs and LIRGs would be visible if placed at . We compare the optical properties of a sample of local universe ULIRGs and LIRGs from Surace, Sanders, & Evans (2000) and Arribas et al. (2004) with the sample of Pec/Int galaxies from the slice (Fig. 7). Photometry for these galaxies was presented in and bands; we corrected these for galactic foreground extinction, and transformed them to and absolute magnitudes using the PEGASE stellar population model (if instead one assumed a very young underlying stellar population, and postulated that redder colors were due to dust alone, the transformation from to would remain unchanged to mag, owing to the strength of the age/metallicity/dust degeneracy in the optical wavelength region). In spite of their high obscurations, local ULIRGs and LIRGs are reasonably bright in the optical, and in common with Pec/Int galaxies, show a wide range in galaxy colors (primarily because of the dust obscuration). Highly-obscured IR-luminous galaxies are not faint in the optical; they are rather fainter than they would be in the absence of dust, but they are still reasonably bright, and are certainly bright enough to be easily picked up at to an -band limit of 24212121ULIRGs and LIRGs at will have ; therefore, optically-selected redshift surveys to this limit will be unable to construct unbiased samples of IR-luminous galaxies..
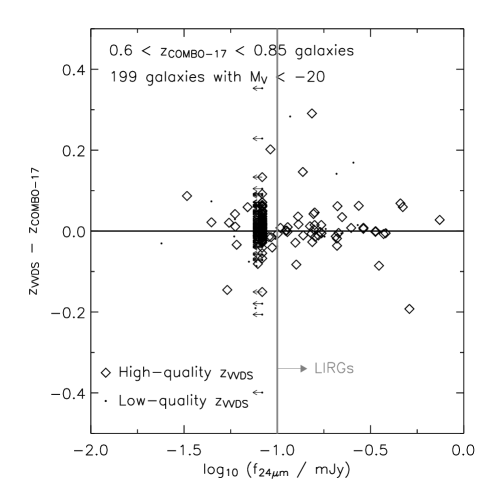
Yet, it is not clear that these dusty galaxies will be well-classified by COMBO-17’s photometric redshift classifier. COMBO-17 adopts a 2-dimensional stellar population and SMC extinction curve dust reddening grid for classification, allowing it in principle to classify galaxies with a wide diversity of stellar population properties and dust contents. In Fig. 8 we test the performance of COMBO-17’s classifier directly using redshifts from the VIMOS VLT Deep Survey (VVDS; Le Fèvre et al., 2004) as a function of the 24µm flux. To ensure a large sample, we expand the redshift range to , and we require that , as this range contains the vast majority of all MIPS detections. There are a total of 199 galaxies with VVDS redshifts with estimated photometric redshifts and rest-frame -band magnitudes in this range. Diamonds show galaxies with well-measured spectroscopic redshifts (quality flags 3/4/23/24), whereas lower-quality spectroscopic redshifts, typically with less certain line identifications, are shown as points (quality flags 1/2/9/21/22). It is clear that most galaxies have well-constrained photometric redshifts; the robust sigma of the distribution is , independent of IR luminosity. Furthermore, the fraction of LIRGs with is 5/57, or 9%, whereas the fraction of galaxies with with is 7/142, or 5%222222The worst outliers have lower quality VVDS spectroscopic redshifts; Wolf (priv. comm.) finds in a more comprehensive comparison that the VVDS spectroscopic redshifts with low confidence quality flags 1/2/9/21/22 have a % error rate, and that COMBO-17 has an overall error rate of % or less.. The RMS and outlier fraction do not strongly depend on IR luminosity.
Thus, bearing in mind that IR-luminous galaxies are reasonably bright in the optical, and that COMBO-17’s classifier appears to work equally well for IR-bright and IR-faint galaxies, we tentatively conclude that the philosophy used in this paper — exploring the IR properties of an optically-selected sample in a thin redshift slice — should not lead to any serious biases against IR-luminous, heavily obscured galaxies.
Appendix B B. A comparison of GOODS and GEMS morphologies of IR-bright galaxies
An unavoidable source of error comes from classification uncertainties. With the classifications based on the 1-orbit rest-frame -band data from GEMS, % of the SFR is in undisturbed galaxies. Yet, when one probes to fainter surface brightness levels, one will be able to better recognize tidal tails, leading to an increased fraction of interacting galaxies. To estimate the importance of this source of uncertainty, we classified a subset of 290 galaxies with deeper F850LP data from GOODS (Giavalisco et al., 2004, the GOODS southern dataset forms the central of the GEMS area, giving F850LP data with 5 longer exposure time). Overall, around twice as many galaxies appeared to be clearly interacting in the deeper dataset; the detailed increase in fraction varied from classifier to classifier. Almost all of the newly-recognized interactions were relatively faint — GEMS-depth data are insufficient to unambiguously discern the faint tidal features that are visible in the deeper GOODS data. This issue is discussed at length in Wolf et al. (2005).
Owing to small number statistics, it is impractical to simply analyze the properties of the GOODS sample alone. We therefore derive a correction to the IR luminosity function that is tuned to reproduce the systematic difference between the GOODS and GEMS classifications for the 290-galaxy subsample covered by GOODS. For each galaxy, the nearest 25 galaxies in terms of IR luminosity are selected. Then relative split of spiral : E/S0 : Irr : Pec/Int for these 25 galaxies using the GEMS classifications is derived, and is compared with the type split derived using the GOODS classifications. This process is repeated for all galaxies, eventually building up the split of galaxy types as a function of IR luminosity in GEMS and GOODS. The difference between these type splits, as a function of IR luminosity, is used to correct the GEMS type-dependent IR luminosity functions in Fig. 3 to roughly compensate for the shallower depth of GEMS compared to GOODS. The main differences between GOODS and GEMS is that GOODS-depth data shows a statistically-significant increased fraction of clear interactions at , while the fraction of irregular and spiral galaxies at these luminosities is slightly reduced to compensate.
This issue will be discussed further by Papovich et al. (in preparation).
References
- Adelberger & Steidel (2000) Adelberger, K. L., & Steidel, C. C. 2000, ApJ, 544, 218
- Alexander et al. (2003) Alexander, D. M., et al. 2003, AJ, 126, 539
- Appleton et al. (2004) Appleton, P. N., et al. 2004, ApJS, 154, 147
- Arnouts et al. (2001) Arnouts, S., et al. 2001, A&A, 379, 740
- Arribas et al. (2004) Arribas, S., Bushouse, H., Lucas, R. A., Colina, L., & Borne, K. D. 2004, AJ, 127, 2522
- Aussel et al. (1999) Aussel, H., Cesarsky, C. J., Elbaz, D., & Starck, J. L. 1999, A&A, 342, 313
- Balland et al. (2003) Balland, C., Devriendt, J. E. G., & Silk, J. 2003, MNRAS, 343, 107
- Barnes (2004) Barnes, J. E. 2004, MNRAS, 350, 798
- Barton, Geller, & Kenyon (2000) Barton, E. J., Geller, M. J., & Kenyon, S. J. 2000, ApJ, 530, 660
- Bauer et al. (2005) Bauer, A. E., Drory, N., Hill, G. J., & Feulner, G. 2005, ApJL, in press (astro-ph/0412358)
- Bell (2003) Bell, E. F. 2003, ApJ, 586, 794
- Bell & de Jong (2000) Bell, E. F., & de Jong, R. S. 2000, MNRAS, 312, 497
- Bell & de Jong (2001) Bell, E. F., & de Jong, R. S. 2001, ApJ, 550, 212
- Bell et al. (2003) Bell, E. F., McIntosh, D. H., Katz, N., & Weinberg, M. D. 2003, ApJS, 149, 289
- Bell et al. (2004) Bell, E. F., et al. 2004, ApJ, 600, L11
- Blain et al. (1999) Blain, A. W., Smail, I., Ivison, R. J., Kneib, J. P. 1999, MNRAS, 302, 632
- Brinchmann et al. (2004) Brinchmann, J., Charlot, S., White, S. D. M., Tremonti, C., Kauffmann, G., Heckman, T., & Brinkmann, J. 2004, MNRAS, 351, 1151
- Buat et al. (2002) Buat, V., Boselli, A., Gavazzi, G., & Confanti, C. 2002, A&A, 383, 810
- Chary & Elbaz (2001) Chary, R., & Elbaz, D. 2001, ApJ, 556, 562
- Cohen (2003) Cohen, J. G. 2003, ApJ, 598, 288
- Cole et al. (2000) Cole, S., Lacey, C., Baugh, C. M., & Frenk, C. S. 2000, MNRAS, 319, 168
- Cole et al. (2001) Cole, S., et al. 2001, MNRAS, 326, 255
- Condon (1992) Condon, J. J., 1992, ARA&A, 30, 575
- Conselice et al. (2003) Conselice, C. J., Bershady, M. A., Dickinson, M., & Papovich, C. 2003, AJ, 126, 1183
- Cowie et al. (1996) Cowie, L. L., Songaila, A., Hu, E. M., & Cohen, J. C. 1996, AJ, 112, 839
- Dale et al. (2001) Dale, D. A., Helou, G., Contursi, A., Silbermann, N. A., & Kolhatkar, S. 2001, ApJ, 549, 215
- Devriendt et al. (1999) Devriendt, J. E. G., Guiderdoni, B., Sadat, R. 1999, A&A, 350, 381
- Dole et al. (2004) Dole, H., et al. 2004, ApJS, 154, 93
- Elbaz et al. (1999) Elbaz, D., et al. 1999, A&A, 351, L37
- Elbaz et al. (2002) Elbaz, D., Cesarsky, C. J., Chanial. P., Aussel, H., Franceschini, A., Fadda, D., & Chary, R. R. 2002, A&A, 384, 848
- Elbaz et al. (2005) Elbaz, D., Le Floc’h, E., Dole, H., & Marcillac, D. 2005, submitted to A&A Letters
- Erb et al. (2003) Erb, D. K., Shapley, A. E., Steidel, C. C., Pettini, M., Adelberger, K. L., Hunt, M. P., Moorwood, A. F. M., & Cuby, J.-G. 2003, ApJ, 591, 101
- Fadda et al. (2002) Fadda, D., Flores, H., Hasinger, G., Franceschini, A., Altieri, B., Cesarsky, C. J., Elbaz, D., & Ferrando, Ph. 2002, A&A, 383, 838
- Fioc & Rocca-Volmerange (1997) Fioc, M., & Rocca-Volmerange, B. 1997, A&A, 326, 950
- Flores et al. (1999) Flores, H., et al. 1999, ApJ, 517, 148
- Flores et al. (2004) Flores, H., Hammer, F., Elbaz, D., Cesarsky, C. J., Liang, Y. C., Fadda, D., & Gruel N. 2004, A&A, 415, 885
- Ford et al. (2003) Ford, H., et al. 2003, SPIE, 4854, 81
- Franceschini et al. (2003) Franceschini, A., et al. 2003, A&A, 403, 501
- Franceschini et al. (2005) Franceschini, A., et al. 2005, AJ, in press (astro-ph/0412476)
- Gallego et al. (1995) Gallego, J., Zamorano, J., Aragon-Salamanca, A. & Rego, M. 1995, ApJ, 455, 1L
- Giavalisco et al. (2004) Giavalisco, M., et al. 2004, ApJ, 600, 93
- Glazebrook et al. (1999) Glazebrook, K., Blake, C., Economou, F., Lilly, S. & Colless, M. 1999, MNRAS, 306, 843
- Gordon et al. (2000) Gordon, K. D., Clayton, G. C., Witt, A. N., Misselt, K. A. 2000, ApJ, 533, 236
- Gordon et al. (2005) Gordon, K. D., et al. 2005, submitted to PASP
- Granato et al. (2000) Granato, G. L., Lacey, C. G., Silva, L., Bressan, A., Baugh, C. M., Cole, S., & Frenk, C. S. 2000, ApJ, 542, 710
- Haarsma et al. (2000) Haarsma, D. B., Partridge, R. B., Windhorst, R. A., & Richards, E. A. 2000, ApJ, 544, 641
- Helou et al. (1988) Helou, G., Khan, I. R., Malek, L., Boemher, L. 1988, ApJS, 68, 151
- Hippelein et al. (2003) Hippelein, H., et al. 2003, A&A, 402, 65
- Hogg et al. (1998) Hogg, D. W., Cohen, J. G., Blandford, R., & Pahre, M. A. 1998, ApJ, 504, 622
- Hopkins (2004) Hopkins, A. M., 2004, ApJ, 615, 209
- Kauffmann et al. (2003) Kauffmann, G., et al. 2003, MNRAS, 341, 54
- Kennicutt (1998) Kennicutt Jr., R. C. 1998, ARA&A, 36, 189
- Kennicutt, Tamblyn, & Congdon (1994) Kennicutt Jr., R. C., Tamblyn, P., Congdon, C. E. 1994, ApJ, 435, 22
- Kroupa (2001) Kroupa, P. 2001, MNRAS, 322, 231
- Lagache, Dole, & Puget (2003) Lagache, G., Dole, H., Puget, J.-L. 2003, MNRAS, 338, 555
- Lagache et al. (2004) Lagache, G., et al. 2004, ApJS, 154, 112
- Le Fèvre et al. (2000) Le Fèvre, O., et al. 2000, MNRAS, 311, L565
- Le Fèvre et al. (2004) Le Fèvre, O., et al. 2004, A&A, 428, 1043
- Le Floc’h et al. (2004) Le Floc’h, E., et al. 2004, ApJS, 154, 170
- Lilly et al. (1996) Lilly, S. J., Le Fèvre, O., Hammer, F., Crampton, D. 1996, ApJ, 460, L1
- Lotz, Primack, & Madau (2004) Lotz, J. M., Primack, J., & Madau, P. 2004, AJ, 128, 163
- Madau et al. (1996) Madau, P., Ferguson, H. C., Dickinson, M. E., Giavalisco, M., Steidel, C. C., & Fruchter, A. 1996, MNRAS, 283, 1388
- Madau, Pozzetti, & Dickinson (1998) Madau, P., Pozzetti, L., & Dickinson, M. 1998, ApJ, 498, 106
- Mann et al. (2002) Mann, R. G., et al. 2002, MNRAS, 332, 549
- Misiriotis et al. (2001) Misiriotis, A., Popescu, C. C., Tuffs, R., Kylafis, N. D. 2001, A&A, 372, 775
- Papovich & Bell (2002) Papovich, C., & Bell, E. F. 2002, ApJ, 579, L1
- Papovich et al. (2004) Papovich, C., et al. 2004, ApJS, 154, 70
- Patton et al. (2002) Patton, D. R., et al. 2002, ApJ, 565, 208
- Pérez-González et al. (2003) Pérez-González, P. G., Zamorano, J., Gallego, J., Aragón-Salamanca, A., & Gil de Paz, A. 2003, ApJ, 591, 827
- Pozzi et al. (2004) Pozzi, F., et al. 2004, ApJ, 609, 122
- Rieke et al. (2004) Rieke, G. H., et al. 2004, ApJS, 154, 25
- Rigby et al. (2004) Rigby, J. R., et al. 2004, ApJS, 154, 160
- Rix et al. (2004) Rix, H.-W., et al. 2004, ApJS, 152, 163
- Roussel et al. (2001) Roussel, H., Sauvage, M., Vigroux, L., & Bosma, A. 2001, A&A, 372, 427
- Sanders & Mirabel (1996) Sanders, D. B., & Mirabel, I. F. 1996, ARA&A, 34, 749
- Schiminovich et al. (2005) Schiminovich, D., et al. 2005, ApJ, 619, L47
- Silva, Maiolino, & Granato (2004) Silva, L., Maiolino, R., & Granato, G. L. 2004, MNRAS, 355, 973
- Somerville & Primack (1999) Somerville, R. S., & Primack, J. R. 1999, MNRAS, 310, 1087
- Somerville et al. (2001) Somerville, R. S., Primack, J. R., & Faber, S. M. 2001, MNRAS, 320, 504
- Somerville et al. (2004) Somerville, R. S., Lee, K., Ferguson, H. C., Gardner, J. P., Moustakas, L. A., & Giavalisco, M. 2004, ApJ, 600, L171
- Spergel et al. (2003) Spergel, D. N., et al. 2003, ApJS, 148, 175
- Spinoglio et al. (1995) Spinoglio, L., Malkan, M. A., Rush, B., Carrasco, L., & Recillas-Cruz, E. 1995, ApJ, 453, 616
- Springel & Hernquist (2003a) Springel, V., & Hernquist, L. 2003a, MNRAS, 339, 289
- Springel & Hernquist (2003b) Springel, V., & Hernquist, L. 2003b, MNRAS, 339, 312
- Steidel et al. (1999) Steidel, C. C., Adelberger, K. L., Giavalisco, M., Dickinson, M., & Pettini, M. 1999, ApJ, 519, 1
- Surace, Sanders, & Evans (2000) Surace, J. A., Sanders, D. B., & Evans, A. S. 2000, ApJ, 529 170
- Tresse et al. (2002) Tresse, L., Maddox, S. J., Le Févre, O., Cuby, J.-G. 2002, MNRAS, 337, 369
- Wang & Heckman (1996) Wang, B., Heckman, T. M., 1996, ApJ, 457, 645
- Wolf et al. (2003) Wolf, C., Meisenheimer, K., Rix, H.-W., Borch, A., Dye, S., & Kleinheinrich, M. 2003, A&A, 401, 73
- Wolf et al. (2004a) Wolf, C., et al. 2004a, A&A, 421, 913
- Wolf et al. (2005) Wolf, C., et al. 2005, submitted to ApJ (astro-ph/0408289)
- Yan et al. (1999) Yan, L., McCarthy, P. J., Freudling, W., Teplitz, H. I., Malmuth, E. M., Weymann, R. J., & Malkan, M. A. 1999, ApJ, 519, L47
- Zheng et al. (2004) Zheng, X. Z., Hammer, F., Flores, H., Assémat, F., & Pelat, D. 2004, A&A, 421, 847