Upper limits to the SN1006 multi-TeV gamma-ray flux from H.E.S.S. observations
Observations of the shell-type supernova remnant SN1006 have been carried out with the H.E.S.S. system of Cherenkov telescopes during 2003 (18.2h with two operating telescopes) and 2004 (6.3h with all four telescopes). No evidence for TeV -ray emission from any compact or extended region associated with the remnant is seen and resulting upper limits at the 99.9% confidence level are up to a factor 10 lower than previously-published fluxes from CANGAROO. For SN1006 at its current epoch of evolution we give limits for a number of important global parameters. Upper limits on the -ray luminosity (for =0.26 to 10 TeV, distance =2 kpc) of erg s-1, and the total energy in corresponding accelerated protons, erg (for proton energies to 60 TeV and assuming the lowest value cm-3 of the ambient target density discussed in literature) are estimated. Extending this estimate to cover the range of proton energies observed in the cosmic ray spectrum up to the knee (we take here 1 GeV to 3 PeV, assuming a differential particle index 2) gives erg. A lower limit on the post-shock magnetic field of G results when considering the synchrotron/inverse-Compton framework for the observed X-ray flux and -ray upper limits.
Key Words.:
Gamma rays: observations -Gavin.Rowell@mpi-hd.mpg.de
1 Introduction
Observations of shell-type supernova remnants (SNR) at multi-GeV to TeV -ray energies have long been motivated by the idea that they are the prime source of hadronic cosmic-ray (CR) acceleration in our galaxy (see for example Drury, Aharonian & Völk Drury:1 (1994) and Naito & Takahara Naito:1 (1994)). The detection of non-thermal X-ray emission from the young shell-type SNR SN1006 (Koyama et al. Koyama:1 (1995), Allen et al. Allen:1 (2001)) suggests that SN1006 is a site of electron acceleration to multi-TeV energies. Subsequent arc-second resolution results from Chandra (Long et al. Long:1 (2003), Bamba et al. Bamba:1 (2003)) reveal the presence of several bright non-thermal X-ray arcs concentrating in the NE and SW regions of the SNR, which likely trace the location of strong shocks where at least electrons are accelerated. These, and similar X-ray results from a number of other SNR over the past ten years, have provided a priority list of such targets for ground-based -ray telescopes. The results of CANGAROO-I (Tanimori et al. Tanimori:1 (1998)), suggesting TeV -ray emission from the NE rim of SN1006 supported the notion that this SNR is capable of electron acceleration up to energies TeV, when interpreted in the synchrotron/inverse-Compton (IC) framework. The TeV photon spectrum is compatible with a power law of photon index 2.3 (for ) in the energy range 1.5 to 20 TeV (Naito et al. Naito:2 (1999), Tanimori et al. Tanimori:2 (2001)). Later data from the CANGAROO-II 10 metre telescope also revealed SN1006 as an emitter of TeV -rays (Hara et al. Hara:1 (2001)), yielding a compatible energy spectrum. The stand-alone HEGRA CT1 telescope has also reported a significant excess in observations taken at very large zenith angles and therefore at a high energy threshold TeV (Vitale et al. Vitale:1 (2003)).
The interpretation of these X-ray and ground-based -ray results generally involves the electronic synchrotron/IC and/or hadronic -decay channels. Either channel can dominate, depending on, for example, the density of ambient matter and magnetic field strength . Detailed sampling of the -ray spectra and morphology are required to disentangle the electronic and hadronic components. The H.E.S.S. (High Energy Stereoscopic System) experiment, the first of the next-generation ground-based -ray detectors to utilise the stereoscopic technique, has observed SN1006 during 2003 and 2004. The prime motivation of these observations, apart from confirmation of the CANGAROO results, has been to determine the nature of any 100 GeV to TeV -ray emission from SN1006.
Operating in the Southern Hemisphere, the H.E.S.S. experiment consists of four identical Cherenkov telescopes each with mirror area 107 m2 (Bernlöhr et al. Bern:1 (2003), Cornils et al. Cornils:1 (2003), Vincent et al. Vincent:1 (2003)). All four telescopes have been operating since December 2003. Here, we present results using H.E.S.S. data taken during 2003 (two telescopes operating in stereo but with considerable dead time of 50% due to the lack of a central trigger system Funk:1 (2004)). The four-telescope mode of 2004 with the central trigger is the most sensitive configuration for H.E.S.S. We update here previous results of Masterson et al. (Masterson:1 (2003)) which utilised a part of the 2003 dataset analysed without stereoscopic reconstruction (i.e. mono-mode). The large field of view (FoV diameter) of H.E.S.S. easily encompasses the SN1006 shell, and the angular resolution of attained (event-by-event) permits a search for -ray sources from different regions associated with the SNR.
2 Analysis & Results
H.E.S.S. observation runs of 28 min duration were taken using the so-called wobble mode in which the tracking position is displaced in declination with respect to the centre of SN1006 (RA 15h02m48.4s Dec 41∘54′42′′ J2000.0). Runs were accepted for analysis if they met a number of quality control criteria based on the recorded CR rate, the number of malfunctioning pixels in each camera and also the tracking performance. In particular telescope tracking was accurate to 20 arcsec for these data and verified by comparing the locations of bright stars in the camera fields of view. Table 1 summarises observations for those runs meeting quality criteria. Without correction for system deadtime the overall observation times were 30h (2003, with % deadtime) and 7h (2004, with % deadtime). A total of 18.2h (2003) and 6.3h (2004) livetime of ON source data (where SN1006 is in the FoV) were available for analysis.
| Obs. | Runs | ON source | Telescopes | |
| Period | livetime [h] | in use | ||
| Mar 2003 | 18 | 4.1 | 23.9 | 2 |
| Apr 2003 | 21 | 5.0 | 25.4 | 2 |
| May 2003 | 25 | 9.1 | 23.3 | 2 |
| 2003 Total | 65 | 18.2 | 24.0 | |
| May 2004 | 15 | 6.3 | 28.5 | 4 |
| All Total | 80 | 24.5 | 25.0 | |
| a: Average zenith angle [deg] of observations. | ||||
Individual telescope events coincident in time were merged for stereo analysis, followed by Cherenkov image reduction. Image reduction employs image ‘cleaning’ which removes camera pixels dominated by skynoise, flat fielding of the camera responses using a LED flasher, and absolute conversion from pixel ADC counts to photoelectron units using conversion constants obtained from special low-illumination runs. Image moments such as width and length according to Hillas (Hillas:1 (1985)) are used as a basis to reject the dominating CR background. Rejection of the CR background is achieved by application of image shape cuts (mean-reduced-scaled-width and mean-reduced-scaled-length ). A further cut, , the difference in assumed and reconstructed event directions is also applied. Event directions are reconstructed according to algorithm ‘1’ as detailed by Hofmann et al. (Hofmann:1 (1999)). For a point-like source the combination of cuts on shape, and direction allows for rejection of over 99.9% of CRs whilst retaining 40% of -rays above a threshold energy of 260 GeV (2003) and 110 GeV (2004). The full data processing chain and CR rejection applied to these data were defined a-priori using Monte Carlo simulations of -ray and real CR events, and fully verified on the Crab Nebula. Details can be found in Aharonian et al. (Aharonian:10 (2004)).
The skymap in Fig. 1 presents the excess significance for -ray like events (i.e. after cuts) over the RA/Dec plane centred on SN1006. Data from 2003 and 2004 were combined for these analyses. At each bin position, -ray-like events are summed within a circle of radius and the CR background is estimated from a ring region of radius 0.5∘ surrounding the source region. The ring region is chosen to give a solid angle ratio of 1:7 between the source and background regions respectively. The skymap bins of Fig. 1 are therefore correlated.
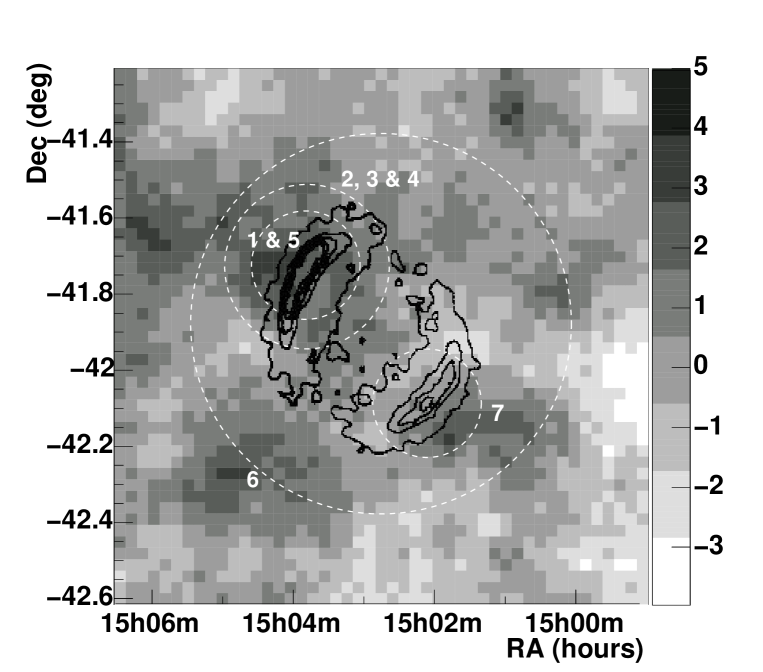
The cut is appropriate for point-like -ray and marginally extended ( few arcmin) emission according to the H.E.S.S. point spread function (PSF). No significant excess suggesting -ray emission is evident in the skymap. A very similar skymap is obtained when using the alternative template model (Rowell Rowell:1 (2003)) as a CR background estimate. Event statistics and -ray flux upper limits at the 99.9% confidence level, summarised in Table 2, have been calculated for a number of a-priori chosen locations based on the X-ray morphology as imaged by ASCA and the results of CANGAROO and HEGRA CT1. The upper limits in the table have assumed a differential photon index of =2, and later (in Fig. 2) we give the upper limit band for a range of assumed indices (2 to 3). The a-priori locations, also indicated in Fig. 1 are defined as:
-
1.
H.E.S.S. Point: Upper limit on point-like emission ( TeV) at the CANGAROO position using (appropriate for the H.E.S.S. PSF). This is also used as an upper limit for the NE Rim position.
-
2.
CANGAROO Point: Upper limit at the CANGAROO position using a cut appropriate for the CANGAROO 3.8m PSF and selecting events above their energy threshold ( 1.7 TeV).
-
3.
CANGAROO Point 2003: As above using only 2003 data.
-
4.
CANGAROO Point 2004: As above using only 2004 data.
-
5.
High Energy Point: Excess events at the CANGAROO position using cut appropriate to the H.E.S.S. PSF but with an energy threshold TeV to compare with the HEGRA CT1 result (Vitale et al. Vitale:1 (2003)). Due to low statistics, the background is estimated from the full FoV (radius 2.0∘) excluding the source region and corrected for differences in expected FoV efficiency. The dominant error comes from the on count statistics.
-
6.
Whole SNR: Entire SNR at the remnant centre using , and H.E.S.S. energy threshold of (0.26 TeV).
-
7.
SW Rim: As for position 1 but centered on the SE rim.
| Region | aRA | aDec | bS | |||||
| 1. H.E.S.S. Point ( TeV) | 15h03m48s | 41∘45′ | 0.14∘ | 1072 | 6854 | 0.150 | 1.19 | 2.19 |
| (also NE rim) | ||||||||
| 2. CANGAROO Point ( TeV) | 15h03m48s | 41∘45′ | 0.25∘ | 127 | 792 | 0.153 | 0.48 | 0.34 |
| 3. CANG. Point ( TeV) | 15h03m48s | 41∘45′ | 0.25∘ | 56 | 309 | 0.152 | 1.2 | 0.45 |
| (2003 H.E.S.S. Data) | ||||||||
| 4. CANG. Point ( TeV) | 15h03m48s | 41∘45′ | 0.25∘ | 71 | 483 | 0.154 | -0.35 | 0.49 |
| (2004 H.E.S.S. Data) | ||||||||
| 5. H.E. Point ( TeV) | 15h03m48s | 41∘45′ | 0.25∘ | 0 | 20 | 0.0069 | - | 0.18d |
| 6. Whole SNR ( TeV) | 15h02m48.4s | 41∘54′42′′ | 0.50∘ | 13358 | 63113 | 0.217 | 2.8 | 2.39 |
| 7. SW Rim ( TeV) | 15h02m4s | 42∘06′3′′ | 0.14∘ | 1042 | 6754 | 0.150 | 0.80 | 1.98 |
| a. RA & Dec J2000.0 epoch | ||||||||
| b. Significance from Eq. 17 of Li & Ma Li:1 (1983), using normalisation factor | ||||||||
| c. 99.9% integral upper limit ( ph cm-2s-1) | ||||||||
| d. Dominant error is from . We quote here the 99.9% upper limit, which for a Poisson of mean zero is 7 counts. | ||||||||
3 Discussion & Conclusions
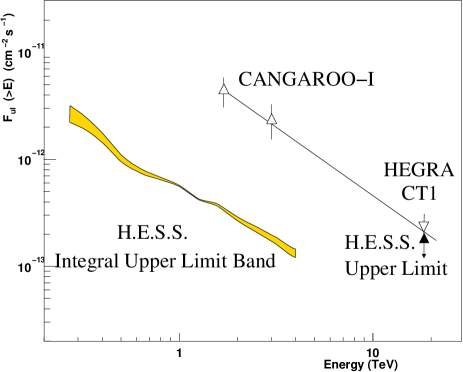
Comparing the H.E.S.S. upper limits with the fluxes from CANGAROO-I (1996 and 1997 observations) reveals a discrepancy of a factor 10 (see Fig. 2). It is also clear that no -ray emission arises in just one of the years that H.E.S.S. has observed, 2003 nor 2004 (see results given in Table 2 for the CANGAROO position, 2003 and 2004 respectively). Thus H.E.S.S. observations do not confirm the previously-published CANGAROO fluxes for SN1006. One would have to invoke a -ray flux variation over timescales less than 1 percent of the SNR age of an order of magnitude, in order to explain the non-detection by H.E.S.S. This is however quite unlikely to occur within the long-accepted diffusive shock acceleration framework for particle acceleration in SNR.
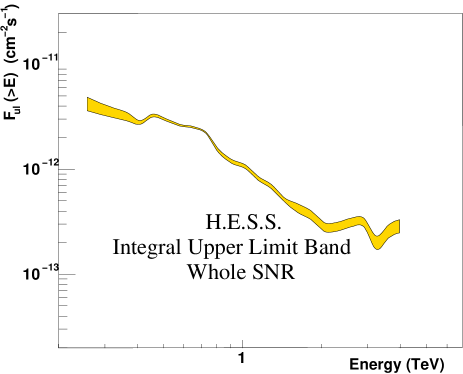
The HEGRA CT1 telescope observed SN1006 at very large zenith angles and obtained a preliminary flux of (E TeV) = 2.510-13 ph cm-2s-1 (Vitale et al. Vitale:1 (2003)). We applied a matching high threshold cut to H.E.S.S. data and obtained zero counts on source, (with =0.14 excess events). The 99.9% upper limit on this is a Poisson distribution with a mean of 7 events (we take here the dominant error in the on source counts and quote the Poisson error). In comparing with the HEGRA CT1 result one must also take into consideration the systematic uncertainty on this flux, estimated to be 35% (Vitale et al. Vitale:1 (2003)). Given our exposure and considering both statistical and (uncorrelated) systematic uncertainties, the HEGRA CT1 flux would yield 116 excess counts if seen by H.E.S.S. The lower fluctuated value, at 5 counts, is consistent with our observed zero counts with a chance probability of . We also include in Fig. 2 the 99.9% upper limit for the whole SNR as a function of energy. This allows comparison in cases where emission from models is predicted from regions not necessarily restricted to the NE and SW rims.
The H.E.S.S. upper limits permit estimation of important parameters for SN1006, in the framework of this source as a particle accelerator. One can firstly estimate an upper limit to the -ray luminosity as erg s-1 for a -ray flux and source distance . Distance estimates for SN1006 are in the range 0.7 to 2.0 kpc, (see Allen et al. Allen:1 (2001) for a recent summary of measurements). Taking the H.E.S.S. upper limit for the whole SNR ( TeV), distance kpc, assuming a differential photon spectrum of and energy range 0.26 to 10 TeV gives erg s-1. This applies to the present epoch of SNR evolution for SN1006 which is likely in the early Sedov phase (Berezhko et al. Berezhko:1 (2002)). We also estimate the energy in the corresponding accelerated protons over the SNR lifetime as erg. The estimate applies to protons of energy to 60 TeV, and accounts for the average inelasticity () of converting energy from protons to -rays in this scheme. The rather energy independent characteristic lifetime of accelerated protons interacting with an ambient matter of density cm-3 () is (/cm-3)-1 sec. With derived above we arrive at 7.8 (/cm-3)-1 erg. Values for are in the range to cm-3 based on X-ray and optical observations. Adopting the lowest value cm-3 of the range of densities yields the upper limit erg. The choice of in the estimate should reflect the average density of ambient matter inside the remnant undergoing interaction with the downstream cosmic-rays (which are assumed to be confined inside the SNR). A lower limit on this value would be that of the ambient matter. We can account for the fact that the energy band of H.E.S.S. observations corresponding to protons ( to 60 TeV) is a fraction of the total expected energy in protons over a much wider range of energies covering the cosmic-ray spectrum up to the knee (we assume here 1 GeV to 3 PeV with a differential particle index of 2). Given this, an upper limit on the full proton budget would be erg.
Under the synchrotron/IC (scattering on the ubiquitous cosmic microwave background) scenario, knowledge of the synchrotron X-ray flux and TeV IC flux arising from the same electrons permits a clear constraint on the field in the shock-compressed regions (downstream from the shock) of the SNR according to (Aharonian et al. Aharonian:5 (1997)). It is assumed here that the X-ray and -ray emitting regions are of the same size, and thus the filling factor . Such a case arises for high fields when electrons rapidly cool at their synchrotron production regions. High values for G are in fact implied by X-ray observations and subsequent interpretation in the diffusive shock acceleration framework (Allen et al. Allen:1 (2001), Berezhko et al. Berezhko:1 (2002, 2003), Bamba et al. Bamba:1 (2003), Yamazaki et al. Yamazaki:1 (2004), Ksenofontov et al. Ksenofontov:1 (2004)). With the H.E.S.S. upper limits on the -ray emission, one can therefore estimate a lower limit on the -field. The synchrotron () and IC () photon energies are coupled according to TeV, requiring that the fluxes and in appropriate energy ranges be compared. Comparing the available X-ray energy flux ( to 2 keV) erg cm-2s-1 (Allen et al. Allen:1 (2001)) with that of H.E.S.S. (upper limit energy flux for the whole SNR over an appropriate energy range E1 to 10 TeV and assuming a 2.0 spectral index) at =2.29 erg cm-2s-1 yields a lower limit of G. This lower limit on is consistent with values discussed earlier which result from comparisons of X-ray observations with detailed theory. In summary, H.E.S.S. observations of SN1006 have not revealed evidence for TeV -ray emission. The resulting upper limits will be valuable in constraining further the parameters of -ray production in SN1006 (see e.g. Aharonian & Atoyan Aharonian:1 (1999); Berezhko et al. Berezhko:1 (2002), Ksenofontov et al. Ksenofontov:1 (2004)).
Acknowledgements.
The support of the Namibian authorities and of the University of Namibia in facilitating the construction and operation of H.E.S.S. is gratefully acknowledged, as is the support by the German Ministry for Education and Research (BMBF), the Max Planck Society, the French Ministry for Research, the CNRS-IN2P3 and the Astroparticle Interdisciplinary Programme of the CNRS, the U.K. Particle Physics and Astronomy Research Council (PPARC), the IPNP of the Charles University, the South African Department of Science and Technology and National Research Foundation, and by the University of Namibia. We appreciate the excellent work of the technical support staff in Berlin, Durham, Hamburg, Heidelberg, Palaiseau, Paris, Saclay, and in Namibia in the construction and operation of the equipment.References
- (1) Aharonian F.A., Atoyan A.M., Kifune T., 1997, MNRAS 291, 162
- (2) Aharonian F.A., Atoyan A.M. 1999 A&A 351, 330
- (3) Aharonian F.A., Akhperjanian A.J., Aye K.M. et al. 2004 A&A in prep.
- (4) Allen G.E., Petre R., Gotthelf E.V. 2001 ApJ 558, 739
- (5) Bamba A., Ueno M., Nakajima H., Koyama K. 2003 ApJ 589, 827
- (6) Berezhko E.G., Ksenofontov L.T., Völk H.J. 2002 A&A 395, 943
- (7) Berezhko E.G., Ksenofontov L.T., Völk H.J. 2003 A&A 412, L11
- (8) Bernlöhr K., et al. 2003 Astropart. Phys. 20, 111
- (9) Cornils R., et al. 2003 Astropart. Phys. 20, 129
- (10) Drury L.O’C, Aharonian F.A., Völk H.J. 1994 A&A 287, 959
- (11) Feldman G.J., Cousins R.D. 1998 Phys. Rev. D57, 3837
- (12) Funk S., Hermann G., Hinton J. et al. 2004 Astropart. Phys. 22, 285
- (13) Hara S., Tanimori T., Kubo H., et al. 2001 In Proc. 27th ICRC Hamburg 5, 2455
- (14) Hillas A. 1985 In Proc. 19th ICRC (La Jolla) vol 3, 445
- (15) Hofmann W., Jung I., Konopelko A. et.al 1999 Astropart. Phys. 10, 275
- (16) Koyama K., Petre R., Gotthelf E.V. et al. 1995 Nature, 378
- (17) Ksenofontov L.T., Berezhko E.G., Völk H.J. 2004 in Proc. Symp. on High Energy Gamma-Ray Astronomy (Heidelberg), AIP Press in press
- (18) Li T.P., Ma Y.Q. 1983 ApJ 272, 317
- (19) Long K.S., Reynolds S.P., Raymond J.C. et al. 2003 ApJ 586, 1162
- (20) Naito T., Takahara F. 1994 J. Phys. G: Nucl. Part. Phys. 20, 477
- (21) Naito T., et al. 1999 Astron. Nachr. 320, 205
- (22) Masterson C. et al. 2003 Proc. 28th ICRC Tsukuba OG2.2, 2323
- (23) Rowell G.P. 2003 A&A 410, 389
- (24) Tanimori T., Hayami Y., Kamei S., et al. 1998 ApJ, L25
- (25) Tanimori T., Naito T., T. Yoshida T., et al. 2001 In Proc. 27th ICRC Hamburg, vol 5, 2465
- (26) Vincent P., et al. 2003 Proc. 28th ICRC, Tsukuba, Univ. Academy Press Tokyo, 2887
- (27) Vitale V.., et al. 2003 In Proc. 28th ICRC Tsukuba, OG2.2, 2389
- (28) Yamazaki R., Yoshida T., Terasawa T., et al. 2004 A&A 416, 595