How Concentrated Are The Haloes Of Low Surface Brightness Galaxies In The Cold Dark Matter Model?
Abstract
We investigate whether a correlation exists between the concentration () and spin () parameters of dark matter haloes forming in CDM N-body simulations. In particular, we focus on haloes with virial masses in the range , characteristic of the hosts of Low Surface Brightness (LSB) and High Surface Brightness (HSB) galaxies. Our analysis demonstrates that and are anti-correlated. If we assume that a galaxy disk forms in one of these haloes from baryons that approximately conserved angular momentum during their dissipation into the rotationally supported disk, then it is possible to estimate the disk’s central surface density. For an appropriate choice of mass-to-light ratio, we can place constraints on the central surface brightness of the disk and hence identify the analogues of the host haloes of LSB and HSB galaxies. We find that our LSB galaxy analogues occupy haloes that have lower concentrations than might be expected based on consideration of the – relation for the CDM cosmology. The distribution of concentrations peaks at , in good agreement with observational data, although there are important differences between the shapes of the simulated and observationally inferred distributions. This suggests that LSB galaxies inhabit a biased subsample of the halo population, and that this bias may be an important ingredient for resolving the current debate regarding the structure of LSB galaxy dark matter haloes.
keywords:
galaxies: haloes – cosmology:theory, dark matter, gravitation – methods: numerical, N-body simulation1 Introduction
The Cold Dark Matter (CDM) model is widely accepted as the paradigm within which to understand the formation of structure in the Universe. A defining characteristic of this model on the scale of galaxies is the prediction that central densities of dark matter haloes rise as , with , over the radii which govern the inner rotation curves of galaxies. Over the last decade, numerous studies – principally numerical – have sought to quantify and understand this divergent or cuspy behaviour (e.g. Navarro, Frenk & White, 1996; Moore et al., 1998; Navarro et al., 2004). In particular, the continued assertion that the rotation curves of dark matter dominated systems such as low surface brightness (LSB) galaxies require mass profiles with finite constant density cores or shallow “cusps” (e.g. Flores & Primack, 1994; Moore, 1994; Burkert, 1995; de Blok & McGaugh, 1997; McGaugh & de Blok, 1998; de Blok et al., 2003) has prompted many detailed investigations into the consequences of these observations for the CDM model.
This disparity between the predicted and inferred mass profiles appears to
call into question the most basic assumption of the CDM model, namely the
nature of the dark matter, and constitutes a critical challenge to the
paradigm. Indeed, reconciling theory and observation has come to represent
a central problem in contemporary cosmology and is arguably one of its most
contentious issues, as illustrated by recent analyses of the systematic
effects that could affect high resolution rotation curve data of LSB galaxies
and the fitting procedures used in mass modeling.
de Blok et al. (2003, hereafter DB03) have argued
that the signature of CDM cusps should be clear in the data and so the
model’s predictions are inconsistent with observations, while
Hayashi et al. (2004a, b), in some cases using overlapping data, find no
compelling evidence for disagreement between cuspy CDM haloes and observed
rotation curves. These studies focused on the shape of LSB galaxy
rotation curves, which rise approximately linearly with radius in the
manner one would expect if the mass density profile contained
only a shallow central cusp or a constant density core;
if the underlying profile is strongly cuspy, it is argued, the
rotation curve should rise more rapidly at small radii. However, the
rate at which the rotation velocity increases with radius is sensitive
to how centrally concentrated the mass distribution within the
halo is – the more centrally concentrated the halo, the more rapidly
its rotation curve will rise. Thus, a slowly rising rotation curve
could be interpreted as indicative of a halo that is weakly centrally
concentrated.
The seminal work of Navarro, Frenk & White (1996, hereafter NFW) formalised this concept of concentration. Based on a comprehensive suite of simulations, they established their universal mass profile that could describe the structure of an average dark matter halo in dynamical equilibrium, independent of its mass or the choice of cosmological parameters and initial density perturbation spectrum. The circular velocity of a NFW halo can be expressed as
| (1) |
where is the radius normalised by the virial radius 222The virial radius defines the extent of a dark matter halo and is such that it encloses an overdensity times the critical density of the Universe at a given epoch; for the CDM model, ., is the concentration parameter where is the scale radius, and is the virial velocity of the halo. From equation 1, we observe that the circular velocity rises as at small radii, and the larger , the greater .
NFW found that, on average, concentration decreased with increasing virial mass, and they understood that this reflected the mean density of the Universe at the time of the halo’s formation; more massive systems collapse at later times when the mean density of the Universe is lower. Navarro, Frenk & White (1997) and subsequent studies by Bullock et al. (2001a, hereafter B01) and Eke et al. (2001, hereafter ENS) formulated prescriptions that allow the concentration of a given halo of a given mass in a given cosmology to be predicted. Within the B01 or ENS formulations, we expect a typical galaxy mass halo () forming in the CDM cosmology to have a concentration parameter .
If LSB galaxies occupy dark matter haloes of the kind that form in the CDM model, then we might expect typical concentrations of . Both McGaugh et al. (2003) and DB03 have considered the distribution of concentrations obtained from fits to their LSB galaxy rotation curve data, and as illustrated in Figure 3 of McGaugh et al. (2003) and Figure 1 of DB03, the distribution shows two well defined peaks, one at , the other at . The preference for the data to favour such a low value of concentration appears troubling for the CDM model. The mass-concentration relation, predicts that is typical of low mass clusters with rather than low mass galaxies, and the scatter in concentration at a given mass is expected to be at most.
Implicit in this comparison is the untested assumption that the haloes of LSB galaxies are typical for their mass. LSB galaxies are considered ideal for probing the structure of dark matter haloes because the baryons contribute minimally to the rotation curve, greatly facilitating the process of decomposing the rotation curve into baryonic and halo contributions. However, if the haloes of LSB galaxies are biased with respect to the general halo population, then this is a biased comparison. Indeed, it has been noted observationally that detailed mass models of LSB galaxies reveal dark matter haloes that are less dense and more extended than those of high surface brightness (HSB) counterparts of similar masses (see the review of Bothun et al., 1997), suggesting lower concentrations than might be expected. Furthermore, there are theoretical grounds to expect that LSB galaxies inhabit a special class of haloes. The low surface brightness of LSB galaxies is a consequence of their low central density. If we make the reasonable assumption that specific angular momentum of the baryons is approximately conserved during their dissipation into a rotationally supported disk, then the scale length of the resulting disk is related to the angular momentum of the dark matter halo, and we anticipate that LSB galaxies will occupy dark matter haloes with larger spin parameters (a measure of the degree to which the halo is supported by angular momentum; see § 2) than their HSB counterparts. These considerations suggest that LSB galaxies occupy dark matter haloes with low concentrations and high spin parameters, echoing the conclusions of previous studies (e.g. Dalcanton et al., 1997; Jiminez et al., 1998; Mo, Mao & White, 1998).
In this paper, we investigate whether the correlation between concentration and spin, as envisaged by e.g. Dalcanton et al. (1997), Jiminez et al. (1998), and Mo, Mao & White (1998), is sufficient to explain the distribution of concentrations observed by McGaugh et al. (2003) and DB03 for their sample of LSB galaxies. For this purpose, we have analysed a statistical sample of haloes, with masses in the range , forming in a high resolution cosmological CDM N-body simulation, and observe a trend for a halo’s spin parameter to increase with decreasing concentration. Using the analytic prescription presented in Mo, Mao & White (1998), we use the halo spins to estimate disk scale lengths and surface densities for our hypothetical sample of galactic disks, and hence construct the distribution of concentrations we might expect for the host haloes of LSB galaxies. Although there are important differences between the distribution we recover and those presented in McGaugh et al. (2003) and DB03, we observe that the peak at is reproduced in our distribution. We present the results of our analysis in the next section (§ 2) and discuss their significance in § 3.
2 Results
Our results are based on analysis of the =0 output of a
particle cosmological N-body simulation of a
periodic volume, on a side, that was run assuming
the CDM cosmology (, ,
, , ) using the
GADGET2 code (Springel et al., in preparation). A (comoving)
gravitational softening length of (approximately
th the mean interparticle separation) was adopted, and the chosen
parameters imply a particle mass of . The mass resolution of the simulation is sufficient to
resolve a halo with particles. Haloes are identified using a
friends-of-friends (FOF; e.g. Davis et al., 1985) algorithm with a linking
length of times the mean interparticle separation. We note that this
simulation formed the basis of recent studies by Bailin & Steinmetz (2004a, b).
In order to facilitate comparison to observations, we define the concentration with respect to the radius that encloses a spherical overdensity of times the critical density (as in the original NFW papers), rather than the cosmology dependent . This has the effect of lowering the measured concentration of the halo by (approximately independent of concentration) relative to that predicted by either the B01 or ENS prescriptions, reflecting the smaller measured virial radius relative to a fixed scale radius. Concentrations are determined by identifying best fitting parameters () for the enclosed mass at (0.06,0.12,0.25,0.4,0.6,1.0) ; we find that this method is efficient and it produces accurate and robust estimates of .
The standard definition of the spin parameter,
| (2) |
where and are the mass, total angular momentum and energy of the halo respectively, depends on binding energy, which is both a slow operation () and ill defined in the context of a cosmological simulation. Instead, we have chosen to compute the Bullock et al. (2001b) measure,
| (3) |
where is the circular velocity at radius ; this can be corrected by a factor ,
| (4) |

We begin by considering the distribution of halo concentrations relative to their spin parameters for all FOF groups with masses between and , as shown in Figure 1. Although there is large variation in at a given , we note a discernible trend for to increase with decreasing ; the median increases from at to at . This is precisely the behaviour we would expect the host haloes of LSB galaxies to display, in agreement with previous work (e.g. Dalcanton et al., 1997; Jiminez et al., 1998).
Having established a correlation between and , we wish to derive the quantity that characterises a LSB galaxy, namely its central surface brightness ; our particular treatment follows that of Mo, Mao & White (1998). If we assume that the angular momentum of the baryons is approximately conserved during their dissipation into a rotationally supported disk, we can estimate the angular momentum of the disk and hence its extent for a given mass . We assume that the disk’s mass and angular momentum are fixed fractions of those of the host halo’s mass and angular momentum, and choose such that and . Accordingly, the central surface density is given by
| (5) |
where is the scale length of the disk,
| (6) |
where
| (7) |
and we use the fitting formula of Mo, Mao & White (1998) (see their equation (32)). The central surface brightness can be estimated by assuming a particular choice of local mass-to-light ratio, which is a combination of the gas and star ratios. de Blok et al. (1997) indicates a local , and de Blok (2004, private communication) suggests ; in what follows, we adopt .
By definition, a LSB galaxy is one whose central surface brightness
satisfies mag arcsec-2; typical B-band values
lie in the range mag arcsec-2 for LSB
galaxies, compared with mag arcsec-2
for HSB galaxies. Converting to central surface densities, we select
LSB and HSB galaxies by applying cuts of
and respectively, where
is expressed in units of .

In Figure 2, we demonstrate how central surface density correlates with concentration , where is evaluated using equations (5) and (6). As expected, there is a clear trend for haloes with lower concentrations to host disks that have lower central surface densities; the median increases from at to at . We quantify this trend by computing the mean value of in bins of width 0.5 in and performing a linear regression over the range to obtain the relation,
| (8) |
shown by the solid curve in Figure 2; outside of this
range, for and for .
This correlation is due in equal parts to the direct dependence of
on and on the indirect dependence via the spin
parameter .
For a fixed , we find the
distribution of has a width of , essentially
independent of the precise value of .
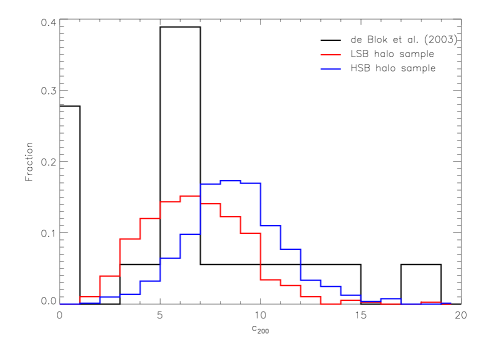
Finally, in Figure 3, we show distributions of concentrations corresponding to the host haloes of LSB (red histogram; hereafter the LSB distribution) and HSB (blue histogram; hereafter the HSB distribution) galaxies by applying the observationally motivated cuts in central surface density (, for LSB and HSB disks respectively) discussed above. For comparison, we show also the distribution derived from fits to high resolution LSB galaxy rotation curves presented in Figure 1 of DB03 (hereafter the DB03 distribution).
There are two main points worthy of note in this figure. Firstly, we find that the LSB and HSB distributions peak at different values of ; the peak value of the HSB distribution occurs at , compared with for the LSB distribution. Secondly, the values of at which the LSB and DB03 distributions peak are in remarkably good agreement – – although we note that the overall shapes of the respective distributions differ; the DB03 distribution has an additional well defined peak at and a tail extending to . However, the peak at in the DB03 distribution is an artifact of the fitting procedure; when the NFW fits were clearly unphysical, such as when they preferred negative values of , the value of was arbitrarily set to 0.1 (de Blok & Bosma, 2002). Therefore, these haloes should be characterized as haloes which cannot be fit by the NFW form, rather than haloes with a well-defined concentration of 0.1. We also note that the – relation implies that very high concentration haloes are exclusively very low mass systems. In particular, the observed halo with is likely a dwarf galaxy whose mass falls well below our low mass cutoff of (Power, 2003).
We can estimate the likelihood that the DB03, LSB and HSB samples are drawn from the same distribution by applying the K-S test. If we include the entire DB03 sample, we find that it is inconsistent with both the LSB () and HSB () samples; ignoring the peak at , we find reasonable agreement with the LSB sample () but not the HSB sample (); and finally, ignoring both the peak at as well as the high- tail, we find improved agreement with the LSB sample () but similarly poor agreement with the HSB sample ().
3 Discussion
The status of LSB galaxies as dark matter dominated systems is a well established observational result (e.g. Bothun et al., 1997) and their rotation curves can provide, in principle, clean probes of the distribution of dark matter within their host haloes. However, as the divergent conclusions reached by the recent studies of DB03 and Hayashi et al. (2004a) demonstrate, the question of whether the shape of LSB galaxy rotation curves can be used to place strong constraints on the nature of the dark matter and hence the validity of the CDM model on small scales continues to be a matter of heated debate. We have not attempted to address this particular issue in our study – the mass resolution of our simulation is insufficient to reliably recover halo density profiles on the scales that are of most interest for comparison with observations (Power et al., 2003) – but it is unlikely that their structure will differ significantly from that predicted by NFW and more recent studies (e.g. Navarro et al., 2004). Instead we have focused on the related topic of the degree to which haloes of the kind predicted to host LSB galaxies in the CDM cosmology are centrally concentrated.
Our analysis indicates that a correlation exists between concentration
and spin for haloes with masses in the range we
have studied, , such that haloes with low values of
tend to have high values of , and vice versa. By
assuming that the baryons associated with these low-,
high- haloes approximately conserve angular momentum during
the formation of the galaxy disk, we recast this trend as one
between the central surface density of the disk, , and the
concentration of its host halo, , using the formalism of
Mo, Mao & White (1998). Adopting an observationally motivated local mass-to-light
ratio, , we identified those haloes most likely to
contain LSB galaxy disks, thus allowing us to construct a distribution
of concentrations that we compared with the distribution of inferred
concentrations presented in DB03. Although there are important
differences between the DB03 and our hypothetical LSB distributions,
namely the presence of a significant number of galaxies for which
and several high- systems, we recover a peak value
of that is in good agreement with observations.
In addition, when we exclude the systems, which are not
true measurements of halo concentration but rather a failing of the
entire fitting formula, and the system, which likely
has a much lower mass than our haloes, we find that the observed and
predicted distributions of are consistent at the 15% level.
This is a compelling result because it establishes the relation between a halo’s concentration and its spin, and confirms the expectation that haloes with low and high are the natural hosts of LSB galaxies. This is in good agreement with the observational evidence, which indicates that LSB galaxies occupy dark matter haloes that are more diffuse and more extended than those of HSB galaxies of comparable mass (e.g. Bothun et al., 1997). As noted in § 1, this is equivalent to stating that the host haloes of LSB galaxies are less centrally concentrated than those of their HSB counterparts. B01 observed and quantified a scatter in concentration for fixed halo mass, and found a 1- variation of (although we note that this has been revised to ; Bullock, private communication). Thus we expect a galaxy halo with a virial mass to have a concentration in the range (B01, ENS). However, previous studies failed to identify any correlation between a halo’s concentration and its spin; NFW examined the distribution of residuals in characteristic overdensity (a function of the concentration) and found no correlation with spin. Similarly, Bullock et al. (2001b) found no evidence for a correlation between the spin parameter and concentration, although they noted a weak trend between their modified spin (see equation 3) and concentration , such that smaller corresponded to larger and vice versa. We suggest that the absence of a correlation in the Bullock et al. (2001b) data reflects the relatively poor mass resolution of their simulation in comparison with ours (a factor of in mass), while we suspect that the selective nature333NFW studied a biased sample – systems in dynamical equilibrium. and poor number statistics of the NFW study will have made the correlation difficult to identify.
Although this result does not resolve the current debate surrounding the mass profiles of LSB galaxy haloes and the implications for the CDM model, it is promising that a set of reasonable assumptions and a simple correlation between concentration and spin can so elegantly lead to two halo populations that bear the characteristics of LSB and HSB galaxies. The central density profiles of the haloes must still be reconciled with the detailed shapes of LSB rotation curves. One possibility is that an additional correlation exists, such that LSB galaxies occupy low-, high- and triaxial haloes, which may have observational consequences for the kind of rotation curves that we might observe; indeed, the bearing of triaxiality on measured rotation curves has been investigated by Hayashi et al. (2004b). Intriguingly, a subpopulation of our LSB host haloes have particularly triaxial figures. Overall, we consider this an encouraging result for advocates of the CDM model and one worthy of further study.
Acknowledgements
We warmly thank Erwin de Blok and Eric Hayashi for helpful correspondence. The financial support of the Australian Research Council is gratefully acknowledged.
References
- Bailin & Steinmetz (2004a) Bailin J. & Steinmetz M. 2004a, ApJ, 616, 27
- Bailin & Steinmetz (2004b) Bailin J. & Steinmetz M. 2004b, preprint (astro-ph/0408163)
- Bothun et al. (1997) Bothun G., Impey C. & McGaugh S. S. 1997, PASP, 109, 745
- Bullock et al. (2001a) Bullock J. S., Kolatt T. S., Sigad Y., Somerville R. S., Kravtsov A. V., Klypin A., Primack J. R. & Dekel A. 2001a, MNRAS, 321, 559 (B01)
- Bullock et al. (2001b) Bullock J. S., Dekel A., Kolatt T. S., Kravtsov A. V., Klypin A. & Primack J. R. 2001b, ApJ, 555, 240
- Burkert (1995) Burkert A. 1995, ApJ, 447, L25
- Dalcanton et al. (1997) Dalcanton J. J, Spergel D. N. & Summers F. J. 1997, ApJ, 482, 659
- Davis et al. (1985) Davis M., Efstathiou G., Frenk C. S. & White S. D. M. 1985, ApJ, 292, 371
- Diemand et al. (2004) Diemand J., Moore B. & Stadel J. 2004, MNRAS, 353, 624
- Dubinski & Carlberg (1991) Dubinski J. & Carlberg R. G. 1991, ApJ, 378, 496
- de Blok & Bosma (2002) de Blok W. J. G. & Bosma, A. 2002, A&A, 385, 816
- de Blok et al. (1997) de Blok W. J. G., McGaugh S. S. & van der Hulst J. M. 1996, MNRAS, 283, 18
- de Blok & McGaugh (1997) de Blok W. J. G. & McGaugh S. S. 1997, MNRAS, 290, 533
- de Blok et al. (2003) de Blok W. J. G., McGaugh S. S. & Bosma A. 2003, MNRAS, 340, 657 (DB03)
- Eke et al. (2001) Eke V. R., Navarro J. F. & Steinmetz M. 2001, ApJ, 554, 114 (ENS)
- Fall & Efstathiou (1980) Fall S. M. & Efstathiou G. 1980, MNRAS, 193, 189
- Flores & Primack (1994) Flores R. A. & Primack J. R. 1994, ApJ, 427, L1
- Hayashi et al. (2004a) Hayashi E., Navarro J. F., Power C., Jenkins A., Frenk C. S., White S. D. M., Springel V., Stadel J. & Quinn T. R. 2004a, MNRAS, 355, 794
- Hayashi et al. (2004b) Hayashi E., Navarro J. F., Jenkins A., Frenk C. S., Power C., White S. D. M., Springel V., Stadel J. & Quinn T. R. 2004b, preprint (astro-ph/0408132)
- Jiminez et al. (1997) Jimenez R., Heavens A. F., Hawkins M. R. S. & Padoan P. 1997, MNRAS, 299, 123
- Jiminez et al. (1998) Jimenez R., Padoan P., Matteucci F. & Heavens A. F. 1998, MNRAS, 299, 123
- McGaugh & Bothun (1994) McGaugh S. S. & Bothun G. D. 1994, AJ, 107, 530
- McGaugh & de Blok (1998) McGaugh S. S. & de Blok W. J. G. 1998, ApJ, 499, 41
- McGaugh et al. (2003) McGaugh S. S., Barker M. K. & de Blok W. J. G. 2003, AJ
- Mo, Mao & White (1998) Mo H. J., Mao S. & White S. D. M. 1998, MNRAS, 295, 319
- Moore (1994) Moore B. 1994, Nature, 370, 629
- Moore et al. (1998) Moore B., Governato F., Quinn T., Stadel J. & Lake G. 1998, ApJL, 499, L5
- Navarro, Frenk & White (1996) Navarro J. F., Frenk C. S. & White S. D. M. 1996, ApJ, 462, 563 (NFW)
- Navarro, Frenk & White (1997) Navarro J. F., Frenk C. S. & White S. D. M. 1997, ApJ, 487, 73
- Navarro et al. (2004) Navarro J. F., Hayashi E., Power C., Jenkins A., Frenk C. S., White S. D. M., Springel V., Stadel J. & Quinn T. R. 2004, MNRAS, 349, 1039
- Power (2003) Power C. 2003, PhD thesis, University of Durham
- Power et al. (2003) Power C., Navarro J. F., Jenkins A., Frenk C. S., White S. D. M., Springel V., Stadel J. & Quinn T. R. 2003, MNRAS, 338, 14