The Integrated Sunyaev-Zeldovich Effect as the Superior Method for Measuring the Mass of Clusters of Galaxies
Abstract
We investigate empirical scaling relations between the thermal Sunyaev-Zeldovich effect (SZE) and cluster mass in simulated clusters of galaxies. The simulated clusters have been compiled from four different samples that differ only in their assumed baryonic physics. We show that the strength of the thermal SZE integrated over a significant fraction of the virialized region of the clusters is relatively insensitive to the detailed heating and cooling processes in the cores of clusters by demonstrating that the derived scaling relations are nearly identical between the four cluster samples considered. For our synthetic images, the central Comptonization parameter shows significant boosting during transient merging events, but the integrated SZE appears to be relatively insensitive to these events. Most importantly, the integrated SZE closely tracks the underlying cluster mass. Observations through the thermal SZE allow a strikingly accurate mass estimation from relatively simple measurements that do not require either parametric modeling or geometric deprojection and thus avoid assumptions regarding the physics of the ICM or the symmetry of the cluster. This result offers significant promise for precision cosmology using clusters of galaxies.
Subject headings:
galaxies:clusters:general–cosmology:observations–hydrodynamics–methods:numerical–cosmology:cosmic microwave background1. Introduction
Observations of galaxy clusters are increasingly used to constrain cosmological parameters. Reliable determinations of the cluster mass, abundance of clusters as a function of redshift (e.g. Haiman et al. (2001)), and gas fraction (e.g. Vikhlinin et al. (2003)) lead to independent constraints on , , and the dark energy equation of state parameter (see e.g. Pen (1997), Sasaki (1996), Allen et al. (2004)). In most cases, extraction of cosmological parameters from clusters requires a high precision measurement of cluster mass, often for a large sample of clusters. It is therefore critical to understand whether existing or planned X-ray or SZE observations can yield sufficiently precise measurements to permit accurate determinations of cosmological parameters.
Historically, cluster gas mass is often deduced from the X-ray temperature using an empirical relation between mass and spectral temperature with relatively small scatter for high mass clusters (e.g. Sanderson et al. (2003)). The X-ray surface brightness of a cluster results from the emission along the line of sight,
| (1) |
where the proportionality holds if includes only bremsstrahlung emission; which is a reasonable approximation for massive clusters of galaxies. In reality, the emission function will include both resonance lines and free-free emission.
In contrast, the Sunyaev-Zeldovich effect (SZE) arises from the inverse Compton scattering of cosmic microwave background photons by electrons in the hot plasma of clusters of galaxies (Sunyaev & Zeldovich, 1972). The strength of the thermal SZE is proportional to the Compton parameter, , which for non-relativistic electrons is essentially the integral of the gas pressure through the cluster
| (2) |
For very hot clusters, relativistic corrections must be included (Itoh et al., 1998). The central value of the Compton parameter will be referred to as . We also consider integrals of the Compton parameter over a finite projected radius; for example is the integral of over a disk with of radius corresponding to an overdensity of 500 relative to the critical density.
From the above discussion, these two cluster observables depend differently on the state of the cluster gas. The X-ray emission is more sensitive to the density, and so one might expect X-ray observations to provide a better constraint on the cluster mass. However, this strong density dependence means that the emission is dominated by the cluster core, where the gas is subject to many complicating effects, including both cooling and heating.
The two methods also have very different selection biases. By its nature, the SZE is redshift independent (Carlstrom et al., 2002) and observations of clusters through this window hold great promise to test cosmological models. Since the thermal SZE measures the integral of the gas pressure and assuming that the gas outside the core is in approximate hydrostatic equilibrium within the dark matter potential, one expects that SZE observations should provide robust measures of the cluster mass - independent of the complicated interplay of physical mechanisms that regulate the thermal state of the cluster gas (e.g. Barbosa et al. (1996),Benson et al. (2004)).
To investigate this expectation, we have constructed four catalogs of simulated clusters of galaxies that differ only in the assumed input physics for the baryonic component. Each sample contains clusters at the present epoch in the mass range from to and clusters more massive than at a redshift of 2, roughly corresponding to the expected sensitivity of upcoming SZE telescopes.
In this Letter, we use ideal synthetic observations of the thermal SZE and X-rays to measure how cluster observables scale with cluster mass. Since no instrumental effects are included, this study indicates the minimum errors one can expect in these relations. Evaluating typical scaling relations for clusters reveals that the integrated SZE is a surprisingly accurate and simple method for determining the mass of clusters. Thus, SZE observations have a high potential for precision measures of fundamental cosmological parameters.
2. Numerical Simulations
Our simulations use the hybrid Eulerian adaptive mesh refinement/N-body code Enzo (O’Shea et al. (2004); http://cosmos.ucsd.edu/enzo) to evolve both the dark matter and baryonic fluid in the clusters, utilizing the piecewise parabolic method (PPM) for the hydrodynamics. With up to seven levels of dynamic refinement in high density regions, we attain spatial resolution up to kpc in the clusters. We assume a concordance CDM cosmological model with the following parameters: , , , , and . Refinement of high density regions is performed as described in Motl et al. (2004). We have constructed a catalog of AMR refined clusters identified in the simulation volume as described in Loken et al. (2002). The four catalogs progressively include additional physical processes in the calculation. Our baseline catalog was run with only adiabatic physics, a second includes the effects of radiative cooling, a third adds a model for the loss of low entropy gas to stars, and a final simulation adds a moderate amount of supernova feedback to the star formation prescription.
The loss of energy to radiation is calculated from a tabulated cooling curve derived from a Raymond-Smith plasma emission model (Brickhouse et al., 1995) assuming a constant metallicity of 0.3 relative to solar. For the simulation runs including star formation, we have incorporated the star formation prescription from Cen & Ostriker (1992).
Briefly, for every most refined cell, if the gas is contracting, cooling rapidly, and contains more than a Jeans mass of material, a new star particle is created with a mass and this amount of mass is removed from the fluid. The star formation rate is thus coupled to the local dynamical time, , while parameterizes the efficiency of star formation and is the simulation timestep increment. In the simulation including feedback from stars, the new star particle begins to deposit energy in the fluid to simulate the explosion of prompt, type II supernovae.
| Temperature | X-ray | Thermal SZE |
| Adiabatic | ||
 |
 |
 |
| Radiative Cooling | ||
 |
 |
 |
| Star Formation | ||
 |
 |
 |
| Star Formation Feedback | ||
 |
 |
 |
3. Results
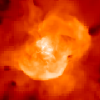
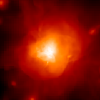
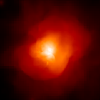
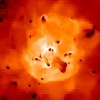
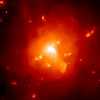
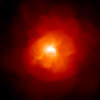
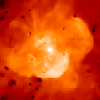
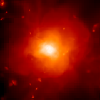
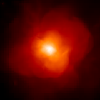
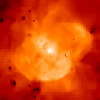
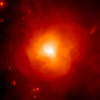
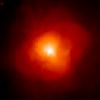
Figure 1 depicts typical simulation results from the four cluster samples that we have considered. The most dramatic difference between the samples is the rich array of cool substructures in the cooling only simulation. These cool cores and their associated shock features are very conspicuous in the temperature map and X-ray image. While there is significant variation between clusters when viewed through their X-ray emission directly or through the derived temperature maps, the thermal SZE yields a quite similar appearance for the clusters - even in the extreme case of cooling only.
3.1. The Effect of Cluster Mergers
The bias introduced by structure formation itself raises potential concerns, independent of the complexities of the detailed physics governing energy balance in the cluster gas. Generally, we find that the central value of the Compton parameter () can be boosted by up to a factor of in head on collisions between equal mass subclusters. These major mergers can drive the evolution of the central SZE signal over time periods of or . Furthermore, even minor mergers (which are more common) with a mass ratio of can produce significant boosts in by a factor of .
On a cluster by cluster basis, merger boosts will bias measurements derived from the cluster properties to, for example, overestimate the mass of the cluster corresponding to a given SZE signal. In a survey of clusters, merger boosts will scatter systems with equilibrium values below the detection threshold (which are more numerous) into the sample.
While mergers significantly impact , they do not impact the value of as drastically. Measuring the integrated SZE out to a significant radius has the effect of de-emphasizing the core properties of the cluster, and so the integrated SZE is less sensitive to the dynamical state of the cluster, as well as to the details of the cluster physics as we show below.
3.2. Thermal SZE Scaling Relations
The comparison of the relation with the relation is shown in the upper panels of Figure 2 for the star formation with feedback sample. The scaling shows a much larger scatter than , and so mass estimation using the central value of the Compton parameter is correspondingly poorer. To illustrate the reason for this discrepancy, we show in the bottom panels of Figure 2 both the central pressure in each cluster, and the integrated pressure inside a sphere of radius as functions of mass. is essentially a measure of the pressure integrated along the line of sight through the cluster center. However, the integrated SZE, , measures the projected integrated pressure inside . It is clear from these plots that while the central pressure is weakly correlated with cluster mass, the value of the pressure integrated out to a large radius is a very good predictor of the mass. This difference is a result of a variety of effects, including both mergers and non-adiabatic physics, which dominate the cluster cores. Observing the integrated SZE signal more effectively samples the cluster potential depth by measuring the integrated pressure out to a large radius, leading to a tight correlation of the strength of the signal with cluster mass.
| Simulation | ||
|---|---|---|
| Adiabatic | 1.59 | 0.021 |
| Radiative Cooling | 1.71 | 0.031 |
| Star Formation | 1.60 | 0.027 |
| Star Formation with Feedback | 1.61 | 0.024 |
Looking back in time through our catalogs of simulated clusters, we find that all four samples produce similar predictions for the scaling between and . These predictions are roughly consistent with the expectations of self-similar scaling for clusters, up to a redshift of 1.5 for which we have a sufficient number of clusters in our simulations. Table 1 shows the scaling exponent and the variance for each of the four samples at , where the scaling relation is written as
| (3) |
The values of the exponent shown in the table are consistent with previous work by da Silva et al. (2004). While the detailed simulation of clusters incorporating all relevant physics remains an unfulfilled challenge, it is reassuring that all models considered by us to date predict similar properties for the integrated SZE. This results from the weak dependence of the integrated SZE on the state of the cluster core. Therefore, the interpretation and modeling of SZE observations of clusters should be relatively immune to theoretical uncertainties and SZE surveys will provide excellent opportunities for constraining cosmological parameters.
| Method | Median | +1 | -1 | +80% | -80% |
|---|---|---|---|---|---|
| 0.97 | 1.00 | 0.93 | 1.13 | 0.86 | |
| 1.04 | 1.11 | 0.92 | 1.33 | 0.74 | |
| 0.87 | 1.03 | 0.75 | 1.46 | 0.62 | |
| 0.96 | 1.14 | 0.82 | 1.53 | 0.67 |
3.3. Cluster Mass Estimates
The relationship between X-ray spectral temperature and cluster mass () is well documented and a similar relation is noted in cosmological simulations (e.g., Bryan & Norman (1998)). This relationship is often used to infer cluster masses. For comparison to the relation studied here, we have measured several other scaling relations, including , for the simulated clusters. is in this case calculated as the X-ray emission weighted average temperature inside a projected radius of . We then use the best-fit scaling relations derived from the star formation with feedback simulation to determine the total cluster mass. Table 2 shows the ratio of estimated mass to true mass for four different scaling relations at z=0.
We find that the integrated thermal SZE signal within a characteristic radius of is the best estimator of the true cluster mass among these scaling relations. For example, 80% of clusters have estimated masses that lie within to of the true cluster mass and this accuracy is nearly constant with redshift back to at least . The value is a much poorer estimate of the true cluster mass, as is expected from the relative scatter of shown in Figure 2. Core effects also have a strong impact on the X-ray luminosity, because of its enhanced density dependence. Therefore the scaling of X-ray luminosity with cluster mass is the poorest of these scaling relations.
The relation for clusters in the simulation generates relative errors of 30% in mass for 80% of clusters. Rasia et al. (2005) show that, from simulations, a scatter of 30% in the relation is reduced to 16% when using their spectroscopic-like temperature in place of the emission weighted temperature. A similar drop in the scatter of the mass estimates quoted here for 80% of the clusters would make the relation roughly equivalent to in predictive power. However, this analysis includes no instrumental effects; a detailed study of the additional error introduced using real observations remains to be done in order to gauge the effectiveness of these methods. Certainly, measuring the value of requires no assumptions about the state of the cluster gas, nor any model fitting, whereas X-ray temperature is generally fit to a model assuming uniform temperature and metallicity within the gas. SZE observations also can be done for a larger number of clusters, and at higher redshifts, than X-ray observations. In any case, of the methods tested here, the integrated SZE scaling relation is superior at estimating cluster masses.
4. Conclusions
The integrated SZE in clusters of galaxies is not strongly dependent on the details of cluster physics or variation in the cluster core in contrast to the X-ray luminosity.
While the value of experiences strong “boosting” due to mergers, the value of appears to be much less sensitive to transient events. Measuring the SZE out to larger radii has the effect of smoothing out the impact of mergers.
The relation is the simplest, least model dependent, and most accurate measure of cluster mass. An unprecedented number of clusters will be observed through the SZE in the near future. Clusters observed through the SZE therefore show great promise as precision cosmological probes.
References
- Allen et al. (2004) Allen, S. W., Schmidt, R. W., Ebeling, H., Fabian, A. C., & van Speybroeck, L. 2004, MNRAS, 353, 457
- Barbosa et al. (1996) Barbosa, D., Bartlett, J. G., Blanchard, A., & Oukbir, J. 1996, A&A, 314, 13
- Benson et al. (2004) Benson, B. A., Church, S. E., Ade, P. A. R., Bock, J. J., Ganga, K. M., Henson, C. N., & Thompson, K. L. 2004, ApJ, 617, 829
- Brickhouse et al. (1995) Brickhouse, N. S., Raymond, J. C., & Smith, B. W. 1995, ApJS, 97, 551
- Bryan & Norman (1998) Bryan, G. L. & Norman, M. L. 1998, ApJ, 495, 80
- Carlstrom et al. (2002) Carlstrom, J. E., Holder, G. P., & Reese, E. D. 2002, ARA&A, 40, 643
- Cen & Ostriker (1992) Cen, R. & Ostriker, J. P. 1992, ApJ, 399, L113
- da Silva et al. (2004) da Silva, A. C., Kay, S. T., Liddle, A. R., & Thomas, P. A. 2004, MNRAS, 348, 1401
- Haiman et al. (2001) Haiman, Z., Mohr, J. J., & Holder, G. P. 2001, ApJ, 553, 545
- Itoh et al. (1998) Itoh, N., Kohyama, Y., & Nozawa, S. 1998, ApJ, 502, 7
- Loken et al. (2002) Loken, C., Norman, M. L., Nelson, E., Burns, J., Bryan, G. L., & Motl, P. 2002, ApJ, 579, 571
- Motl et al. (2004) Motl, P. M., Burns, J. O., Loken, C., Norman, M. L., & Bryan, G. 2004, ApJ, 606, 635
- O’Shea et al. (2004) O’Shea, B. W., Bryan, G., Bordner, J., Norman, M. L., Abel, T., Harkness, R., & Kritsuk, A. 2004, ArXiv Astrophysics e-prints, astro-ph/0403044
- Pen (1997) Pen, U. 1997, New Astronomy, 2, 309
- Rasia et al. (2005) Rasia, E., Mazzotta, P., Borgani, S., Moscardini, L., Dolag, K., Tormen, G., Diaferio, A., & Murante, G. 2005, ApJ, 618, L1
- Sanderson et al. (2003) Sanderson, A. J. R., Ponman, T. J., Finoguenov, A., Lloyd-Davies, E. J., & Markevitch, M. 2003, MNRAS, 340, 989
- Sasaki (1996) Sasaki, S. 1996, PASJ, 48, L119
- Sunyaev & Zeldovich (1972) Sunyaev, R. A. & Zeldovich, Y. B. 1972, Comments on Astrophysics and Space Physics, 4, 173
- Vikhlinin et al. (2003) Vikhlinin, A., Voevodkin, A., Mullis, C. R., VanSpeybroeck, L., Quintana, H., McNamara, B. R., Gioia, I., Hornstrup, A., Henry, J. P., Forman, W. R., & Jones, C. 2003, ApJ, 590, 15