Infrared Spectroscopy of U Equulei’s Warm Circumstellar Gas
Abstract
Medium and high resolution spectroscopy of U Equulei from 1 to 4 m during 1997-2003 has revealed information about its unusual circumstellar envelope, observed previously at optical and radio wavelengths. Strong absorption bands of H2O and of CO dominate the 1–4 m spectrum. The gas has a mean temperature of 600 K and 12C/13C10. The CO 2-0 line profiles and velocities imply no net ejection or infall and indicate either rapid radial gas motions being seen along a narrow continuum beam, or absorption by orbiting gas that is nearly coincident with a highly extended continuum source. The gas could be located in a disk-like structure. The observed high column densities of warm CO and H2 normally would be associated with sufficient dust to completely obscure the star at optical wavelengths. The observations thus indicate either a highly abnormal gas-to-dust ratio, consistent with the earlier optical observation of abundant refractory metal oxides in the circumstellar gas, or peculiar geometry and/or illumination.
1 Introduction
The peculiar variable star, U Equulei (IRAS 20547+0247), has been described by Barnbaum et al. (1996) as having one of the most unusual optical spectra ever observed. Their spectra, obtained in 1994, are dominated by strong absorption bands of metallic oxides, superficially similar to those of mid-late M giants. However the TiO, AlO and VO in U Equ are simultaneously in absorption and in emission. In addition, the bands of these molecules are finely structured, implying a circumstellar, rather than photospheric origin for them. The absorption features must arise from a region so cool that the higher rotational levels are not populated. Yet, at such a temperature the titanium seen in TiO should be in grains.
Besides its unique optical spectrum U Equ displays other peculiarities. Its OH and H2O maser emission (Sivagnanam et al. 1990 and Zuckerman & Lo 1987, respectively) vary in velocity as well in strength. U Equ has a large radial velocity of -78 km s-1 (LSR, -91 km s-1 heliocentric; Sivagnanam et al. 1990); the uncertainty in this value may be as much as 10–20 km s-1 (C. Barnbaum 1996, unpublished data). The object is also at high galactic latitude (–26∘), suggesting a possible link to a halo population. The 25/12 m color observed by the Infrared Astronomical Satellite (IRAS) is typical of optically thin circumstellar envelopes, despite its IRAS LRS spectrum displaying a moderately strong 10 m silicate absorption band (Barnbaum et al. 1996, Chen & Gao 2002), indicating a dusty envelope. Almost all other oxygen-rich stars with similar 25/12 m colors show the 10 m feature in emission, consistent with optically thin shells.
Barnbaum et al. (1996) suggested that U Equ’s silicate absorption feature arises in a thick, dusty circumstellar disk. Since the 25/12 m colors indicate optically thin dust, they proposed that the dusty disk is seen edge-on, with an extended spherical or asymmetrical component giving rise to the 12 and 25 m emission.
U Equ is listed in the General Catalogue of Variable Stars as an irregular long period variable (Lb) with a magnitude variation in the P (photographic) band of 14.5 to 15.5. Barnbaum et al. (1996) estimate its distance as 1.5 kpc. In 1994, the visual magnitude was approximately 9, yet when it was observed again in 1996, 1998, and 1999, the star had faded to V=13. The variations in the the visual magnitude and the origin of the circumstellar material are unexplained. However, the unusual nature of the optical spectrum suggests that U Equ might have entered a rapid stage of evolution. Siess & Livio (1999) have considered that accretion of a giant planet onto a growing red giant could spin up the stellar envelope sufficiently to extrude an equatorially compressed outflow, or expanding disk, and that this might resemble the peculiar environment of U Equ.
In this paper we report infrared spectroscopy of U Equ, which allows a fuller characterization of the physical conditions in the circumstellar material. In particular and in corroboration of the optical study of Barnbaum et al. (1996), we also have found a large quantity of absorbing gaseous matter that is difficult to reconcile with the relatively modest amount of extinction by dust.
2 Observations
Spectra of U Equ in the 1.0–2.5 and 2.9–4.1 m regions were obtained at the 3.8 m diameter United Kingdon Infrared Telescope (UKIRT) at various times during 1997–2003. An observing log is provided in Table 1. The medium resolution observations employed UKIRT’s facility spectrographs: CGS4 (Mountain et al. 1990) with its 40 and 150 l/mm gratings, and 0.6 wide slit; and UIST (Ramsay Howat et al. 2000) with its HK grism and 0.48 wide slit. Resolving powers ranged from 450 to 4100. The spectra were obtained in the stare - nod-along-slit mode. The calibration stars listed in the table were observed immediately before or after U Equ for the purpose of flux calibration and removal of telluric absorption lines. Fluxes of stars in the various photometric bands were estimated from their visual magnitudes and visible-infrared colors predicted for their spectral types (Tokunaga 2000). Wavelength calibration was derived from spectra of arc lamps and is accurate to considerably better than 0.001 m. The echelle in CGS4 was also used in 2003 to obtain high resolution spectra in a number of narrow wavelength intervals in the K window at resolving powers of about 20,000, corresponding to a velocity resolution of 15 km s-1). For these spectra wavelength calibrations were obtained from telluric absorption lines and are accurate to 3 km s-1.
Data reduction employed Figaro routines to extract source spectra from the spectral images produced by the CGS4 and UIST arrays, wavelength-calibrate them, ratio them, and perform an initial flux calibration. It was found that where the lower resolution and spectral segments overlapped or adjoined one another flux levels disagreed typically by 20 percent. The mismatches are probably due to variations in guiding accuracy and in the seeing (which usually was comparable to the slit width) during the observations, as well as to inaccuracies in the IR magnitudes of the calibration stars used in the reduction. Another possibility is variations of U Equ itself. However, the two 3-4 m segments, which were obtained more than two years apart, were mismatched by only 20%. The spectral segments were scaled by small factors in order to adjoin them smoothly. The final flux calibrations are believed to be accurate to +/-20%.
3 Results
3.1 Overview of 1-4 m Spectrum
Figure 1 shows the medium resolution 1.0–2.5 m spectrum of U Equ as observed in 1997 together with the 2.9–4.1 m spectrum as observed in 1998 and 2000. The 1.4–2.5 m spectrum obtained in 2003 is closely similar, in depths of absorption bands and in overall continuum slope, to the spectrum in the top panel of Fig. 1. The 1-4 m spectrum is dominated by water vapor absorption, which is responsible for the deep bands at 1.1–1.2 m, 1.3–1.5 m and 1.8–2.0 m as well as the detailed spectral structure at 2.9–3.4 m. Weak spectral structure is also evident longward of 3.7 m (see Fig. 1, lower panel), but we are unable to identify the absorbing species at this spectral resolution and signal-to-noise ratio (50). Also apparent in the spectrum is absorption due to the first overtone band of carbon monoxide at 2.3–2.4 m. The 1.8–2.0 m water band had been seen previously in a 1.6-2.5 m survey spectrum by Lancon & Wood (2000), but the CO absorption was not reported by those authors, although in retrospect it appears to be present in their spectrum at a low signal-to-noise ratio.
The shape of the 2.3–2.4 m spectrum in Fig. 1, with its local maximum at the CO 2-0 band center near 2.343 m, indicates that most of the CO that is in the lowest (v=0) vibrational state. Thus, the CO is much cooler than a stellar photosphere and must reside in circumstellar material. The narrowness of the 1.9 m water band in comparison to those of cool Miras (e.g., see Lancon & Wood 2000) also suggests that the absorbing material is quite cool.
3.2 Higher resolution spectra: CO, H2O, and H2
A higher resolution (R4100) spectrum of the CO first overtone band obtained in 1998 is shown in Fig. 2. In it the vibration-rotation structure of the P and R branches 2-0 band of CO is clearly resolved into lines. The strongest lines correspond to J10, but individual lines in the R branch can be seen out to J=25 at this resolution. As in the medium resolution spectrum, no 2-0 band head (corresponding to J50) is apparent at 2.293 m. The unevenness of the band structure indicates that absorbers and possibly emitters other than CO are present as well, especially near 2.320-2.325 and 2.340–2.345 m. 13CO and other rarer isotopic species of CO cannot be significant contributors in either of these spectral intervals.
Fig. 3 shows the portion of the R=4100 spectrum from 1998 in more detail, as well as the same interval observed with the CGS4 at R=18000 in 2003. This region contain the strongest CO lines. The difference in the observed widths and depths of the lines is consistent with the different resolutions. From the 2003 spectrum we derive a deconvolved FWHM of 35 km s-1 for these lines. At both times the lines were centered at the nominal radial velocity, -91 km s-1 hel. At the higher resolution of the 2003 spectrum several weaker lines are present. With the aid of the HITRAN2004 database (Rothman et al. 2003) we have identified them as H2O from relatively low-lying energy levels.
Fig. 4 is an echelle spectrum in the vicinity of the CO 2-0 band head. As was apparent in the lower resolution spectra of Figs. 1 and 2, the band head is not seen. The highest J levels that can be distinguished are near J=30. H2O accounts for most of the strong absorption lines in this spectral interval.
The spectrum in Fig. 5 covers an interval near 2.38 m containing the strongest lines of the 2-0 R branch of 13CO. Most of the 13CO lines are blended with stronger lines of H2O and/or the 12CO 2-0 P branch and are not readily apparent. However, the R(10) and R(11) lines of 13CO are fairly well isolated and clearly detected and the R(12) line also is apparent between lines of the other species. Equivalent widths cannot be determined with accuracy because of uncertainties both in the amounts of line blending and in the placement of the continuum.
A high resolution spectrum also was obtained at the wavelength of the 1-0 S(1) transition of H2 and is shown in Fig. 6. This line was detected and its equivalent width over a 75 km s-1 interval centered at the stellar velocity measured to be 92 10-6 m. The core of the line appears to be noticeably narrower than the CO, but this could easily be a consequence of the low signal-to-noise ratio of the spectrum.
4 Discussion
4.1 CO Temperature, 12C/13C, and Column Densities
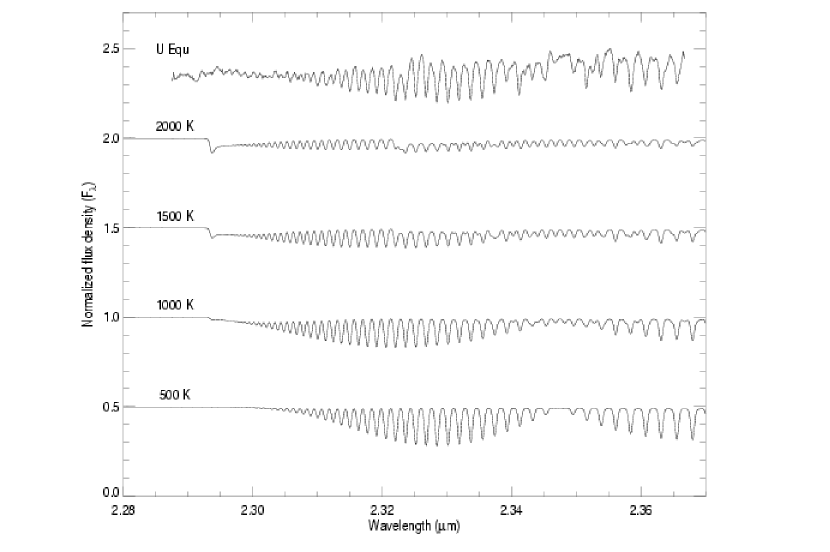
We have attempted to fit the 12CO absorption spectrum in Fig. 2 with a multilayer slab models. Spectra of several single temperature slabs are shown in Fig. 7. Even though other absorbing species, principally H2O, contaminate the spectrum it is clear that at temperatures between 500 K and 1000 K this simple model gives a good general representation of the CO absorption. If the central star is a mid-G giant as suggested by Barnbaum et al. (1996), and all of the CO is at 600 K, the CO is located roughly 5 1013 cm (3 a.u.) from the star. At a distance of 1.5 kpc, a disk or shell of this dimension subtends only 0.005 on the sky and would not be resolved by adaptive optics on the largest telescopes. Indeed upper limits to the diameter from HST imaging (C. Barnbaum 1996, unpublished data) and Keck adaptive optics imaging (M. Morris 2004, unpublished data) are each 0.05.
Figure 8 shows four-layer (2000K, 1500K, 1000K, and 500K) model spectra near 2.38 m, the same interval shown in Fig. 5 containing isolated lines of 13CO and numerous lines of H2O. Each synthetic spectrum has a 12CO column density of 2 1020 cm-2, which fits the 12CO line strengths well. The upper panel shows the effect of varying the H2O column density for 12C/13C = 4, whereas the lower panel shows the effect of varying 12C/13C. As noted previously many of the CO lines are blended with H2O lines; in addition either the H2O line list is incomplete or there are other contaminants. Nevertheless, adding H2O noticeably improves the fit, and these simple models suggest that 12C/13C 4 and that H2O is approximately 2.5 times more abundant than CO.
For the above CO column density and temperature, and at the observed line width, the strongest lines of 12CO have optical depths at line center of order unity in the lowest temperature layer, which contains roughly half of the CO. Therefore the best fit model spectrum with 12C/13C = 4 probably only moderately underestimates 12C/13C, and we conclude that the ratio is 10. Assuming U Equ has [C]/[H] = 2.6 10-4 (Asplund 2003) and that all carbon is in CO, the measured CO column density implies N(H2) 4 1023 cm-2. Using the formulae in Lacy et al. (1994) the measured equivalent width of the H2 S(1) line yields an H2 column density of 4 1023 cm-2 in the v=0, J=1 state, which is roughly half the total column density of H2 at temperatures of 500–1000 K. The comparison suggests that gas phase carbon might be depleted by a factor of roughly 2.
The column densities of CO and H2 in U Equ’s circumstellar material are remarkably high. Justannont et al. (1996) found a CO column density of 1 1019 cm-2 in the circumstellar gas of the oxygen-rich mass-losing supergiant NML Cygni and Hall & Ridgway (1978) found 1 1019 cm-2 of CO in the mass-losing carbon star IRC+10216. The optical extinctions to these two evolved stars are 15 and 20 magnitudes, respectively (Ridgway et al. 1986; Ivesić & Elitzur 1996), much greater than the 2.1 mag toward U Equ (Barnbaum et al. 1996). Column densities of warm CO observed in the dense winds of young stellar objects (e.g., Mitchell et al. 1990) typically are more than two orders of magnitude less than toward U Equ. In interstellar material a gas column density such as that observed in U Equ would be associated with a visual extinction of several tens of magnitudes as well as an H2 column density of 1023 cm-2 (using the cosmic value of [C]/[H]). The former is in conflict with the estimate of Barnbaum et al. (1996) and is clearly unrealistic in view of the visual brightness of U Equ.
Thus, it appears that either the gas-to-dust ratio is much higher in U Equ than in typical circumstellar or interstellar matter, or the dust and associated gas are located in a thin disk that transmits or scatters (above and below the disk) a significant fraction of the photospheric light. In the latter case the above column density is a lower limit.
4.2 Velocities
The CO line profiles, which are centered on the stellar velocity and are symmetric about it, show no evidence for net infall or outflow of the circumstellar material. This result is consistent with the OH line measurements by Sivagnaman et al. (1990), which indicate radial motions of only a few km s-1. A gaseous shell at T600 K stably orbiting U Equ at radius 5 1013 cm, and observed in absorption against a central star, would produce much narrower absorption lines than the observed 35 km s-1 FWHM. If the gas is in a shell-like structure, its motion is highly turbulent and has maintained that turbulence over 6 years, which does not seem likely.
The orbital speed of material at the inferred distance of 5 1013 cm from a roughly solar mass star is 20 km s-1. Thus, the observed 35 km s-1 linewidths suggest that the infrared continuum could be highly extended and nearly coincident with the absorbing gas. The continuum would then result from scattering, absorption, and reemission of photospheric radiation. This crude model probably can account for the observed broad lines but cannot explain the low extinction.
5 Conclusion
Like the optical spectrum, the infrared spectrum of U Equ appears to be unique. Its most remarkable qualities are the presence of large amounts of warm circumstellar CO and water vapor and, as surmised from the optical spectrum, an extreme lack of obscuring dust. The abundances in U Equ are not well quantified, but certainly the presence in the optical spectrum of strong TiO and other metallic oxide features suggests that the ingredients for forming copious amounts of dust are present. The temperature of the CO is well below the dust condensation temperature of metal oxides. Thus all evidence to date suggests that U Equ should be surrounded by a totally obscurring cloud of dust. That this is not the case probably either implies a remarkably high gas to dust ratio or peculiar geometry and illumination, perhaps with starlight illuminating and heating the edge of a very thin circumstellar disk-like structure.
It has been proposed that the phenomena being seen in U Equ might be consistent with the destruction of a planet. Siess & Livio (1999) suggested that U Equ might be extruding metal- enriched material because of rapid rotation caused by the accretion of a giant planet. However, there is no evidence for ejection (i.e., no net outflow of gas; indeed not even asymmetry in the line profiles). Moreover, the very low value of 12C/13C in the circumstellar material indicates that material is not highly diluted by planetary matter, which would have a high value of 12C/13C. Mass estimates are very uncertain because of the unknown geometry of the absorbing CO. If [C]/[H] is solar and even if the observed CO is in a spherical shell of radius 5 1013 cm, the mass of the shell is only 0.03 that of Jupiter, which, when combined with the observed value of 12C/13C again suggests that there has been very little dilution by a planet.
Although the current study provides information on the evolutionary state and some of the general properties of its circumstellar material, it has not solved the enigma that is U Equ. In particular, the tools of very high resolution spectra, polarimetry, and interferometry should now be brought to bear on this most fascinating object.
References
- (1)
- (2) Asplund, M., 2003 in CNO in the Universe, A.S.P. Conf Ser. 304, ed. C. Charbonnel, D. Schaerer & G. Meynet (San Francisco: ASP), 10
- (3)
- (4) Barnbaum, C., Omont, A. & Morris, M. 1996, A&A, 310, 259
- (5)
- (6) Chen, P.-S. & Gao, Y.-F. 2002, Chin. J. Astron. Ap., 2, 169
- (7)
- (8) Hall, D. N. B. & Ridgway, S. T. 1978, Nature, 273, 281
- (9)
- (10) Ivesić, Z. & Elitzur, M. 1996, MNRAS, 279, 1019
- (11)
- (12) Kholopov, P. N. 1985, General Catalog of Variable Stars (4th Edition, Moscow: Nauka)
- (13)
- (14) Justannont, K., et al. 1996, A&A, 315, L217
- (15)
- (16) Lacy, J. H., Knacke, R., Geballe, T. R. & Tokunaga, A. T. 1994, ApJ, 428, L69.
- (17)
- (18) Lancon, A. & Wood P. R. 2000, A & A Suppl., 146, 217
- (19)
- (20) Mitchell, G. F., Maillard, J.-P., Allen, M., Beer, R. & Belcourt, K. 1990, ApJ, 363, 554
- (21)
- (22) Mountain C. M., Robertson D. J., Lee T. J. et al. 1990, SPIE 1235, 25
- (23)
- (24) Ramsay Howat, S. K., Ellis, M. A., Gostick, D. C., Hastings, P. R., Strachan, M., & Wells, M. 2000, Proc. SPIE, 4008, 1067
- (25)
- (26) Ridgway, S. T., Joyce, R. R., Connors, D., Pipher, J. L. & Dainty. C. 1986, ApJ, 302, 662
- (27)
- (28) Rothman, L. S., et al. 2003, J. Quant. Sp. Rad. Trans., 82, 5
- (29)
- (30) Siess, L. & Livio, M. 1999, MNRAS, 308, 1133
- (31)
- (32) Sivagnanam, P., le Squeren, A. M., Minh, F.Tran & Brax, M. A. 1990 A&A, 233, 112
- (33)
- (34) Tokunaga, A. T., 2000, in ”Allen’s Astrophysical Quantities,” ed. A. N. Cox, (New York: Springer Verlag), 143
- (35)
- (36) Zuckerman, B. & Lo, K. Y. 1987, A&A, 173, 263
- (37)


| Date | Wavelength (m) | R | Exposure (s) | Calib. star |
|---|---|---|---|---|
| 19970802 | 1.00-1.33 | 950 | 288 | HR 7973 (F5V) |
| 19970802 | 1.44-2.10 | 700 | 96 | HR 7973 (F5V) |
| 19970802 | 1.87-2.52 | 880 | 96 | HR 7973 (F5V) |
| 19980407 | 2.25-2.42 | 2100 | 1080 | HR 7973 (F5V) |
| 19980422 | 2.29-2.37 | 4100 | 1080 | HR 8205 (A1V) |
| 19980624 | 3.45-4.09 | 1500 | 240 | HR 8328 (A1V) |
| 20001208 | 2.89-3.52 | 1280 | 576 | HR 8205 (A1V) |
| 20030824 | 1.40-2.50 | 450 | 1800 | HIP 102805 (F5V) |
| 20030824 | 2.328-2.344 | 18000 | 960 | HR 8178 (A3V) |
| 20030824 | 2.115-2.127 | 21000 | 1920 | HIP 102631 (A0V) |
| 20030909 | 2.374-2.388 | 19000 | 480 | HIP 102631 (A0V) |
| 20031113 | 2.292-2.305 | 21000 | 1440 | HIP 102631 (A0V) |