Spectrum and amplitudes of internal gravity
waves excited by penetrative convection
in solar-type stars
The excitation of internal gravity waves by penetrative convective plumes is investigated using 2-D direct simulations of compressible convection. The wave generation is quantitatively studied from the linear response of the radiative zone to the plumes penetration, using projections onto the g-modes solutions of the associated linear eigenvalue problem for the perturbations. This allows an accurate determination of both the spectrum and amplitudes of the stochastically excited modes. Using time-frequency diagrams of the mode amplitudes, we then show that the lifetime of a mode is around twice its period and that during times of significant excitation up to 40% of the total kinetic energy may be contained into g-modes.
Key Words.:
hydrodynamics - convection - waves - stars: oscillations - methods: numerical1 Introduction
Although their detection in the spectrum of solar oscillations has been not clearly confirmed (e.g., Turck-Chièze et al. 2004; Gabriel et al. 2002), internal gravity waves (hereafter IGWs) propagating in the radiative zones of late-type stars have recently been invoked in attempts to explain the Li abundance of cool stars and the rigid rotation of their radiative interiors.
The former problem is also referred to as the Li-dip problem and concerns the dependence of the lithium abundance on the spectral type for some main-sequence stars. Models based on the extension of the surface convection zone down to the nuclear burning region (Iben 1965) and models which take into account the transport of Li both by meridional circulation and shear-induced turbulence (Talon & Charbonnel 1998) are indeed not quite satisfactory to reproduce the Li-dip. The latter problem concerning the rigidity of the Sun’s radiative interior is most clearly revealed by helioseismology (Brown et al. 1989). Both rotation-induced turbulent diffusion and wind-driven meridional circulation fail to redistribute enough angular momentum over the lifetime of the Sun to rotate rigidly (Zahn et al. 1997). Likewise, the hypothesis of a large-scale poloidal magnetic field leads to problems, because it may transmit under certain circumstances the differential rotation of the convection zone to the core (owing to Ferraro’s law; e.g., MacGregor & Charbonneau 1999).
Zahn (1994) showed that the two problems are coupled and that they should to be explained by a single model. Being inspired by meteorological studies of the wave transport taking place in the Earth stratosphere (Bretherton 1969; Alexander & Pfister 1995), Schatzman (1993) was the first to propose internal gravity waves as an efficient transport mechanism in stellar radiative zones. Later, this idea was tested by many authors (Zahn et al. 1997; Kumar & Quataert 1997; Kumar et al. 1999; Talon, Kumar & Zahn 2002) who showed that internal gravity waves transport momentum on a rather short timescale such that the rotation of the solar core becomes nearly uniform. A remaining problem is the excitation of these deep gravity waves since, unlike pulsating white dwarfs, a -mechanism based on hydrogen and helium ionization zones is not applicable here.
The most wide-spread excitation model is based on penetrative convection from neighboring convection zones. Strong downward plumes are known to extend a substantial distance into the adjacent stable zones so that internal gravity waves can be randomly generated. 2-D and 3-D direct numerical simulations of superposed stable and unstable layers have confirmed this scenario since gravity-like waves have been well observed in stable regions (Hurlburt et al. 1986, 1994; Brandenburg et al. 1996; Brummell et al. 2002).
The aim of this paper is to investigate in detail the excitation of IGWs by overshooting in an high-resolution 2-D hydrodynamical simulation of a three-layer model, consisting of a convective zone (hereafter CZ) embedded between an upper cooling zone and a lower stably stratified radiative zone (hereafter RZ). In all previous numerical studies, gravity waves have been detected using Fourier’s analysis such as, for example, the -diagram. However, the link with the eigenmodes of stable regions was not investigated. In particular, it has not clearly been demonstrated that the excited waves really correspond to gravity waves since the only criterion was the Brunt-Väisälä frequency as an upper bound.
In this work, g-modes are rigorously measured using the method that we have presented and tested on the gravity mode oscillations of an isothermal atmosphere in Dintrans & Brandenburg (2004, hereafter Paper I). Our method mainly relies on the projection of the velocity field of the simulation onto the basis shaped from the solutions of the associated linear eigenvalue problem for the perturbations; i.e., the theoretical g-modes of the RZ. Hence the mode amplitudes are simply given by the time-dependent basis coefficients, which allows a quantitative study of the excitation mechanism. In other words, we investigate the generation of IGWs by penetrative convection from the linear response of the RZ to this penetration.
We begin by presenting our hydrodynamical 2-D model consisting in three superposed polytropic layers, and give some details on the code we use to solve it numerically (Sect. 2). We then give the main properties of the obtained simulation of penetrative convection and show that the classical detection method of gravity mode oscillations based on Fourier’s transforms in both space and time fails to give reliable results on this problem (Sect. 3). We then introduce our detection technique based on the anelastic subspace and apply it to find the properties of the g-modes propagating in the numerical simulation (Sect. 4). Finally, we conclude in Sect. 5 by giving some outlooks of this work.
2 The hydrodynamical model
2.1 The basic equations
We adopt Cartesian coordinates where denotes the horizontal direction and is depth pointing downward as the gravity . Our system is composed of a convection zone of depth , embedded between two stable layers (Figure 1). We assume that the gas is monatomic and perfect, so its equation of state is given by
where is the pressure, the density, the internal energy, and is the ratio of specific heats and .
We solve the following set of hydrodynamical equations (conservation of mass, momentum and energy):
| (1) |
where is the velocity and is the total derivative. In addition, denotes the constant kinematic viscosity111In Hurlburt et al. (1986, 1994), Cattaneo et al. (1991) or Bogdan et al. (1993), it is the dynamical viscosity which is constant. However, the kinematic viscosity becomes very large as the density tends to zero leading to a highly viscous surface layer. and the radiative conductivity divided by 222Hereafter, we will simply refer to as the radiative conductivity.. To reproduce the radiative cooling taking place at a star’s surface, we add a cooling term in the energy equation given by
| (2) |
where is the cooling rate profile which is set equal to zero everywhere except close to the surface, i.e. only for . Because of this efficient cooling, the surface layer tends to be isothermal and the internal energy is almost constant there. Finally, denotes the traceless strain tensor given by
\psfrag{xaxis}{$x$}\psfrag{zaxis}{$z$}\psfrag{x1}{$x_{1}$}\psfrag{x4}{$x_{4}$}\psfrag{z1}{$z_{1}$}\psfrag{z2}{$z_{2}$}\psfrag{z3}{$z_{3}$}\psfrag{z4}{$z_{4}$}\psfrag{upper}{stable cooling zone with index $m_{1}$}\psfrag{middle}{unstable convection zone with index $m_{2}$}\psfrag{lower}{stable radiative zone with index $m_{3}$}\includegraphics[width=199.16928pt]{2831fg1.eps}
2.2 Boundary conditions and the initial setup
We assume that and are periodic in the horizontal direction and adopt the following conditions at the upper and lower boundaries:
| (3) |
where and correspond to the horizontal and vertical velocities, respectively.
Following Brandenburg et al. (1996), we choose the depth of the unstable layer as the unit of length, as the unit of time and the initial value of the density at the bottom of the convection zone (hereafter BCZ) as the unit of density [velocities are thus measured in units of , i.e. the free-fall velocity of the unstable layer divided by , and fluxes in units of ]. Finally, the dimensionless gravity is set equal to unity in the whole domain, i.e. everywhere.
The initial state is computed using polytropes in hydrostatic and radiative equilibrium (e.g., Hurlburt et al. 1986). In Appendix A we give the details of the initial setup, in particular the mixing length solution in the calculation of the CZ stratification, which helps to accelerate the numerical convergence towards the thermally relaxed state.
2.3 The numerical method
We use the hydrodynamical code described in Nordlund & Stein (1990) to advance the fully nonlinear set of Eqs. (1). In this code, spatial derivatives are computed using sixth order compact finite differences (Lele 1992) whereas the time advance is performed using a third order explicit Hyman scheme (Hyman 1979). Corresponding timesteps are usually of the Courant-Friedrich-Levy timestep defined by
where is the sound speed, the radiative diffusivity and an empirical factor determining the length of the diffusive timestep. In practice, it is the radiative diffusion term which limits the timestep due to both the high vertical resolution and large radiative diffusivities of radiative zones.
Contrary to acoustic modes, gravity modes correspond to waves with long periods, of about twenty time units in our numerical simulations, typically. Hence, once achieved the thermal relaxation of the radiative zone, we still need to integrate the dynamical equations over very long times to capture so much periods as possible (one typically needs runs as long as one thousand time units). We then chose to concentrate on a particular 2-D simulation with an high spatial resolution (i.e. 256 mesh points in the horizontal and 512 points in the vertical) and an aspect ratio ( being the horizontal extent of the computational domain). The main properties of this simulation are the following:
| (4) |
where denotes the Prandtl number. The corresponding Rayleigh number of the unstable layer is , using the definition in Gough et al. (1976). The kinematic viscosity cannot be too small for a given resolution as it should satisfy , where is the smallest mesh interval in the vertical direction and Re is the Reynolds number (e.g., Landau & Lifshitz 1980). The value we chose is a reasonably “safe” one as this is around fifty times larger than the minimum viscosity imposed by both the resolution and the mean Reynolds number of our simulation.


3 Nature of the penetrative convection and the IGW detection problem
Since the pioneering numerical simulations of Hurlburt et al. (1986), the general features of penetrative compressible convection are well known and we are simply giving here the main properties of such a flow.
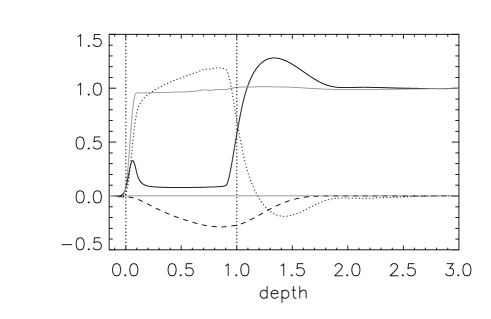
Figures 2 and 3 represent typical asymmetrical patterns and mean vertical radiative, convective and kinetic fluxes that we obtain in our numerical simulation of compressible convection with penetration, the fluxes being computed from their usual definition (e.g., Hurlburt et al. 1986)
| (5) |
where the overbars and brackets denote the horizontal and temporal means, respectively, and is the temperature fluctuation about the horizontal mean. Compressibility effects destroy the usual symmetric velocity field observed in Boussinesq convection as downdrafts become stronger and more concentrated than the broader upward flow (Graham 1975; Hurlburt et al. 1984). The main consequence is that some localized downward-directed narrow plumes appear which transport a significant kinetic flux in this direction (around 30% of the total flux at the BCZ in this simulation; see the dot-dashed line in Fig. 3).
The presence of a lower stable layer below the convection zone allows these downward plumes to penetrate some distance into the RZ. This convective penetration has been theoretically investigated in the astrophysical context by Zahn (1991) who showed that it strongly depends on the value of the local Péclet number ( and being the typical vertical velocity and size of those motions, respectively).
Following Brummell et al. (2002), we define the penetration extent as the vertical distance from the BCZ where the horizontally-averaged kinetic flux decreases to 1% of its maximum value and Fig. 4 shows an example of its evolution with time. The averaged penetration is , that is, of order the half-size of the CZ, which is typical of hydrodynamical simulations at low Péclet numbers. Indeed, Pe falls down very rapidly just below the CZ due to the large radiative diffusivity of the radiative zone. In polytropic models, the radiative diffusivity is proportional to , where is the polytropic index, see Eq. (16), so a convective blob experiences a jump in the Péclet number when it crosses the interface between the CZ and RZ zones
| (6) |
Figure 5 shows the vertical profile of the Péclet number. The estimate of the Péclet jump across the CZ-RZ interface using Eq.(6) gives or , which is effectively the one in Fig. 6, where . As a result, the cold blob thermalizes very rapidly in the radiative zone and loses its identity compared to its environment: the buoyancy braking thus disappears and allows the blob to continue by inertia in the stable zone, leading to the observed large penetration. (In solar-type stars the relevant extent is actually much smaller, because here the thermal conductivity is still too large and therefore the overall fluxes, and hence the amount of flux is too large.)
3.1 Finding the g-modes: the problem of the random excitation
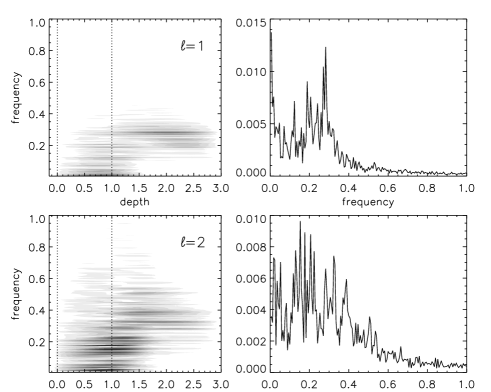
As discussed in Paper I, the classical technique to detect the g-modes propagating in an hydrodynamical simulation consists first of taking horizontal Fourier transforms of the vertical mass flux for every time step, to get 333Here and in the following, we define the horizontal wavenumber as , where denotes the mode degree and is a non-zero positive integer, , as purely radial g-modes cannot exist (e.g., Turner 1973).. Second, one computes power spectra for the individual time series , to get , and plots the resulting power spectra at a given degree in a -plane to highlight the “shark fin” peaks corresponding to the eigenmodes (e.g., Fig. 5 in Paper I).
Figure 6 shows the result of applying this method to the detection of , and g-modes propagating in the simulation. Low-frequency peaks appear in the RZ (), mainly in the diagram, but these peaks are not as well defined as in Paper I. Indeed, we have focused in the previous paper on the simpler case of the g-modes of an isothermal atmosphere where IGWs were excited by the vertical free oscillations of a cold bubble: once emitted, each global mode “stayed in the box” during a time that depends on the efficiency of the dissipation, which was mainly due to a weak viscosity. As a consequence, large-scale nonradial g-modes survived over long times and were very well visible in the temporal spectra, both in the -plane and in its depth-integrated representation (see Fig. 3 in Paper I).
The situation is clearly different with penetrative convection as we have now to deal with a random excitation of IGWs. Indeed, strong downward plumes are not stationary structures: they are born in the upper layers of the convection zone, are accelerated by the Archimedes force during their CZ crossing and, finally, end their life in the overshoot region where they transfer a large amount of their stored kinetic energy to the stably stratified medium, resulting in an internal gravity wave field. As the birth of these plumes is random, the resulting forcing of the RZ wave field is itself a random one, exactly as an hammer which randomly strikes the upper part of the RZ. We then understand why the detection of these IGWs is more difficult than the simpler case of free bubble oscillations: once emitted by a penetrating plume, a global mode first propagates in the radiative zone while being subjected to the viscous and radiative dissipations. However, if a second plume arrives shorter afterwards, the mode pattern may be destroyed, resulting in partial interference and the corresponding frequency peak may disappear from the spectrum. In other words, the lifetime of a mode is not simply related to the diffusive processes but also to the frequency of plume penetration (as we will show in Sect. 4.2).
With this in mind, it is also clear that the classical detection method based on successive Fourier transforms both in space and time of the vertical mass flux is not well adapted to detecting IGWs in simulations with penetrative convection. The temporal Fourier transforms are computed over the whole simulation while IGWs are only present during a short time interval. This results in a mixing of wave events with non-wavy turbulent events such that the spectra lack a well defined frequency (Fig. 6, right).
4 Results
4.1 IGW identification using the anelastic subspace

We have presented in Paper I a new detection method of IGWs in hydrodynamical simulations which is based on the anelastic subspace and we will give here only its main stages. The idea is to project the simulated velocity field onto the basis built with the anelastic eigenvectors which are solutions of the following linear problem for the adiabatic perturbations (see also Dintrans & Rieutord 2001; Rieutord & Dintrans 2002)
| (7) |
where denotes the Lagrangian displacement vector (the velocity field being ), the mean density (i.e., ) and the square of the Brunt-Väisälä frequency given by
To derive the anelastic subset (7), we first filtered out the acoustic waves in the governing equations for the linear perturbations, second assumed that the time dependence of normal modes is of the form and, finally, that their horizontal dependence follows from the imposed periodicity in this direction as
The coupled differential equations (7) form a generalized eigenvalue problem of the form
| (8) |
where is the eigenvector of degree and radial order associated with the eigenvalue , while and denote two differential operators.
The profile of the Brunt-Väisälä frequency in the radiative zone is shown in Fig. 7. The g-modes spectrum is bounded by its maximum value, , while the typical frequency of a low-degree and low-order g-mode is given by , hence a nondimensional period (e.g., Turner 1973).
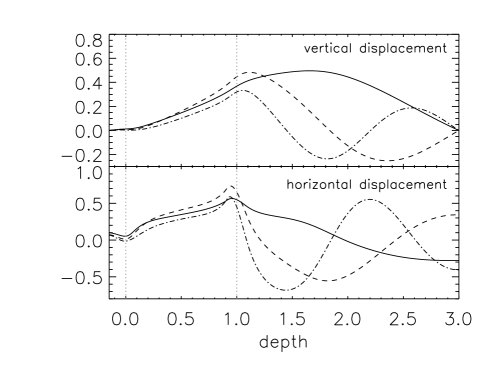
Figure 8 shows the vertical profiles of the first three anelastic eigenvectors of degree and radial orders . The associated (dimensionless) eigenvalues are and . As g-modes are evanescent in a convectively unstable layer, each eigenvector is trapped in the bottom stably stratified zone and its amplitude rapidly decreases in the convection zone, as observed for where both and stop oscillating and tend to zero.
Once the anelastic eigenvectors are computed, we can determine the amplitudes of the g-modes propagating in our simulation. Indeed, we have showed in Paper I that these eigenvectors are orthogonal to each other and form an orthogonal basis onto which the simulated velocity field can be projected as
| (9) |
where the symbol denotes a scalar product defined by
and the term “rest” contains all velocity components that are not due to IGWs (e.g., acoustic waves, convective velocities, etc). Here denotes the velocity field of degree , that is, the horizontal Fourier transform of the velocity field . We then define the amplitude of the g-mode of degree and order as the time-dependent complex coefficient
| (10) |
which corresponds to the basis coefficient for the anelastic eigenvector .
4.2 The evolution of the mode amplitudes


We show in Fig. 9 the resulting amplitudes obtained by applying our projection technique to the numerical simulation. In this figure, we have plotted the real and imaginary parts of the complex amplitude (10) for four g-modes of degrees and radial orders . When a standing gravity wave occurs in a hydrodynamical simulation, its complex amplitude behaves as
| (11) |
where is the mode eigenfrequency and a coefficient proportional to the diffusion process. For instance in the case of an excitation by an oscillating bubble dealt with in Paper I, the temporal Fourier transform of the mode amplitude leads to a single peak centered around the eigenfrequency , with a width that is proportional to the viscosity (see Fig. 6 in Paper I). In other words, each g-mode obeys in this situation the same law as that of a linearly damped free harmonic oscillator.
However, in the case of a random excitation by penetrating plumes shown in Fig. 9, the real or imaginary parts now evolve either chaotically around zero when the mode is not excited, or in a periodic fashion as or when the mode is excited. Indeed, some wave events are well visible, particularly for times in the diagram, but the time evolution is mainly chaotic, suggesting that such wave events are difficult to extract. As a consequence, taking a temporal Fourier transform over the whole simulation of the mode amplitude makes no sense as we will mix together wave and non-wave events. This is illustrated in Fig. 10 where we computed the temporal Fourier transform of the mode amplitude in Fig. 9 for and . Comparing to Paper I, single peaks centered around the theoretical eigenfrequencies have been replaced by a forest of peaks roughly centered around , i.e. the mixing of wave events with non-wave events degrades the quality of the anelastic projection. Nevertheless, we remark that the spectrum in Fig. 10 is better than the one obtained in the right-hand panel of Fig. 6 with the classical method as peaks are now concentrated around the theoretical eigenfrequency. However, such spectra do not permit a detailed study of the amplitudes of g-modes propagating in the RZ, as other contributions (e.g., convective velocities in the overshoot region as well as penetrations of downward plumes) interfere with the time evolution of each mode amplitude.
4.3 Time-frequency diagrams to extract wave events
In order to accurately extract the hidden wave events, we use time-frequency diagrams of the mode amplitude , that is, the temporal Fourier transforms are computed by using a sliding window of fixed width (e.g., Flandrin & Stockler 1999). Assuming that this width is (it is moreover beneficial to choose a multiple of the mode period), we perform the following Fourier transform at time
and thus iterate the process at the next time , being the timestep of the simulation. We then obtain a 2-D representation of the power spectrum in a time-frequency plane which highlights the time intervals during which the corresponding g-mode is really excited in the RZ.
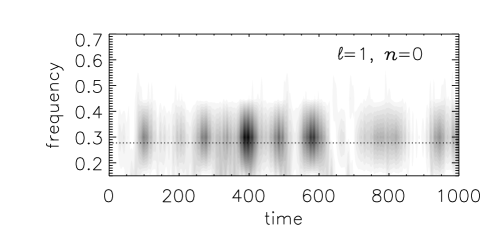
To illustrate the utility of this method, we focus on the g-mode at and before applying it to other modes; see Fig. 11. Time intervals during which this mode is excited to significant amplitudes are well extracted, as many bumps appear along the line , especially in the range where three bumps are present. In order to isolate precisely and automatically the most powerful wave events, we apply the following procedure, illustrated in Fig. 12 still with our test mode at and :
-
•
we first compute a mean profile of the time-frequency diagram around the mode frequency (shown in the upper panel).
-
•
we then build what we call the “event function ”, that is, a function which is non-zero only when the previous mean profile is higher than its mean value:
(12) and iterate the process four times by restarting from the new amplitude profile . We then obtain the final event function under a binary form (i.e. a succession of 0 and 1), shown in the middle panel in Fig. 12. Six events are clearly isolated, four of them being clustered in the range .
-
•
finally, we apply the event function to the time-dependent amplitude . It thus emphasizes the time intervals during which behaves as , that is, during which the corresponding g-mode is excited in the RZ; see the filtered real and imaginary parts of in the lower panel of Fig. 12.
\psfrag{toto}{Event function $\cal E$}\includegraphics[width=241.84842pt]{2831fg12.ps}
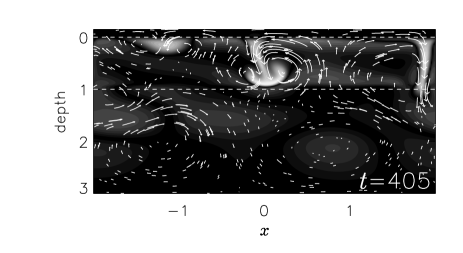
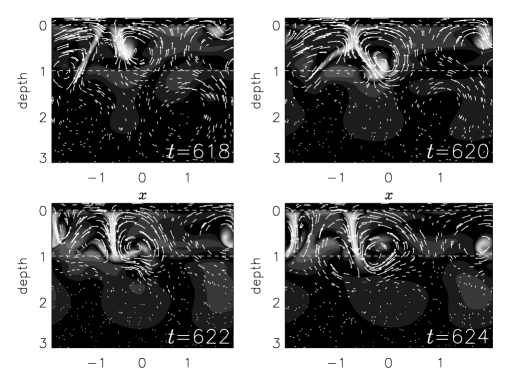
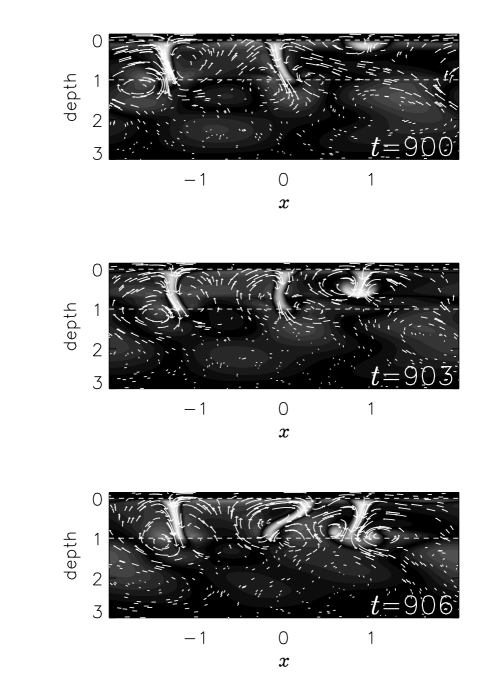
We obtain the longest wave event at and during times , which approximately corresponds to four mode periods, i.e. . This is confirmed in the snapshot of the velocity field at time where a large-scale velocity field, signature of the propagation of the g-mode at and , is present in the bottom radiative zone (Fig. 13). Now, why do modes die out? The answer lies in Fig. 14, where we plot four snapshots of the velocity field for times which correspond to the end of the events group clustered in the range . The mode pattern is simply destroyed by the penetration of a plume which is born in the upper part of the CZ at time , then crosses the CZ and enters the RZ at time where it kills the mode propagation. As a consequence, the large scale velocity field associated with the mode disappears and the event function becomes zero.
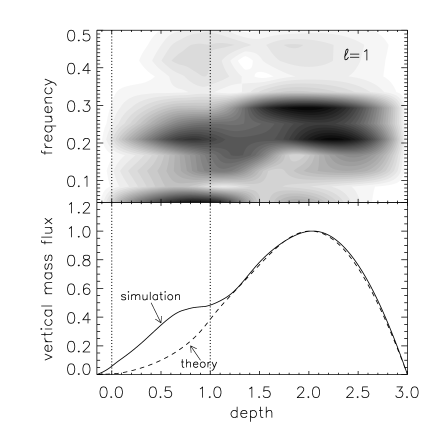
Before generalizing this formalism to more modes, it is instructive to re-apply during this longest wave event the classical method discussed in §3.1, in order to compare both the spectrum and the simulated vertical mass flux with the theoretical ones. This is what we did in Fig. 15, which is the same as Fig. 6 at except that we focus now on times . As expected, the bump around is more pronounced in the RZ (upper panel) and a comparison between the shark fin vertical profile deduced from a zoom around with the one computed from the theoretical anelastic mode shows an almost perfect agreement there (lower panel). It means that the dynamics of this region is well reproduced by our linear anelastic model. On the contrary, as g-modes cannot propagate in an unstable layer, it is normal to find a large discrepancy between these two profiles in the convection zone.


We then apply this method to the g-modes of the first three degrees and radial orders , with resulting event functions given in Fig. 16. That allows us first to show that the second bump located around in the upper panel in Fig. 15 is due to the propagation of the mode , as the corresponding event function is not zero for times . Second, the assembly of the whole event function permits us to perform a statistical study of the mode lifetimes, that is, to compute the PDF of the duration of events (Fig. 17). This PDF is peaked around 2, meaning that the lifetime of a mode is approximately twice its period. Compared to the solar acoustic modes for which 5min and , such a ratio is very small, i.e. g-modes patterns are rapidly destroyed by the following penetrating plumes and it may be a problem for their detection at the star surface.
4.4 Kinetic energy due to g-modes
Using the previous time-frequency diagrams for every g-mode allows us to find the time intervals during which IGWs propagate in the RZ. Now we want to quantify the efficiency of this stochastic excitation by using, say, some wave flux in the vertical direction. However, as we impose the reflective boundary condition for the vertical velocity both at the surface and the bottom of our computational domain, we have standing waves rather than propagating waves and no flux is carried by waves in the vertical direction. As in Paper I, we thus chose to focus on the kinetic energy embedded in g-modes using the following Parseval type relation valid in the anelastic subspace
| (13) |
where the left-hand side corresponds to the total kinetic energy in the simulation at a given time and the term “rest” contains all the contributions which are not due to IGWs (the demonstration is given in Paper I). This relation is very useful as it allows to quantify the kinetic energy embedded in every g-mode . Indeed, using the classical Parseval relation just allows one to quantify the amount of (say) kinetic energy contained in a mode of given degree and contributions coming from g-modes as well as p-modes or any turbulent motion are mixed together. The advantage of our anelastic subspace relation (13) is that it lifts this degeneracy in the radial order by isolating the g-mode contributions. Of course, this relation should be applied only during times when IGWs effectively propagate, i.e. when or , such that the contributions make sense.
The temporal evolution of the total kinetic energy embedded in the simulation (i.e. the left-hand side in Eq. 13) is illustrated as the solid line in Fig. 18a, while the dot-dashed line in the same panel corresponds to the contribution coming from g-modes only (the right-hand side sum in Eq. 13, where the and modes have been considered). The interesting quantity is of course the ratio between the two, that is , which emphasizes the efficiency of the IGW excitation by the downward plumes (Fig. 18b). It emerges that g-modes contribute up to about 40% of the total kinetic energy when they are excited, for example in the range when the mode is strongly excited. This large ratio is interesting, since it means that internal gravity waves may contain a non-negligible part of the total kinetic energy of the coupled system formed by the two neighboring convective and radiative zones. This is a direct demonstration that the excitation of IGWs by penetration plumes can be quite efficient, at least in 2-D.

5 Conclusions
We have investigated numerically the excitation of internal gravity waves by the penetration of convective plumes into an adjacent stably stratified zone. This problem is intimately related to the transport processes of chemicals and/or angular momentum in radiative zones of cool stars, such as the Sun. The knowledge of both spectrum and amplitudes of the internal waves field is crucial.
After recalling the main features of 2-D hydrodynamical simulations of penetrative convection, we focused on the problem of the mode identification by first using a classical method based on successive Fourier transforms of the vertical mass flux over the whole simulation. We thus showed that this tool is not adapted to detect the g-modes propagating in these simulations as the resulting spectra are very noisy, preventing a quantitative study of the phenomenon.
We then introduced our method for detecting accurately the internal waves in the radiative zone. It is based on the projection of the simulated velocity field onto the anelastic eigenmodes that are solutions of the associated linear eigenvalue problem for the perturbations. Indeed, when a standing wave is present near the bottom radiative zone, its spatial structure is that of an eigenmode and the coefficient of the projection onto this eigenmode gives the mode amplitude. This amplitude is of course time-dependent as the internal wave is only generated after the penetration of plumes, and is then dissipated under the action of both viscous and radiative diffusions. This leads us to use time-frequency diagrams to isolate the most powerful wave events and to construct what we called “the event function ”, that is, a binary function (0/1) which is set to 1 only when the mode amplitude is higher than a given threshold. As an example, we focused on the g-mode at and , whose period is . We extracted six wave events in our particular 2-D simulation, the longest one corresponding to four mode periods. We then showed the intricate link existing between the mode and the downward plumes as they can either excite it or destroy it!
The extension of this study to the g-modes at and allowed us to compute the PDF of the mode lifetimes. We found that the mean lifetime is only around twice the period of the mode. The shortness of this lifetime may be a problem from an observational point of view where one needs lifetimes as big as possible (the large-scale solar acoustic modes have lifetimes of about the day, i.e. several hundreds of times their mean period).
Finally, we looked at the kinetic energy content of the excited g-modes and showed that up to 40% of the total kinetic energy at times may reside in g-modes. This level is only reached during a fraction of the time, and the mode kinetic energy varies considerable with time. Nevertheless, when the modes are excited, the corresponding velocity field in the radiative zone has an amplitude that may lead to an efficient wave transport there (through the advective term ).
It is clear that our detection method allows a quantitative analysis of the problem of g-mode excitation by penetrative convection. Following this work, we have been doing a parametric study of the influence of the convective flux on the mode amplitudes, by trying to predict these amplitudes from mixing-length arguments. Some recent 2-D simulations by Kiraga et al. (2003) indeed suggest that such mixing length models systematically underestimate the strength of the internal wave field.
In the same way, the depth of the penetration in the stably stratified zone is without doubt a key parameter in the excitation mechanism by penetrative plumes. This penetration strongly depends on the local value of the Péclet number Pe: (i) large values of Pe mean that the advection is greater than the radiative diffusion such that the plume keeps its identity and is stopped very rapidly by the buoyancy braking, leading to a tiny penetration; (ii) small values of Pe mean that the plume thermalizes very rapidly with its surrounding and the buoyancy braking disappears, leading to a large penetration. It would then be interesting to further study the influence of the Péclet number on the mode amplitudes, by computing for example a grid of 2-D polytropic models with different indexes , in order to play with the Péclet number jump at the base of the convection zone (Eq. 6). Likewise, the influence of the dimensionality; i.e. the differences between 2-D and 3-D also need be investigated.
Acknowledgements.
This work has been supported by the European Commission under Marie-Curie grant No. HPMF-CT-1999-00411. Calculations were carried out on the CalMip machine of the “Centre Interuniversitaire de Toulouse” (CICT) which is acknowledged. We thank the referee (J.-P. Zahn) for his meaningful comments.Appendix A The initial stratification in the three layers
The initial vertical stratification is computed using polytropes of various indexes for which
where denotes the polytropic index. Such polytropic solutions are useful in numerical simulations of convection as they allow to easily specify the stability (or not) of a layer to convection. Indeed, the well known Schwarzschild criteria for convection are (e.g., Hansen & Kawaler 1994)
| (14) |
where and is its value in the case of an adiabatic stratification. The using of polytropic solutions leads to the following simple form for the “del”
meaning that a polytropic layer of index will be stable or unstable to convection following
| (15) |
Since , we have and in this case and a polytropic layer will be convectively stable if and unstable if .

Once the three polytropic indexes of the superposed layers have been fixed we first compute the corresponding radiative conductivity profile by assuming that all of the energy flux that we impose at the bottom is initially transported by radiation, that is,
| (16) |
in the layer (). In this formalism, the radiative conductivity is thus a constant in each layer and its three different values are joined using polynomials of the third-order.
In Fig. 19a we show an example of such a profile for a polytropic layered system with indexes and . As expected, the radiative conductivity in the CZ is below the critical value given by
that is, the value deduced from Eq. (16) using . More surprising could be the value in the surface layer as one rather expects a stably stratified layer here, as observed in solar-like stars where a very thin superficial stable layer exists. In fact, this layer is stable due to its efficient cooling [Eq. (2)] such that the Schwarzschild criterion does not apply. We thus adopt a very weak value for , by taking in all of the simulations, and compute the initial hydrostatic stratification of this layer by assuming that it is already isothermal with .
Concerning the initial stratification of the CZ, things are more involved. Assuming an initial polytropic stratification with is clearly not a good idea, as an efficient convection is always associated with an almost adiabatic stratification with . In this case, the relaxation of the CZ towards its adiabatic state would take a lot of numerical timesteps. One simple solution of this problem consists in starting from an adiabatic stratification in the CZ by imposing . However, this solution does not take into account the entropy jump which appears at the top of the CZ (the difference between constant entropy in the CZ and the entropy minimum in the photosphere; see e.g., Abbett et al. 1997; Ludwig, Freytag & Steffen 1999) such that the relaxation time would stay important.
One solution of this relaxation time problem consists in starting from a mixing length stratification where the (local) superadiabatic gradient in the CZ is modeled using the following mixing-length argument
where denotes the local sound speed, is a free mixing-length parameter and is the convective flux given by
Finally, the initial stratification of the bottom RZ is simply computed by assuming that all of the bottom flux is transported in this layer by radiation and one sets .
To summarize, the initial stratification of our three-layer model is computed from
where obeys to the following set of equations in the three layers
and these differential equations are iterated until the density at the BCZ is equal to 1; i.e. we impose .
In Fig. 19b we show the resulting vertical profile of the initial entropy for the same indexes . The solid line denotes the initial entropy whereas the dot-dashed line corresponds to its profile in the relaxed state. First, as the entropy gradient in an isothermal layer is a constant, one verifies that for . Second, the comparison between the initial and relaxed profiles shows that the mixing-length stratification well reproduces the entropy jump at the top of the CZ: the strong mixing taking place in the deep layers of the CZ leads to an almost flat entropy profile, which disappears at the base of the photosphere. As a consequence, the computing time needed to relax towards this solution is considerably reduced by using mixing-length solutions.
References
- (1) Abbett, W. P., Beaver, M., Davids, B., Georgobiani, D., Rathbun, P., & Stein, R. F. 1997, ApJ, 480, 395
- (2) Alexander, M. J. & Pfister, L. 1995, Geophys. Res. Lett., 22, 2029
- (3) Bogdan, T. J., Cattaneo, F., & Malagoli, A. 1993, ApJ, 407, 316
- (4) Brandenburg, A., Jennings, R. L., Nordlund, Å., Rieutord, M., Stein, R. F., & Tuominen, I. 1996, J. Fluid Mech., 306, 325
- (5) Bretherton, F. P. 1969, Quart. J. Roy. Meteo. Soc., 95, 213
- (6) Brown, T. M., Christensen-Dalsgaard, J., Dziembowski, W. A., Goode, P., & Gough, D. O. 1989, ApJ, 343, 526
- (7) Brummell, N. H., Clune, T. L., & Toomre, J. 2002, ApJ, 570, 825
- (8) Cattaneo, F., Brummell, N. H., Toomre, J., Malagoli, A., & Hurlburt, N. E. 1991, ApJ, 370, 282
- (9) Dintrans, B. & Brandenburg, A. 2004, A&A, 421, 775 (Paper I)
- (10) Dintrans, B., & Rieutord, M. 2001, MNRAS, 324, 635
- (11) Flandrin, P., & Stockler, J. 1999, Time-Frequency/Time-Scale Analysis (Academic Press)
- (12) Gabriel, A. H., Baudin, F., Boumier, P., et al. 2002, A&A, 390, 1119
- (13) Gough, D. O., Moore, D. R., Spiegel, E. A., et al. 1976, ApJ, 206, 536
- (14) Graham, E. 1975, J. Fluid Mech., 70, 689
- (15) Hansen, C. J., & Kawaler, S.D. 1994, Stellar interiors (New-York: Springer-Verlag)
- (16) Hurlburt, N. E., Toomre, J., & Massaguer, J. M. 1984, ApJ, 282, 557
- (17) Hurlburt, N. E., Toomre, J., & Massaguer, J. M. 1986, ApJ, 311, 563
- (18) Hurlburt, N. E., Toomre, J., Massaguer, J. M., & Zahn, J.-P. 1994, ApJ, 421, 245
- (19) Hyman, J. M. 1979, in Adv. in Computation Methods for Partial Differential Equations, Vol. III, ed. R. Vichnevetsky, & R. S. Stepleman, Publ. IMACS, 313
- (20) Iben, I. J. 1965, ApJ, 142, 1447
- (21) Kiraga, M., Jahn, K., Stȩpień, K. & Zahn, J.-P. 2003, Acta Astron., 53, 321
- (22) Kumar, P. & Quataert, E. J. 1997, ApJ, 475, L143
- (23) Kumar, P., Talon, S., & Zahn, J.-P. 1999, ApJ, 520, 859
- (24) Landau, L., & Lifshitz, E. 1980, Fluid Mechanics (Oxford: Pergamon Press)
- (25) Lele, S. K. 1992, J. Comp. Phys., 103, 16
- (26) Ludwig, H.-G., Freytag, B. & Steffen, M. 1999, A&A, 346, 111
- (27) MacGregor, K. B. & Charbonneau, P. 1999, ApJ, 519, 911
- (28) Nordlund, Å., & Stein, R. F. 1990, Comput. Phys. Commun., 59, 119
- (29) Rieutord, M. & Dintrans, B. 2002, MNRAS, 337, 1087
- (30) Schatzman, E. 1993, A&A, 279, 431
- (31) Talon, S. & Charbonnel, C. 1998, A&A, 335, 959
- (32) Talon, S., Kumar, P., & Zahn, J.-P. 2002, ApJ, 574, L175
- (33) Turck-Chièze, S., García, R. A., Couvidat, S., et al. 2004, ApJ, 604, 455
- (34) Turner, J. S. 1973, Buoyancy effects in fluids (New-York: Cambridge University Press)
- (35) Zahn, J.-P. 1991, A&A, 252, 179
- (36) Zahn, J.-P. 1994, A&A, 288, 829
- (37) Zahn, J.-P., Talon, S., & Matias, J. 1997, A&A, 322, 320