AB Aurigae Resolved: Evidence for Spiral Structure
Abstract
We obtained high angular resolution (2′′) images of the 13CO(J=10) line and 2.7 millimeter continuum emission, and slightly lower resolution images of 12CO(J=10) and C18O(J=10) line emission toward the Herbig Ae star AB Aurigae. We resolve a circumstellar disk of diameter 780 AU (FWHM) with a velocity pattern consistent with a purely rotational disk at inclination 21.5∘ and position angle 58.6∘. Using Keplerian disk models, we find a central source dynamical mass of 2.80.1 M⊙ and a cutoff radius of 615 AU for the 13CO emission. Inclination, mass, and radius determined from 12CO and C18O observations agree with those values, given optical depth and abundance effects. As a result of the high angular resolution of our observations, we confirm the existence of spiral structure suggested by near-IR scattered light images and show that the spiral arms represent density contrasts in the disk.
1 Introduction
Circumstellar disks often surround low (2 M⊙) and intermediate (2-10 M⊙) mass pre-main sequence objects, the T Tauri (TT) and Herbig Ae/Be (HAeBe) stars. Disk sizes are of order a few hundred AU with masses a few tenths of a solar mass or less (e.g. Beckwith & Sargent 1996; Natta, Grinin, & Mannings 2000). These values are similar to the proto-solar system (Weidenschilling, 1977), suggesting that they may be the sites of planet formation. Disk temperature and density profiles, key properties for understanding how planets might emerge, have been inferred from spatially unresolved observations that rely on spectral energy distributions (SEDs) and require assumptions about disk morphology (e.g. Kenyon & Hartmann 1987; Dullemond, Dominik, & Natta 2001). However, higher angular and spectral resolution measurements of the gas and dust in disks are critical to quantifying the profiles directly and providing a context in which to interpret unresolved observations. Spatially and kinematically resolved images enable measurement of stellar mass, disk mass, radius, inclination (), position angle (PA), and substructure (e.g. Koerner, Sargent, & Beckwith 1993; Dutrey et al. 1998; Simon, Dutrey & Guilloteau 2001). Such observations of multiple spectral lines in DM Tau have allowed the exploration of vertical and radial disk structure (Dartois, Dutrey, & Guilloteau, 2003).
The HAe star AB Aurigae at 144 pc (Perryman et al., 1997) has been studied by numerous authors at optical, IR and radio wavelengths. Most recently, Semenov et al. (2004, hereafter S04) based a detailed analysis on millimeter observations at 5-12” resolution. While this angular resolution is insufficient to determine a stellar mass, their model fits lead to a disk radius of 400200 AU, of 17∘, and PA of 8030∘. This inclination agrees well with estimates of 20-30∘ from near-IR interferometry and scattered light (Millan-Gabet, Schloerb, & Traub 2001; Eisner et al. 2003, 2004; Grady et al. 1999; Fukagawa et al. 2004, hereafter F04). Earlier millimeter interferometry and recent mid-IR observations at angular resolution 05 suggest 45-70∘ (Marsh et al. 1995; Mannings & Sargent 1997, hereafter MS97; Liu et al. 2004).
High resolution interferometric images of circumstellar gas can determine the inclination definitively. It is likely that early studies of the AB Aur disk at moderate angular resolution were affected by spiral structure in the disk surface (F04) or large scale (1000 AU) envelope emission (e.g. S04). Here we present high resolution (22) 2.7 mm continuum and 13CO(1-0) line images and slightly lower resolution maps of the 12CO(1-0) and C18O(1-0) emission from AB Aur. In addition to constraining the disk properties and central mass, these enable us to detect and probe the spiral features seen in the images of F04.
2 Observations and Results
Observations of AB Aur were carried out between January and May of 2004 at the Owens Valley Radio Observatory (OVRO) millimeter-wave array. Six 10.4 m antennas with cryogenically cooled SIS receivers were used in five array configurations with baselines ranging from 15 to 480 m. We configured the correlator to observe the emission lines of 13CO at 110.2 GHz and 12CO at 115.3 GHz in 64 Hanning-smoothed channels of width 125 kHz, and the C18O emission line at 109.8 GHz in 32, 250 kHz wide channels. The 12CO and C18O observations have maximum baselines of 103 and 120 m respectively. Simultaneously, we obtained 2.7 mm continuum measurements over 7 GHz of bandwidth with OVRO’s COBRA correlator (Hawkins et al., 2004). The quasars J0530+135 and 3C111 were observed at 20 minute intervals for phase and amplitude calibration. Absolute flux calibration, accurate to 10%, was based on measurements of Uranus and Neptune. Data reduction was carried out with MIR, an IDL-based package developed for the OVRO array by N. Scoville and J. Carpenter. Maps were made using MIRIAD (Sault, Teuben, & Wright, 1995).
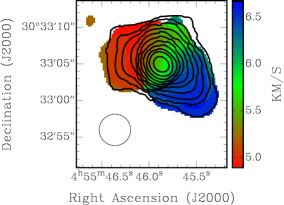
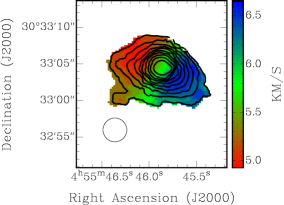
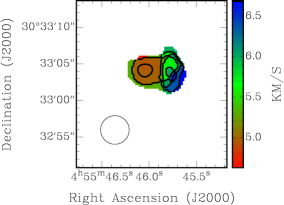
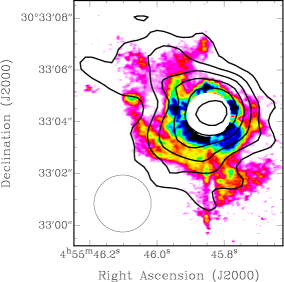
For AB Aur, Figure 1 shows contours of integrated intensity for 12CO (left panel), 13CO (center panel), and C18O (right panel) emission at resolutions 425, 325, and 39, respectively overlaid on intensity-weighted mean velocity maps (color). Integrated line fluxes for 12CO, 13CO, and C18O are 22.1, 3.3 and 0.78 Jy km s-1 over the velocity ranges 7.67 to 4.27, 7.51 to 4.25, and 7.37 to 4.63 km s-1, respectively. Outside these ranges, no emission was detected above the 3 level (360, 105, and 72 mJy/beam for 12CO, 13CO, and C18O respectively). We combined our 13CO dataset with that of MS97 (re-reduced using MIR) to provide greater sensitivity and found the 13CO flux agrees with that of MS97, within the uncertainties. To emphasize global spatial and velocity structure, the images were restored with circular beams equal in area to the naturally weighted beams. It is immediately evident that the 12CO and 13CO emission is resolved and the velocity varies smoothly across the maps. Due to lower sensitivity and poorer velocity resolution, the C18O image is barely resolved and the velocity pattern is sufficiently distorted to make analysis difficult.
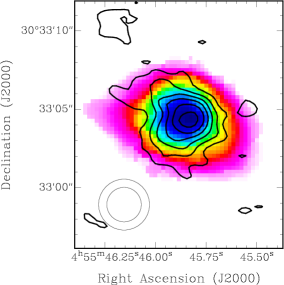
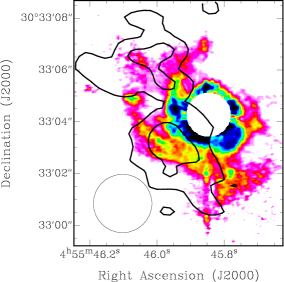
In the left panel of Figure 2, contours of 2.7 mm continuum emission at resolution 22 are overlaid on the color image of 13CO integrated intensity for AB Aur. Line and continuum emission peaks are spatially coincident to within 03. The optically thin nature of the 2.7 mm emission results in a direct relationship of disk mass to flux, Md=100. Following MS97, we calculate the disk mass using this expression and the 11.5 mJy 2.7 mm flux, assuming a gas to dust mass ratio of 100 and =0.009 cm2g-1 at 2.7 mm. Adopting a temperature of 40 K, we derive Md=0.009 M⊙ with a factor of a few uncertainty. S04 obtained a similar value, Md=0.013 M⊙, with a factor of 7 uncertainty. The center panel of Figure 2 displays our 2.7 mm continuum contours overlaid on the near-IR scattered light image of F04, based on which they suggest spiral structure. While the scattered light images trace small amounts of material, our 2.7 mm image demonstrates that the spiral features are massive and represent density contrasts, as the 2.7 mm flux directly traces the mass. The three most intense scattered light features are detected at least at the 3 level of significance in 2.7 mm continuum, while the strong northern and southeastern scattered light arms are at better than the 5 level. These northern and southeastern features are more obvious in the right panel of Figure 2. There, the symmetric central core of the continuum image, containing more than 75% of the total flux, has been subtracted to enhance the outer regions. Given the uncertainties in the symmetric source fit, the resulting northeastern and southeastern asymmetry residuals provide between 5% and 11% and 7% to 14% of the total emission, respectively; residual peak locations are uncertain by less than 04, and emission peaks are at least at the 3 level.
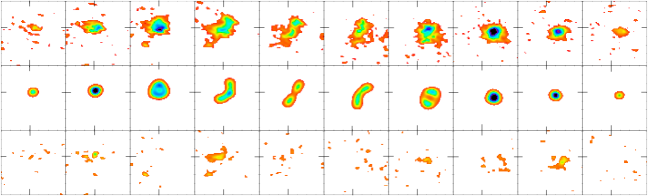
The smooth velocity gradient in the middle panel of Figure 1 suggests that material is bound to the star and executes Keplerian orbits, a hypothesis supported by S04. The top panel of Figure 3 displays the morphology of the 13CO emission in velocity intervals of width 0.34 km s-1. The resolution of these robustly weighted maps, 22 18, is almost a factor of three better than achieved by MS97 and S04, as is the signal-to-noise ratio. Continuum resolution and signal-to-noise are similarly improved. Robust weighting allows us to emphasize small scale features in individual velocity bins as opposed to global characteristics. Enhanced resolution and sensitivity enable a detailed comparison of the line emission at different velocities with that expected from models. The model consists of a flat, Keplerian disk with a single component power law emission profile and an outer radius cutoff. The emission profile was fit empirically and the emission was binned by line-of-sight velocity and convolved with the 2218 beam. The observed emission was subtracted from the model and the goodness of fit was measured with a difference squared merit function. Our best fit model and 2 clipped residuals are presented in the middle and bottom panels of Figure 3. Our interpretation relies entirely on the 13CO fit. Given the poorer angular and spectral resolution of the 12CO and C18O observations, model fits for those lines were used as consistency checks only. The upper section of Table 1 lists the best fit parameters for each spectral line.
The best fit dynamical mass for the 13CO data is 2.80.1 M⊙. Disk radius, inclination, and PA are 615 AU, 21.5∘ and 58.60.5∘ respectively. The emission profile has form mJy inside a radius of 615 AU. Results for the 12CO and C18O are reasonably consistent. We discuss any large discrepancies below. Estimates using other methods to obtain , PA and disk radius are shown in the lower section of Table 1. The uncertainties quoted throughout this work are purely statistical estimates, do not include possible errors in the distance, and are 3 for our model fits and 1 for other methods. If the velocity pattern is not Keplerian the errors on all disk parameters except radius could be substantially larger. Disk radius is more correlated with the assumed emission profile.
3 Discussion
Our resolved images of the gas and dust emission from AB Aur enable us to go beyond earlier millimeter observations at lower resolution and determine a central mass of 2.80.1 M⊙. This dynamical mass is only a little higher than the 2.40.2 M⊙ obtained from photometry and pre-main sequence track fitting (van den Ancker, de Winter, & Tjin A Djie, 1998). Our dynamical model results in several local minima but these are significantly, statistically deviant (20) from the global minimum value. Our best fit values of , PA, and disk radius (see Table 1) are more accurate than those derived by S04 from lower resolution data and more complex models, and well within their uncertainties.
Large scale envelope emission, present for r600 AU (S04), may contaminate more optically thick CO emission. The best fit 12CO emission profile described in Table 1 indicates structure extending to beyond 1000 AU and flux ratios of CO isotopomers show that 12CO is optically thick. Given this, the high reduced value (7) for our 12CO model fit is not surprising and demonstrates that a pure disk model does not fit the 12CO emission. The largest deviation of 13CO from the model (4.5) occurs in the second velocity bin (see Figure 3). The deviation is hardly significant and could be due to a number of factors including local density enhancement, a flared disk surface, etc. A detailed discussion of these is beyond the scope of this work, but there may be some evidence of disk flaring in the top panel of Figure 3 where the southern lobe of emission in bins 4 through 7 splits into two pieces. Given that the 13CO observations fit the pure disk model much better than 12CO and there is known contamination in the 12CO emission, discrepancies between disk properties derived from 12CO and 13CO can be wholly attributed to this effect, increasing our confidence in the 13CO values.
The model fits to mass and based on 13CO and C18O emission are consistent within the errors and the difference in radii is not unexpected given the relatively low abundance of C18O. Our PA determinations are consistent with most published values. Inclinations in the upper section of Table 1 are consistent with near-IR interferometry results (Millan-Gabet et al. 2001; Eisner et al. 2003, 2004) for the inner 1 AU of the disk, and with outer disk values from S04. We checked our model values by calculating using only the separation of the extreme velocity emission and, as Table 1 shows, again find good agreement. However, values determined from axis ratios in the visibility plane are systematically higher than the velocity based methods. Recent determinations of i45-65∘ and PA3015∘ by Liu et al. (2004) from mid-IR adaptive optics observations with nulling interferometry, agree less well with our model derived values, and their inclination is much closer to the larger, axis-ratio-determined values of Table 1. We believe that discrepancies between the values of inclination and position angle derived by different methods are probably due to assumptions about AB Aur symmetry.
S04 and F04 demonstrate that the assumption of symmetry is invalid, as do our millimeter observations. The spiral structure, initially suggested by F04 and demonstrated to be a density contrast through this work (see Figure 2), is a major source of asymmetry. If spiral structure is present and streaming motions along the arms are significant, the gas distribution could be tightened along the arm, resulting in foreshortening perpendicular to that direction. Whether inclination increases or decreases depends on source geometry. In either case, the PA will be biased toward the direction of the long axis of the spiral arm. Spiral structure could also affect the and PA values determined from velocity structure, depending on the strength of the features and the optical thickness of the line; more optically thin emission features would experience greater influence from such local density enhancements. Sub-Keplerian rotation will generally result in larger inclinations for velocity determined methods with fixed mass, but a simple gas pressure aided sub-Keplerian disk is probably too simplistic an assumption if streaming motions are altering the bulk of the gas motion along the arms.
Our observations show two effects that could be due to the influence of spiral structure: 1) the model fit to the optically thin C18O line leads to a significantly greater PA than does the 13CO fit. The direction of change of the PA is along the strong southeastern arm as would be expected if local streaming velocities were playing a role; 2) in the left panel of Figure 2, the 13CO emission spreads well beyond the boundaries of the continuum emission in the northeast and southwest but has similar extent in the southeast. If spiral structure is changing gas morphology it would cause larger spatially determined inclinations and PAs thereby explaining the higher inclinations estimated from axis ratios. We conclude that the range of published values of inclination and PA can be explained by the presence of substructure. The values derived from our kinematic models may be influenced by this substructure, but we do not expect the effects to be great.
The wealth of observations of AB Aur at different wavelengths and at different spatial and spectral resolutions enables analysis of this complicated circumstellar disk from the inner 1 AU (e.g. Eisner et al. 2004) to the outer envelope beyond 1000 AU (e.g. S04). Our detailed observations give an accurate dynamical mass and resolve issues about and PA, indicating that apparent inconsistencies are due to asymmetry. Our high resolution images in 2.7 mm continuum and 13CO and C18O gas emission, show evidence of spiral structure. Such structure has important implications for planet formation. If it is due to instability and persists long enough or is sufficiently strong, local collapse can occur, quickly forming large planets (Boss 2002; Pickett et al. 2003 and references therein). Alternatively, if the instability dissipates or the structure is due to existing planets (Bate et al., 2003), the increase in local density may increase the cross section for collisions of planetesimals and speed up the core accretion process (Rice et al., 2004).
References
- Bate et al. (2003) Bate, M. R., Lubow, S. H., Ogilvie, G. I., & Miller, K. A. 2003, MNRAS, 341, 213
- Beckwith & Sargent (1996) Beckwith, S. V. W. & Sargent, A. I. 1996, Nature, 383, 139
- Boss (2002) Boss, A. P. 2002, ApJ, 576, 462
- Dartois, Dutrey, & Guilloteau (2003) Dartios, E., Dutrey, A. & Guilloteau, S. 2003, A&A, 399, 773
- Dullemond, Dominik, & Natta (2001) Dullemond, C. P., Dominik, C., & Natta, A. 2001, ApJ, 560, 957
- Dutrey et al. (1998) Dutrey, A., Guilloteau, S., Prato, L., Duvert, G., Schuster, K., & Menard, F. 1998, A&A, 338, L63
- Eisner et al. (2003) Eisner, J. A., Lane, B. F., Akeson, R. L., Hillenbrand, L. A., & Sargent, A. I. 2003, ApJ, 588, 360
- Eisner et al. (2004) Eisner, J. A., Lane, B. F., Hillenbrand, L. A., Akeson, R. L., & Sargent, A. I. 2004, ApJ, 613, 1049
- Fukagawa et al. (2004) Fukagawa, M. et al. 2004, ApJ, 605, L53
- Grady et al. (1999) Grady, C. A., Woodgate, B., Bruhweiler, F. C., Boggess, A., Plait, P., Lindler, J., Clampin, M., & Kalas, P. 1999, ApJ, 523, L151
- Hawkins et al. (2004) Hawkins, D. W., Woody, D. P., Wiitala, B., Fredsti, J. & Rauch, K. P. 2004, Proc. SPIE, 5498, 567
- Kenyon & Hartmann (1987) Kenyon, S. J. & Hartmann, L. 1987, ApJ, 323, 714
- Koerner, Sargent, & Beckwith (1993) Koerner, D. W., Sargent, A. I., & Beckwith, S. V. W. 1993, Icarus, 106, 2K
- Liu et al. (2004) Liu, W. M., Hinz, P. M., Hoffmann, W. F., Brusa, G., Miller, G., & Kenworthy, M. A. 2004, ApJ, in press
- Mannings & Sargent (1997) Mannings, V. & Sargent, A. I. 1997, ApJ, 490, 792
- Marsh et al. (1995) Marsh, K. A., van Cleve, J. E., Mahoney, M. J., Hayward, T. L., & Houck, J. R. 1995, ApJ, 451, 777
- Millan-Gabet, Schloerb, & Traub (2001) Millan-Gabet, R., Schloerb, F. P., & Traub, W. A. 2001, ApJ, 546, 358
- Natta, Grinin, & Mannings (2000) Natta, A., Grinin, V. P., & Mannings, V. 2000, Protostars and Planets IV, ed. V. Mannings, A. P. Boss, & S. S. Russell (Tucson: University of Arizona Press), 559
- Perryman et al. (1997) Perryman, M. A. C. et al. 1997, A&A, 323, 49
- Pickett et al. (2003) Pickett, B. K., Mejia, A. C., Durisen, R. H., Cassen, P. M., Berry, D. K. & Link, R. P. 2003, ApJ, 590, 1060
- Rice et al. (2004) Rice, W. K. M., Lodato, G., Pringle, J. E., Armitage, P. J., & Bonnell, I. A. 2004, MNRAS, 355, 543
- Sault, Teuben, & Wright (1995) Sault, R. J., Teuben, P. J., & Wright, M. C. H. 1995, in ASP Conf. Ser. 77, Astronomical Data Analysis Software and Systems IV, ed. R. A. Shaw, H. E. Payne, & J. J. E. Hayes (San Francisco: ASP), 433
- Semenov et al. (2004) Semenov, D., Pavlyuchenkov, Ya., Schreyer, K., Henning, Th., Dullemond, K., & Bacmann, A. 2004, ApJ, in press
- Simon, Dutrey & Guilloteau (2001) Simon, M., Dutrey, A. & Guilloteau, S. 2001, ApJ, 545, 1034
- van den Ancker, de Winter, & Tjin A Djie (1998) van den Ancker, M. E., Winter, D., & Tjin A Djie, H. R. E. 1998, A&A, 330, 145
- Weidenschilling (1977) Weidenschilling, S., J. 1977, Ap&SS, 51, 153
| Line | Mass | Radius | Inclination | Position Angle | Method |
|---|---|---|---|---|---|
| M⊙ | AU | Degrees | Degrees | ||
| 13CO | 2.80.1 | 615 | 21.5 | 58.60.5 | Model |
| C18O | 2.77 | 497 | 21.4 | 752 | Model |
| 12CO | 3.25 | 106010 | 32.5 | 613 | Model |
|
13CO |
2.79 | N/A | 244 | 698 | Extreme Velocity |
| C18O | 2.79 | N/A | 176 | 7321 | Extreme Velocity |
| 12CO | 2.79 | N/A | 269 | 6625 | Extreme Velocity |
| 13CO | N/A | 39015 | 335 | 8510 | UV Plane |
| 12CO | N/A | 50013 | 413 | 264 | UV Plane |
| Dust | N/A | 17017 | 4412 | 7919 | UV Plane |
Note. — Dust is the 2.7 mm continuum emission. Error bars are 1 for all but the line model where errors are 3. Radii are HWHM values except for the line models where they represent outer edges of the disk. Emission profile for the line model was of the form S=S0()-k mJy for rRout. Values of (S0,k) are (48.4,1.280.04), (13.4,1.30), and (1502,1.10.1) for 13CO, C18O, and 12CO respectively.