The Colours of Elliptical Galaxies
Abstract
We have compiled a sample of 2728 nearby () elliptical galaxies with photometry in the bands from the Sloan Digital Sky Survey (SDSS) and photometry from the Two Micron All Sky Survey (2MASS). Stellar masses, stellar velocity dispersions and structural parameters such as sizes and surface mass densities are also available for these objects. In order to correct the aperture mismatch between SDSS and 2MASS, we correct the SDSS magnitudes to the isophotal circular radius where the 2MASS magnitudes are measured. We compare the correlations between optical, optical-infrared and infrared colours and galaxy luminosity, stellar mass, velocity dispersion and surface mass density. We find that all galaxy colours correlate more strongly with stellar mass and velocity dispersion than with any other structural parameter. The dispersion about these two relations is also smaller. We also study the correlations between a variety of stellar absorption line indices and the same set of galaxy parameters and we reach very similar conclusions. Finally, we analyze correlations between absorption line indices and colour. Our results suggest that the optical colours of elliptical galaxies are sensitive to a combination of age, metallicity and -enhancement, while the optical-infrared colours are sensitive to metallicity and to -enhancement, but are somewhat less sensitive to age.
keywords:
1 Introduction
It is well known that the observed properties of elliptical galaxies obey a number of tight relations: the most well-studied of these are the colour-magnitude relation (CMR), the fundamental plane and the Mg- relation (, Faber & Jackson 1976; Visvanathan & Sandage, 1977; , Dressler et al. 1987; , Djorgovski & Davis1987; Bower et al., 1992; Ellis et al., 1997; Bernardi et al., 2003a, b, c, d). These correlations link the properties of the stellar populations of early-type galaxies with their masses and their structural properties and are believed to encode important information about how early-type galaxies formed.
It has long been known that early-type galaxies in nearby clusters exhibit a tight colour-magnitude relation, i.e. more luminous ellipticals have redder colours than less luminous ellipticals (Visvanathan & Sandage, 1977; Bower et al., 1992). This work has been extended to moderate redshift and it is found that there is no significant change in the slope with redshift (Aragon-Salamanca et al., 1993; Stanford et al., 1995, 1998; Ellis et al., 1997; Kodama et al., 1998; Holden et al., 2004). The zero-point of the relation shows modest colour evolution, consistent with the passive ageing of a stellar population formed before . Furthermore, the slope of the CMR of ellipticals has been found to show little dependence on environment (Terlevich et al., 2001; Bernardi et al., 2003d; Hogg et al., 2004).
The origin of the CMR is still a matter of controversy. The conventional interpretation of the CMR is that it is primarily a metallicity effect (Faber, 1977; Dressler, 1984; Arimoto & Yoshii, 1987; Kodama & Arimoto, 1997; Ferreras et al., 1999). It is often assumed that elliptical galaxies form monolithically in a single giant burst of star formation at high redshift. Since the binding energy per unit mass of gas is higher in more massive galaxies, they are able to retain their gas for longer and so reach higher metallicities than less massive galaxies (Larson, 1974; Arimoto & Yoshii, 1987; Bressan et al., 1996; Kodama & Arimoto, 1997). Kauffmann & Charlot (1998) and De Lucia et al. (2004) have argued that the CMR can also be explained in hierarchical models of galaxy formation when strong feedback is included. In these models, the CMR for elliptical galaxies arises because large ellipticals form by mergers of massive, metal-rich progenitor disk systems. Indeed, some evidence of that build-up in the early-type galaxy population has been observed (Chen et al., 2003; , Bell et al. 2004; Cross et al., 2004; Ferreras et al., 2005). However, it is also possible to explain at least part of the CMR as an increase in mean stellar age with luminosity (Worthey, 1996; Ferreras et al., 1999). Furthermore, Jørgensen (1999) and Trager et al. (2000) find strong evidence for a significant intermediate-age population in some elliptical galaxies.
Additional information about stellar populations can be gained by studying the strength of stellar absorption features in galaxy spectra. The standard way of quantifying absorption line strengths in galaxies is via the Lick-IDS system, which includes 25 spectral absorption features defined by a ‘feature’ bandpass and two ‘pseudo-continuum’ bandpasses. The indices are calibrated using the spectra of 460 Galactic stars over the wavelength range from 4000Å to 6400Å. The sensitivities of different Lick indices to stellar age and metallicity have been discussed in a number of papers (Burstein et al., 1984; Gorgas et al., 1993; Trager et al., 1998; Henry & Worthey, 1999). The H-Balmer lines are primarily age-sensitive. Likewise, the 4000Å break (i.e. the ratio of the flux blueward and redward of 4000Å) gets stronger with age, but for old stellar populations, it shows also a second-order sensitivity to metallicity. Indices which are primarily sensitive to metallicity include Fe and Mg lines between 4500Å and 5700Å and molecular features such as the TiO band. In massive elliptical galaxies, the abundance of -elements with respect to Fe-peak elements can differ from the scaled-solar abundance ratio (Worthey et al., 1992). Indices which trace the abundance of either -elements or Fe-peak elements can therefore be sensitive to the degree of -enhancement (Thomas et al., 2003).
In addition to correlations with galaxy luminosity, past studies of elliptical galaxies have also focused on how colours and absorption line indices depend on the stellar velocity dispersion of the galaxy. To first order, both the luminosity and the velocity dispersion of an elliptical are measures of its mass; the luminosity measures the mass contained in stars and the velocity dispersion is a dynamical probe of the total mass contained within some radius. The star formation history of a galaxy, however, may not depend primarily on its mass. Indeed, Kennicutt (1998) has shown that star formation rates in spiral galaxies correlate best with the local surface density of gas and a law of the form provides a good fit to the data. Bell & de Jong (2000) studied trends in the optical and infrared colours of a sample of nearby spiral galaxies and found that the colours most sensitive to star formation history correlate best with stellar surface density. Furthermore, Kauffmann et al. (2003b) studied the relations between stellar mass, star formation history, size and internal structure of a complete sample of galaxies and found that the relation for the late-type galaxies can be well described by a single power law. They also found that the star formation history of low-mass galaxies are correlated more strongly with surface density than stellar mass. These results suggest that local rather than global factors regulate the rate at which spiral galaxies form their stars at the present day. Motivated by the surface density dependence of spiral star formation histories, it seems worthwhile to search for surface density dependence in the properties of early-type galaxies.
Finally, in a recent work Eisenstein et al. (2003) studied how the average optical spectra of massive galaxies in the SDSS vary as a function of both luminosity and environment. They found that as redshift, luminosity and environment change, the variation of pairs of Lick Indices appears to follow a simple one-dimensional locus, suggesting that variations in these three parameters do not lead to independent changes in the spectra of elliptical galaxies.
In this paper, we present the correlations between the colours of elliptical galaxies and a range of different structural parameters. We make use of data from the Sloan Digital Sky Survey (SDSS) and the Two Micron All Sky Survey (2MASS) to construct a sample of early-type galaxies with photometry in five optical () and three near-infrared bands J (1.25m), H (1.65m), (2.17m) bands. Stellar velocity dispersions and size measurements for these systems are available from the SDSS database and estimates of stellar mass are taken from the work of Kauffmann et al. (2003a). The outline of the paper is as follows. Section 2 describes how our sample is selected, the method adopted for doing the aperture correction and calculating (K+E)-correction of magnitudes. Section 3.1 presents the correlations between optical, optical-infrared, infrared colours and structural parameters. In section 3.2, we study the relations between colours and a variety of Lick indices. Finally, in section 4 we summarize our findings and give our conclusions.
2 The sample
2.1 Sample selection
The SDSS is an imaging and spectroscopic survey of the high Galactic latitude sky visible from the Northern hemisphere, which will obtain u, g, r, i and z photometry of almost a quarter of the sky and spectra of at least 700,000 objects (York et al., 2000). A description of the software and data products are given in Stoughton et al. (2002) and Abazajian et al. (2003, 2004). The 2MASS is a ground-based, near-infrared imaging survey of the whole sky and its extended source catalog (XSC) contains almost 1.6 million galaxies (Jarrett et al., 2000a, b). We positionally match sources observed by the 2MASS to galaxies in the ‘main’ spectroscopic sample of the SDSS Data Release One (DR1; Abazajian et al. 2003). Galaxies in this sample have . Practically all 2MASS sources in the DR1 area (% for extended sources from the XSC) are matched to an SDSS counterpart within 2 arcsec. We restrict our analysis to a narrow range of redshift in order to minimize uncertainties introduced by K-corrections. The entire matched sample contains 8166 galaxies in this range of redshift.
In this paper, we focus on early-type galaxies. To select these systems, we require that they have 4000 Å break strength greater than 1.6 (we adopt the narrow definition of the break given in Balogh et al., 1999) and concentration parameter (where and are the radii enclosing 90% and 50% of the total Petrosian light of the galaxy). Kauffmann et al. (2003b) have shown that this cut separates massive, dense, early-type galaxies from low mass, low density late-type systems. In order to exclude systems with ongoing star formation or residual AGN activity, we also eliminate all galaxies where the equivalent width of the H emission line is greater than 2 Å . Our final sample contains 2728 early-type galaxies.
2.2 Photometric quantities and aperture corrections
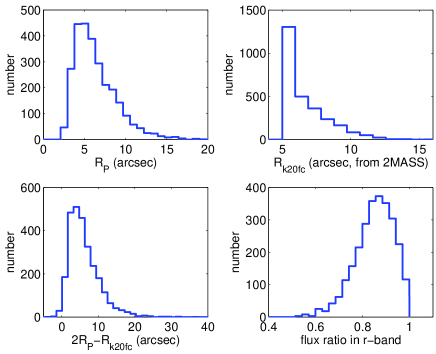
In order to compare optical and optical-infrared colours, it is important that both SDSS and 2MASS magnitudes are measured within the same aperture. There are several sets of magnitudes provided in the 2MASS XSC: elliptical isophotal magnitudes, circular isophotal magnitudes, total magnitudes using a Kron elliptical aperture, total magnitudes from extrapolating the fit to the radial profile and magnitudes within fixed circular apertures (5, 7, 10, 15 arcsec ). In this paper, we use the isophotal fiducial magnitudes, which are measured within the circular aperture corresponding to a surface brightness of 20.0 mag arcsec-2 in the -band (the aperture is denoted as ). At this isophotal magnitude, the background noise is still relatively low, but the aperture is large enough to enclose most of the light from the galaxy (see the 4th panel of Figure 1). This set of magnitudes are measured with the same size aperture in all three () 2MASS bands and they thus provide a consistent set of infrared colours.
SDSS provides the azimuthally averaged surface brightness in a series of circular annuli. In order to derive optical-infrared colours, we have calculated magnitudes that are matched to the 2MASS measurements by interpolating the cumulative radial surface brightness profile in each SDSS band at the corresponding isophotal radius . From now on, we refer to these corrected magnitudes as the “SDSS magnitudes” and they are used to estimate the optical and optical-infrared colours throughout the paper.
In Fig. 1 we plot the distribution of the -band Petrosian radius (from SDSS), the isophotal radius (from 2MASS), the quantity , and the -band flux within divided by the Petrosian flux. A small fraction of galaxies (about 1.2 percent) have isophotal radius larger than . We simply adopt the Petrosian magnitudes for these galaxies and make no aperture correction. Fig. 1 shows that for most galaxies, a large fraction of Petrosian flux is contained within . Because colour gradients are small for early-type galaxies (Wu et al., 2005), it is safe to treat the colours deduced from the corrected SDSS magnitudes as a global galaxy colours.
Stellar mass estimates for this sample are available from the work of Kauffmann et al. (2003a). To estimate stellar masses, two stellar absorption line indices, the 4000Å break strength and the Balmer absorption line index H, are used to constrain the mean stellar age of a galaxy and the fraction of its stellar mass formed in bursts over the past few Gyr. A comparison with broad band magnitudes then yields estimates of dust attenuation and of stellar mass. The optical photometric quantities, such as Petrosian magnitudes in 5 bands, size , concentration parameter , are obtained from the First Data Release (DR1) of the SDSS (Abazajian et al., 2003). Velocity dispersion measurements for each galaxy are also available from the database and are described in Schlegel et al (in preparation).
Throughout the paper, we assume a cosmology with , and =70 km s-1 Mpc-1.
| slope (g-r) | -0.0247 | 0.0681 | 0.1869 | 0.1957 | 0.0635 | 0.0131 |
|---|---|---|---|---|---|---|
| slope (r-i) | -0.0115 | 0.0378 | 0.0913 | 0.1030 | 0.0341 | 0.0081 |
| slope (r-z) | -0.0216 | 0.0732 | 0.1910 | 0.2111 | 0.0809 | 0.0239 |
| slope (r-J) | -0.0488 | 0.1392 | 0.3521 | 0.4194 | 0.1442 | 0.0335 |
| slope (r-K) | -0.0731 | 0.1885 | 0.4586 | 0.5613 | 0.1683 | 0.0294 |
| slope (J-K) | -0.0182 | 0.0553 | 0.1202 | 0.1347 | 0.0259 | -0.0053 |
| disp (g-r) | 0.0330 | 0.0295 | 0.0292 | 0.0294 | 0.0334 | 0.0359 |
| disp (r-i) | 0.0218 | 0.0199 | 0.0201 | 0.0198 | 0.0216 | 0.0228 |
| disp (r-z) | 0.0395 | 0.0354 | 0.0352 | 0.0345 | 0.0378 | 0.0406 |
| disp (r-J) | 0.0783 | 0.0724 | 0.0738 | 0.0712 | 0.0781 | 0.0829 |
| disp (r-K) | 0.1090 | 0.1006 | 0.1043 | 0.1008 | 0.1110 | 0.1160 |
| disp (J-K) | 0.0748 | 0.0739 | 0.0743 | 0.0743 | 0.0752 | 0.0754 |
| 1.6415 | 2.6352 | 2.6681 | 2.6968 | 1.4901 | 0.3832 | |
| 1.1583 | 2.1710 | 1.8933 | 2.1121 | 1.2357 | 0.3730 | |
| 1.1963 | 2.3589 | 2.2635 | 2.4747 | 1.6759 | 0.6165 | |
| 1.3642 | 2.1905 | 1.9905 | 2.3839 | 1.4465 | 0.4235 | |
| 1.4701 | 2.1357 | 1.8351 | 2.2543 | 1.1886 | 0.2655 | |
| 0.5338 | 0.8542 | 0.6748 | 0.7345 | 0.2701 | -0.0732 | |
| 0.3509 | 0.5021 | 0.5045 | 0.5125 | 0.3223 | 0.0889 | |
| 0.2675 | 0.4566 | 0.4038 | 0.4419 | 0.2830 | 0.0899 | |
| 0.2680 | 0.4730 | 0.4518 | 0.4842 | 0.3592 | 0.1418 | |
| 0.2961 | 0.4395 | 0.4071 | 0.4704 | 0.3131 | 0.0973 | |
| 0.3202 | 0.4294 | 0.3825 | 0.4542 | 0.2637 | 0.0615 | |
| 0.1177 | 0.1861 | 0.1479 | 0.1609 | 0.0599 | -0.0163 |
2.3 (K+E)-correction
When converting from the apparent magnitude to the rest-frame absolute magnitude of an object, the fact that the SDSS and 2MASS filters measure the light from a fixed spectral range in the local frame needs to be taken into account. Correcting for this effect is known as the K-correction. The E-correction accounts for the change in the galaxy’s luminosity between the time that its light was emitted and the present day. In this paper, the sum of K-correction and E-correction is denoted as the (K+E)-correction.
In order to evaluate these corrections, we generate a grid of model spectral energy distributions (SEDs) using the population synthesis models of (Bruzual & Charlot, 2003, BC03). We adopt the universal initial mass function from Chabrier (2003) and lower and upper mass cut-offs are taken as =0.1M⊙ and =100M⊙, respectively. We parameterize the models according to a metallicity and the star formation timescale . Galaxies form stars according to the equation
| (1) |
for a total duration of 12 Gyr. The effect of extinction on the SEDs is not included, because the dust attenuation measurements of Kauffmann et al. (2003a) show that there is very little dust in these systems. For each model, we store observer frame colours at a series of closely spaced redshifts from z=0.08 to z=0.02. For each galaxy in our sample, we find the model that most closely reproduces its observed colours (including , , , , and ) and we use the model to transform to colours and magnitudes defined at z=0.04. Because of the very limited range of redshifts of the galaxies in our sample, these colour corrections are small: 0.04 mag for , 0.01 mag for and , 0.03 mag for , 0.05 mag for and 0.02 mag for on average.
3 Results
3.1 Relations between colours and structural parameters
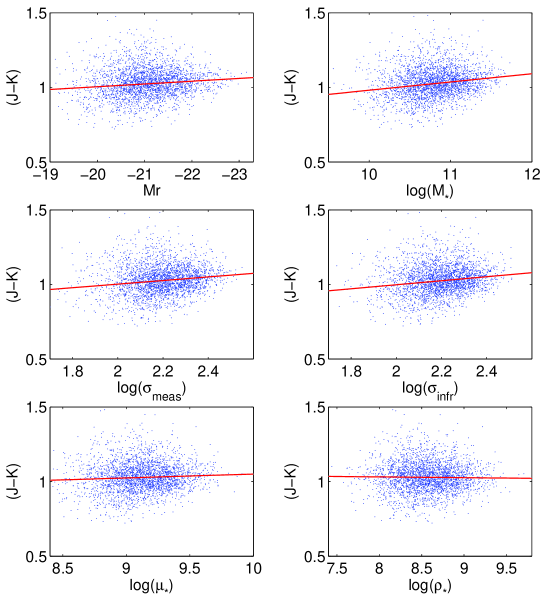
In this section, we present the correlations of the optical, optical-infrared and infrared colours of the ellipticals in our sample with the following parameters:
-
1.
absolute -band magnitude, (Note that we use Petrosian magnitudes to calculate );
-
2.
stellar mass ;
-
3.
measured stellar velocity dispersion ;
-
4.
“inferred” stellar velocity dispersion: , where was chosen so that the average value of for all the galaxies in the sample would be equal to the average value of for the same set of galaxies (we find );
-
5.
stellar surface mass density ;
-
6.
stellar mass “density” .
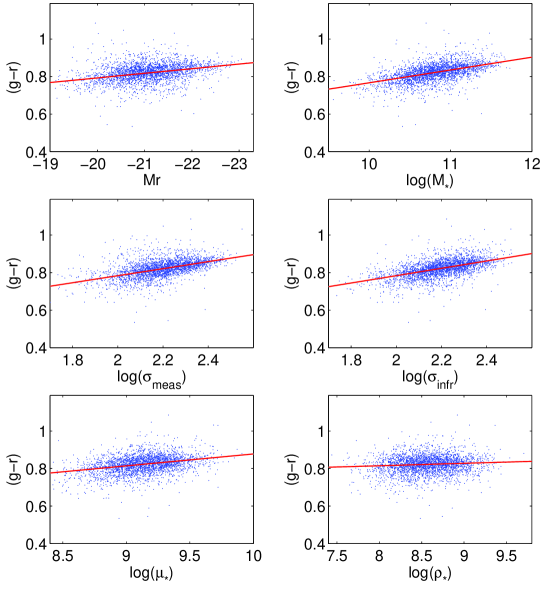
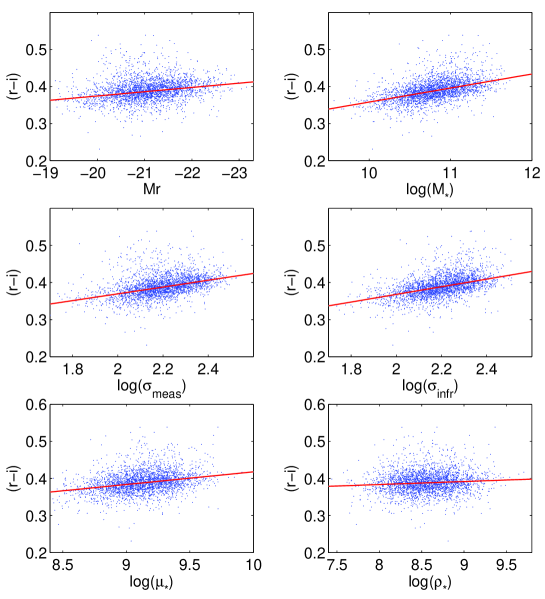
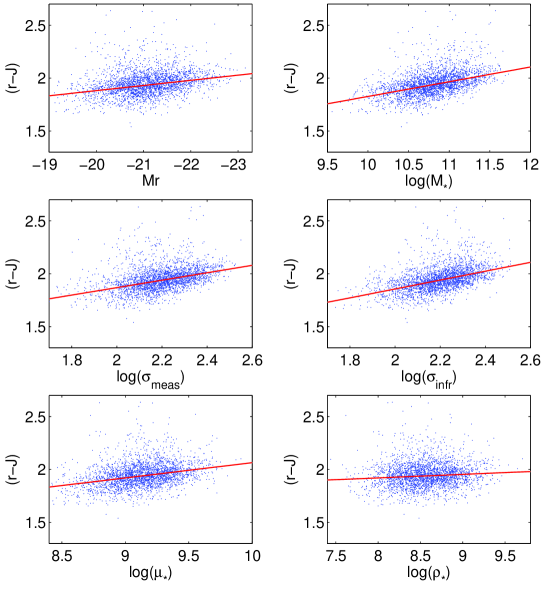
where is the radius enclosing 50 percent of Petrosian flux in -band (and hence approximately 50 percent of the stellar mass). 111We also tried different measurements of z-band half-light radius including the seeing deconvolved Sersic and Petrosian half-light radii derived by Blanton et al. (2003). We obtained almost identical results. In this paper, the parameters , , , , are in units of M⊙, km/s, km/s, M⊙/kpc2 and M⊙/kpc3, respectively. The results are presented in Figures 2-5, where we show the correlations between , , and colours as a function of these parameters. We find that a simple least-squares fit to the data is sensitive to whether or not we exclude galaxies that lie far away from the main relations. We thus switched to robust techniques and we fit a straight line to the data by minimizing the absolute deviations. This is shown as a solid line on the plots.
Table 1 lists the parameters of the fits. The first set of quantities are the best-fit slopes. The second set of quantities give the dispersions about the relation, which we define as , where is the observed colour and is the colour predicted by the fit and is the number of galaxies. The third and fourth set of quantities measure the changes in colour over the interval in magnitude, mass, or density that contains 90% of the galaxies (we exclude the lower and upper 5th percentiles of the distribution). In order to compare these colour changes between different photometric bands, we normalize by dividing either by the dispersion () or by the total range in colour enclosing 90% of the galaxies ().
We find that the optical (, , ), optical-infrared (, ) and infrared () colours all correlate with -band absolute magnitude, i.e. more luminous ellipticals tend to have redder colours than less luminous ellipticals. Table 1 shows that colours correlate more strongly with stellar mass and velocity dispersion than with -band magnitude and that the dispersions about the relations are also smaller. Our results are consistent with those of Bernardi et al. (2003d); Bernardi et al. (2005), who demonstrate that the colour-magnitude relation is a consequence of the fact that both the luminosity and the colours of early-type galaxies are correlated with their stellar velocity dispersions. These results suggest that the colours of elliptical galaxies are primarily determined by their mass.
| Index | Log(S/N) | ||||||||||
|---|---|---|---|---|---|---|---|---|---|---|---|
| slope | disp | slope | disp | element | |||||||
| (1) | (2) | (3) | (4) | (5) | (6) | (7) | (8) | (9) | (10) | (11) | (12) |
| 0.501 | 0.71 | 0.023 | 0.62 | 4.74 | 0.21 | 0.027 | 0.42 | 2.85 | C,N | ||
| 0.794 | 0.75 | 0.026 | 0.60 | 4.50 | 0.22 | 0.030 | 0.41 | 2.69 | C,N | ||
| Ca4227 | 0.757 | 2.01 | 0.221 | 0.24 | 1.41 | 0.74 | 0.225 | 0.18 | 1.18 | Ca,C,N | – |
| G4300 | 1.171 | 4.08 | 0.405 | 0.26 | 1.56 | 0.85 | 0.417 | 0.15 | 0.74 | C,O,Fe | |
| Fe4383 | 1.113 | 5.21 | 0.543 | 0.24 | 1.49 | 2.08 | 0.547 | 0.22 | 1.37 | ++Fe | |
| Ca4455 | 0.761 | 1.70 | 0.237 | 0.19 | 1.11 | 0.49 | 0.240 | 0.14 | 0.74 | Fe,Cr | – |
| Fe4531 | 1.000 | 2.62 | 0.399 | 0.19 | 1.02 | 0.82 | 0.403 | 0.14 | 0.74 | +Fe | |
| 1.169 | 14.15 | 0.747 | 0.45 | 2.94 | 5.10 | 0.777 | 0.36 | 2.37 | C,N | ||
| 0.892 | -4.29 | 0.264 | -0.39 | -2.52 | -1.28 | 0.280 | -0.24 | -1.65 | – | – | |
| Fe5015 | 1.137 | 4.15 | 0.507 | 0.21 | 1.27 | 1.68 | 0.508 | 0.20 | 1.19 | +Fe | |
| 1.240 | 0.42 | 0.014 | 0.62 | 4.81 | 0.14 | 0.016 | 0.48 | 3.20 | Mg,C | ||
| 1.470 | 0.57 | 0.020 | 0.61 | 4.52 | 0.20 | 0.022 | 0.50 | 3.28 | Mg | ||
| Mgb | 1.199 | 7.15 | 0.351 | 0.47 | 3.16 | 2.68 | 0.366 | 0.40 | 2.65 | Mg | |
| Fe5270 | 1.033 | 1.93 | 0.331 | 0.19 | 0.90 | 0.62 | 0.333 | 0.16 | 0.68 | ++Fe | |
| Fe5335 | 0.993 | 2.68 | 0.324 | 0.25 | 1.28 | 0.99 | 0.326 | 0.21 | 1.09 | ++Fe | |
| Fe5406 | 0.865 | 1.70 | 0.250 | 0.18 | 1.05 | 0.73 | 0.250 | 0.18 | 1.05 | ++Fe | |
| Fe5709 | 0.679 | 0.32 | 0.185 | 0.03 | 0.27 | 0.13 | 0.185 | 0.02 | 0.25 | +Fe | |
| Fe5782 | 0.698 | 1.18 | 0.168 | 0.19 | 1.08 | 0.48 | 0.168 | 0.17 | 1.04 | +Fe | |
| NaD | 1.291 | 12.53 | 0.498 | 0.58 | 3.90 | 4.74 | 0.526 | 0.51 | 3.26 | Na, (ISM) | – |
| 0.758 | 0.03 | 0.007 | 0.13 | 0.71 | 0.01 | 0.007 | 0.13 | 0.75 | O,Ti | – | |
| 1.273 | 0.09 | 0.008 | 0.32 | 1.80 | 0.04 | 0.008 | 0.34 | 2.01 | O,Ti | – | |
| 0.389 | -12.15 | 0.692 | -0.43 | -2.72 | -3.57 | 0.741 | -0.28 | -1.74 | – | ||
| 0.998 | -13.88 | 0.655 | -0.47 | -3.29 | -4.24 | 0.711 | -0.33 | -2.16 | – | ||
| 1.950 | 1.74 | 0.060 | 0.60 | 4.53 | 0.51 | 0.070 | 0.39 | 2.65 | – | ? | |
| 1.311 | 4.41 | 0.252 | 0.44 | 2.71 | 1.53 | 0.264 | 0.38 | 2.10 | Mg,Fe | – | |
| 1.607 | 0.40 | 0.018 | 0.50 | 3.42 | 0.14 | 0.019 | 0.40 | 2.70 | Mg,Fe | – | |
| 1.662 | 0.48 | 0.021 | 0.52 | 3.54 | 0.18 | 0.022 | 0.44 | 2.89 | Mg,Fe | – | |
| 1.115 | 0.12 | 0.013 | 0.32 | 1.52 | 0.05 | 0.013 | 0.25 | 1.33 | Mg,Fe | ||
| 1.027 | 1.33 | 0.222 | 0.19 | 0.93 | 0.47 | 0.223 | 0.16 | 0.76 | Mg,Fe | ||
3.2 Stellar absorption features
In this section we study the relations between stellar absorption features, colours and structural parameters of the galaxies in our sample.
We have measured Lick indices from the SDSS spectra, using the bandpass definition of Worthey & Ottaviani (1997). It should be noted that the strengths of some of the absorption indices are strongly affected by broadening due to the velocity dispersion of the stars in the galaxy. Indices measured with the narrowest ‘pseudo-continuum’ bandpasses show the strongest dependence on . To properly compare index strengths of galaxies with different velocity dispersion and study their intrinsic dependence on various galaxy properties, we have to correct for this effect. We normalize the index strengths of all galaxies to a common velocity dispersion of . 222The average velocity dispersion of the galaxies in the sample is . This is achieved by fitting a relation between index strength and velocity dispersion for BC03 simple stellar populations of different metallicities. These relations are then interpolated to the metallicity of the galaxy, as estimated using the methods of Gallazzi et al. (2005).
| Index | ||||||||||||
|---|---|---|---|---|---|---|---|---|---|---|---|---|
| slope | disp | slope | disp | slope | disp | |||||||
| (1) | (2) | (3) | (4) | (5) | (6) | (7) | (8) | (9) | (10) | (11) | (12) | (13) |
| 0.06 | 0.024 | 0.56 | 3.02 | 0.21 | 0.02 | 0.70 | 4.24 | 0.060 | 0.03 | 0.32 | 1.66 | |
| 0.07 | 0.027 | 0.55 | 3.08 | 0.23 | 0.02 | 0.70 | 4.27 | 0.066 | 0.03 | 0.32 | 1.66 | |
| Ca4227 | 0.15 | 0.226 | 0.16 | 0.76 | 0.52 | 0.22 | 0.21 | 0.99 | 0.113 | 0.23 | 0.10 | 0.39 |
| G4300 | 0.27 | 0.414 | 0.17 | 0.76 | 1.25 | 0.40 | 0.29 | 1.32 | 0.417 | 0.41 | 0.18 | 0.80 |
| Fe4383 | 0.53 | 0.544 | 0.24 | 1.13 | 1.52 | 0.54 | 0.27 | 1.20 | 0.698 | 0.55 | 0.22 | 1.00 |
| Ca4455 | 0.17 | 0.237 | 0.20 | 0.82 | 0.58 | 0.23 | 0.24 | 1.04 | 0.205 | 0.24 | 0.15 | 0.68 |
| Fe4531 | 0.32 | 0.398 | 0.20 | 0.92 | 0.94 | 0.40 | 0.22 | 1.00 | 0.340 | 0.40 | 0.15 | 0.67 |
| 1.47 | 0.734 | 0.47 | 2.30 | 4.59 | 0.70 | 0.54 | 2.79 | 1.509 | 0.79 | 0.32 | 1.51 | |
| -0.32 | 0.278 | -0.28 | -1.31 | -1.36 | 0.25 | -0.46 | -2.26 | -0.315 | 0.28 | -0.19 | -0.87 | |
| Fe5015 | 0.53 | 0.497 | 0.30 | 1.24 | 1.60 | 0.49 | 0.30 | 1.38 | 0.597 | 0.51 | 0.19 | 0.92 |
| 0.03 | 0.015 | 0.54 | 2.73 | 0.14 | 0.01 | 0.77 | 5.10 | 0.043 | 0.02 | 0.40 | 2.09 | |
| 0.05 | 0.021 | 0.53 | 2.70 | 0.18 | 0.02 | 0.75 | 4.62 | 0.059 | 0.02 | 0.41 | 2.02 | |
| Mgb | 0.59 | 0.366 | 0.39 | 1.86 | 2.46 | 0.32 | 0.59 | 3.25 | 0.889 | 0.37 | 0.37 | 1.91 |
| Fe5270 | 0.20 | 0.331 | 0.18 | 0.71 | 0.59 | 0.33 | 0.19 | 0.76 | 0.196 | 0.33 | 0.14 | 0.46 |
| Fe5335 | 0.29 | 0.321 | 0.26 | 1.04 | 0.91 | 0.32 | 0.29 | 1.21 | 0.294 | 0.33 | 0.18 | 0.71 |
| Fe5406 | 0.18 | 0.250 | 0.18 | 0.84 | 0.56 | 0.25 | 0.22 | 0.97 | 0.190 | 0.25 | 0.14 | 0.59 |
| Fe5709 | 0.02 | 0.185 | 0.03 | 0.11 | -0.07 | 0.18 | -0.03 | -0.15 | 0.031 | 0.18 | 0.01 | 0.13 |
| Fe5782 | 0.15 | 0.167 | 0.21 | 1.04 | 0.42 | 0.17 | 0.22 | 1.06 | 0.153 | 0.17 | 0.16 | 0.71 |
| NaD | 1.19 | 0.510 | 0.53 | 2.70 | 3.94 | 0.45 | 0.66 | 3.67 | 1.420 | 0.54 | 0.45 | 2.05 |
| 0.00 | 0.007 | 0.10 | 0.45 | 0.01 | 0.01 | 0.20 | 0.99 | 0.008 | 0.01 | 0.21 | 0.95 | |
| 0.01 | 0.008 | 0.26 | 1.14 | 0.03 | 0.01 | 0.41 | 1.82 | 0.013 | 0.01 | 0.31 | 1.38 | |
| -0.95 | 0.730 | -0.32 | -1.49 | -3.65 | 0.68 | -0.46 | -2.25 | -1.115 | 0.75 | -0.24 | -1.17 | |
| -1.18 | 0.691 | -0.38 | -1.97 | -3.91 | 0.64 | -0.52 | -2.60 | -1.172 | 0.73 | -0.26 | -1.27 | |
| 0.15 | 0.065 | 0.50 | 2.63 | 0.47 | 0.06 | 0.63 | 3.42 | 0.129 | 0.07 | 0.30 | 1.40 | |
| 0.39 | 0.259 | 0.39 | 1.75 | 1.41 | 0.24 | 0.53 | 2.50 | 0.516 | 0.26 | 0.33 | 1.53 | |
| 0.04 | 0.018 | 0.51 | 2.70 | 0.14 | 0.02 | 0.63 | 3.67 | 0.043 | 0.02 | 0.36 | 1.73 | |
| 0.05 | 0.021 | 0.53 | 2.78 | 0.16 | 0.02 | 0.66 | 3.78 | 0.056 | 0.02 | 0.38 | 1.94 | |
| 0.01 | 0.013 | 0.25 | 0.95 | 0.04 | 0.01 | 0.41 | 1.40 | 0.013 | 0.01 | 0.19 | 0.81 | |
| 0.08 | 0.224 | 0.12 | 0.39 | 0.49 | 0.22 | 0.26 | 0.95 | 0.172 | 0.22 | 0.16 | 0.61 | |

In Table 2 we summarize the results for a variety of different Lick indices and for and colours. As discussed by Thomas et al. (2003), the -element to Fe abundance ratio can be empirically quantified by the ratio between Mg and Fe indices. Here we use both the and the index ratio.333The is the average of Fe5270 and Fe5335 index strengths. It is also possible to define other combinations of indices that are almost independent of -enhancement. Those investigated here are , as defined by Thomas et al. (2003), and and , as given by BC03. For each index, we list in Table 2 the slope of the relation (columns 3 and 7), the dispersion about the relation (columns 4 and 8), the significance of the relation according to a Spearman rank-order test (columns 5 and 9) and the variation in index strength over the colour interval that contains 90 percent of the points (), normalized to the dispersion in the fitted relation (columns 6 and 10). There is a small fraction of outliers in and colours (probably galaxies with large systematic uncertainties in their photometry) which significantly affect the fits. To account for this, we decide to exclude those galaxies that lie above 2.5 times the dispersion in the colour-magnitude relations shown in Figs. 2 and 4. In this way, about 12 percent of the galaxies are excluded from the fit. We than adopt the same robust technique to fit relations between index strengths and colours. We consider as statistically not significant those relations with a correlation coefficient lower than 0.3. In Table 2 we also provide information about the indices, including the mean signal-to-noise ratio of the index (column 2), the elements that are expected to contribute most to the index strength (column 11) and the sensitivity of the index to /Fe ratio (column 12). This information was taken from Henry & Worthey (1999); Thomas et al. (2003) and Thomas et al. (2004). In Fig. 6, we illustrate a selection of (statistically significant) relations between index strength and , colours. Indices are ordered from top to bottom with decreasing correlation coefficient (indicated in each panel) with respect to .
In Table 2, the quantities of most interest are the relative strengths of
the correlations between index strength and colour for different indices (as given
by the correlation coefficient and, e.g., /disp). For , the
strongest correlations are found for the Mg- and CN-features, the 4000Å break
Dn(4000), the Balmer absorption lines (H, H and H)
and the -enhancement independent indices [Mg2Fe],
and [Mg1Fe]. When we comparing these correlations with those
involving we see that:
-
1.
Dn(4000) and the Balmer absorption lines correlate more strongly with the optical colour than with the optical-infrared colour.
-
2.
The /Fe independent Mg-Fe composite indices correlate better with optical-infrared than with optical colour.
-
3.
Mg features and NaD correlate equally well with both colours.
-
4.
shows a weak correlation with both colours.
In summary, both optical and optical-infrared colours are sensitive to metallicity and to element abundance ratios. However, the age of the stellar populations (as given by and Balmer absorption lines) influence the optical colours more strongly than the optical-infrared colours. One caveat is that the colours are measured for the galaxy as a whole, whereas the Lick indices are measured within the 3 arcsecond fibre aperture. Gradients in index strength may thus affect the analysis. We have checked whether our results change if we use SDSS “fibre” colours (calculated within a 2.5 arcsec aperture) rather than the Petrosian colours. There are changes in the strengths of some of the correlations, but our main qualitative conclusions remain unchanged.
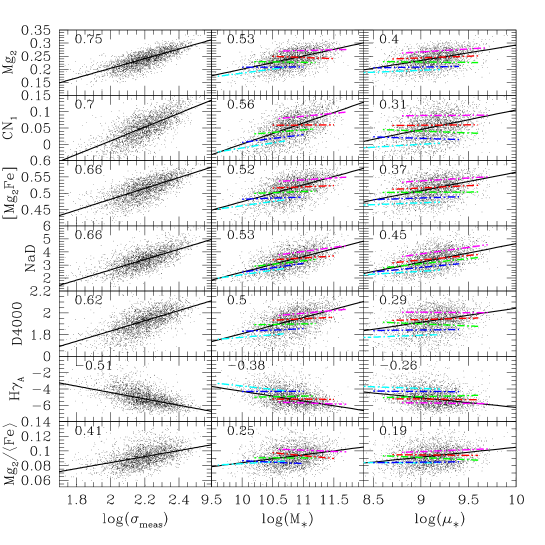
We now turn to the correlations between index strengths and structural parameters, such as stellar mass (), measured velocity dispersion () and surface mass density (). For consistency with the previous analysis, we apply here our robust fitting technique only on galaxies within 2.5 of the and relations. The results of the fits for all the indices are summarized in Table 3, where we give slope, dispersion, correlation coefficient and /disp as before. Fig. 7 shows a selection of absorption indices against velocity dispersion, stellar mass and surface mass density, ordered with decreasing correlation coefficient with respect to velocity dispersion.
The main result of this analysis is that all indices correlate much more strongly with velocity dispersion than with any other structural parameter. This is another strong indication that the properties of elliptical galaxies depend most strongly on the velocity dispersion of the system. We note that both the velocity dispersion and the spectral indices are measured within the fibre, while stellar mass and surface mass density pertain to the galaxy as a whole. One might thus worry that this might artificially strengthen the correlation between stellar absorption indices and velocity dispersion. We have checked that similar results are obtained when we correlate the absorption indices with the inferred velocity dispersion obtained by diving the stellar mass by the Petrosian half-light radius. We conclude that our main result is robust against these effects.
Finally, we have checked whether there are residual correlations between age-dependent and metallicity-dependent spectral indices and structural parameters such as surface mass density. The dot-dashed lines in the middle and right panels of Fig. 7 show the linear relations with stellar mass and surface stellar mass density, for galaxies in five bins of velocity dispersion. This clearly shows that, after removing the dependence on velocity dispersion, the absorption line strengths do not show any significant residual correlation with stellar mass and, even more so, with surface stellar mass density. Kennicutt’s law of star formation (Kennicutt, 1998) relates the star formation rate in galactic disks to the surface density of cold gas in the galaxy. The fact that we see very little correlation between spectral indices and surface density for ellipticals suggests that global processes, related to the mass of the system, have been more instrumental in setting the properties of galactic spheroids.
4 Discussion
The main aim of this paper is to investigate what can be learned from the optical, optical-infrared and infrared colours of elliptical galaxies. We have put together a sample of ellipticals from a matched sample of galaxies with photometry from both SDSS and 2MASS and spectroscopy from SDSS. We study the correlations between colours and a wide variety of different structural parameters, as well as the correlations between stellar absorption features, colours and structural parameters. We find that:
-
1.
Luminous and massive elliptical galaxies have redder optical, optical-infrared and infrared colours than less luminous and lower mass ellipticals.
-
2.
The optical, optical-infrared and infrared colours of elliptical galaxies correlate more strongly with stellar mass and velocity dispersion than with other structural parameters. The dispersion about these two relations is also smaller.
-
3.
Both optical and optical-infrared colours are sensitive to metallicity and to element abundance ratios. However, the age of the stellar populations influences the optical colours somewhat more strongly than the optical-infrared colours.
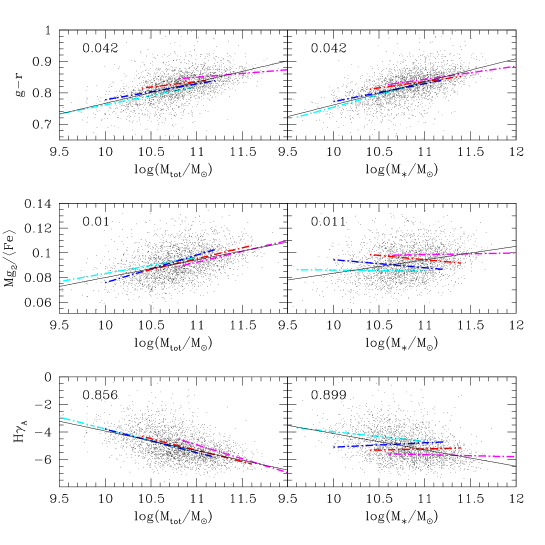
Moreover, our results show that all Lick indices correlate more strongly with velocity dispersion, either as measured within the fibre or as quantified by the ratio between stellar mass and Petrosian half-light radius, than with any other structural parameter studied. As demonstrated by Cappellari (2005), the velocity dispersion scaled by the size of the system (in this case, the effective radius) provides a remarkably good estimate of the total (stellar plus dark matter) mass of the galaxy. We have also studied correlations between colours, spectral indices and the mass inferred from the measured velocity dispersion . In Fig. 8 we compare these relations with those against stellar mass for colour, a representative age-sensitive index () and a representative metallicity-sensitive index (). In the left-hand panels the dot-dashed lines show the relations with total mass at fixed stellar mass, while in the right-hand panels they show the relations with stellar mass at fixed total mass. The middle and bottom panels show that the relation with total mass for galaxies with similar stellar mass has almost the same slope as the relation obtained for the sample as a whole. On the contrary, at fixed total mass, the relation with stellar mass becomes much shallower.
However, the dependence on these two physical parameters is less distinguishable in the case of colour. It is difficult to tell from Fig. 8 which is the most fundamental parameter between stellar and total mass. Since both the absorption features and the velocity dispersion (which enters in the estimate of total mass) are measured within the fiber, while stellar mass is a global quantity, one might worry that the relation with total mass is strengthened by aperture effects. We checked the correlation between colours, spectral features and stellar mass in the fiber (obtained by scaling stellar mass with the ratio between fiber and Petrosian z-band luminosity) and show part of the results in Table 4. It is shown that both the colours and spectral indices correlate more strongly with the mass inferred from the velocity dispersion than with the stellar mass measured within the fiber in the sense that the dispersion with the total mass is smaller that that of stellar mass in the fiber and in Col. (4) is larger than that in Col. (7).
In summary, only from the results of this paper, it is difficult to draw a robust conclusion whether the stellar mass or the total mass is the more fundamental parameter for the elliptical galaxies. But our results do suggest that the star formation history of nearby elliptical galaxy is primarily determined by the mass of the system.
| colour (or Index) | ||||||
|---|---|---|---|---|---|---|
| slope | disp | slope | disp | |||
| (1) | (2) | (3) | (4) | (5) | (6) | (7) |
| (g-r) | 0.0652 | 0.0294 | 2.5996 | 0.0732 | 0.0301 | 2.4904 |
| (r-i) | 0.0333 | 0.0202 | 1.9403 | 0.0368 | 0.0206 | 1.8343 |
| (r-J) | 0.1242 | 0.0740 | 1.9675 | 0.1292 | 0.0762 | 1.7352 |
| (r-K) | 0.1700 | 0.1031 | 1.9349 | 0.1970 | 0.1045 | 1.9308 |
| 0.0440 | 0.0161 | 3.275 | 0.0429 | 0.0184 | 2.412 | |
| -1.2735 | 0.9328 | -1.636 | -1.1952 | 0.9586 | -1.289 | |
| 0.1765 | 0.0793 | 2.667 | 0.1839 | 0.0837 | 2.273 | |
| 0.4691 | 0.2812 | 1.999 | 0.4649 | 0.2946 | 1.632 | |
| 0.0465 | 0.0216 | 2.58 | 0.0471 | 0.0227 | 2.146 | |
| 0.0567 | 0.0250 | 2.718 | 0.0561 | 0.0269 | 2.157 | |
| 0.0144 | 0.0108 | 1.598 | 0.0125 | 0.0115 | 1.124 | |
| 0.1457 | 0.2035 | 0.858 | 0.1158 | 0.2075 | 0.577 | |
Our analysis of spectral absorption features has shown that both optical and optical-infrared colours are sensitive to variations in total stellar metallicity and, to a lesser extent, element abundance ratios. Age has a more significant effect on the optical colours than on the optical-infrared colours of ellipticals. The fact that optical-infrared colours are as strongly correlated with velocity dispersion as the optical colours argues for the fact that metallicity (and possibly element abundance ratios) is the primary driver of the colour trends among elliptical galaxies. This is in agreement with the results by Gallazzi et al. (2005), who show that in contrast to metallicity, the luminosity-weighted ages of early-type galaxies in SDSS are only weakly dependent on mass.
Acknowledgments
R.C. acknowledges the financial support of MPG for a visit to MPA and expresses her gratitude for the hospitality during her visit at MPA. This project is partly supported by NSFC 10173017, 10403008, 10133020, 10073016, NKBRSF 1999075404, Shanghai Municipal Science and Technology Commission No. 04dz05905.
A.G. and S.C. thank the Alexander von Humboldt Foundation, the Federal Ministry of Education and Research, and the Programme for Investment in the Future (ZIP) of the German Government for their support. We thank the anonymous referee for his/her helpful suggestions to greatly improve this paper.
Funding for the creation and distribution of the SDSS Archive has been provided by the Alfred P. Sloan Foundation, the Participating Institutions, the National Aeronautics and Space Administration, the National Science Foundation, the U.S. Department of Energy, the Japanese Monbukagakusho, and the Max Planck Society. The SDSS Web site is http://www.sdss.org/.
The SDSS is managed by the Astrophysical Research Consortium (ARC) for the Participating Institutions. The Participating Institutions are The University of Chicago, Fermilab, the Institute for Advanced Study, the Japan Participation Group, The Johns Hopkins University, Los Alamos National Laboratory, the Max-Planck-Institute for Astronomy (MPIA), the Max-Planck-Institute for Astrophysics (MPA), New Mexico State University, University of Pittsburgh, Princeton University, the United States Naval Observatory, and the University of Washington.
References
- Abazajian et al. (2003) Abazajian K., et al. 2003, AJ, 126, 2081
- Abazajian et al. (2004) Abazajian K., et al. 2004, AJ, 128, 502
- Aragon-Salamanca et al. (1993) Aragon-Salamanca A., Ellis R. S., Couch W. J., Carter D., 1993, MNRAS, 262, 764
- Arimoto & Yoshii (1987) Arimoto N., Yoshii Y., 1987, A&A, 173, 23
- Balogh et al. (1999) Balogh M. L., Morris S. L., Yee H. K. C., Carlberg R. G., Ellingson E., 1999, ApJ, 527, 54
- Bell & de Jong (2000) Bell E. F., de Jong R. S., 2000, MNRAS, 312, 497
- (7) Bell E. F., Wolf C., Meisenheimer K., Rix H., Borch A., Dye S., Kleinheinrich M., Wisotzki L., McIntosh D., 2004, ApJ, 608,752
- Bernardi et al. (2003a) Bernardi M., et al. 2003a, AJ, 125, 1817
- Bernardi et al. (2003b) Bernardi M., et al. 2003b, AJ, 125, 1849
- Bernardi et al. (2003c) Bernardi M., et al. 2003c, AJ, 125, 1866
- Bernardi et al. (2003d) Bernardi M., et al. 2003d, AJ, 125, 1882
- Bernardi et al. (2005) Bernardi M., Sheth R. K., Nichol R. C., Schneider D. P., Brinkmann J., 2005, AJ, 129, 61
- Blanton et al. (2003) Blanton M. R., et al. 2003, ApJ, 594, 186
- Bower et al. (1992) Bower R. G., Lucey J. R., Ellis R. S., 1992, MNRAS, 254, 589
- Bressan et al. (1996) Bressan A., Chiosi C., Tantalo R., 1996, A&A, 311, 425
- Bruzual & Charlot (2003) Bruzual G., Charlot S., 2003, MNRAS, 344, 1000
- Burstein et al. (1984) Burstein D., Faber S. M., Gaskell C. M., Krumm N., 1984, ApJ, 287, 586
- Cappellari (2005) Cappellari M. a., 2005, astro-ph/0505042
- Chabrier (2003) Chabrier G., 2003, ApJ, 586, L133
- Chen et al. (2003) Chen H.-W., Marzke R. O., McCarthy P. J., Martini P., Carlberg R. G., Persson S. E., Bunker A., Bridge, C. R., Abraham R. G., 2003 ApJ, 586, 745
- Cross et al. (2004) Cross N. J., et al. 2004, AJ, 128, 1990
- De Lucia et al. (2004) De Lucia G., Kauffmann G., White S. D. M., 2004, MNRAS, 349, 1101
- (23) Djorgovski S., Davis M., 1987, ApJ, 313, 59
- Dressler (1984) Dressler A., 1984, ApJ, 286, 97
- (25) Dressler A., Lynden-Bell D., Burstein D., Davies R. L., Faber S. M., Terlevich R. J., Wegner G., 1987, ApJ, 313, 42
- Eisenstein et al. (2003) Eisenstein D. J., et al. 2003, ApJ, 585, 694
- Ellis et al. (1997) Ellis R. S., Smail I., Dressler A., Couch W. J., Oemler A. J., Butcher H., Sharples R. M., 1997, ApJ, 483, 582
- Faber (1977) Faber S. M., 1977, in Evolution of Galaxies and Stellar Populations The Chemical Composition of Old Stellar Populations. pp 157–+
- (29) Faber S. M., Jackson R., 1976, ApJ, 204, 668
- Ferreras et al. (1999) Ferreras I., Charlot S., Silk J., 1999, ApJ, 521, 81
- Ferreras et al. (2005) Ferreras I., Saha P., Williams L., 2005, ApJ, 623, 5
- Gallazzi et al. (2005) Gallazzi A., Charlot S., Brinchmann J., White S. D. M., Tremonti C. A., 2005, MNRAS, 362, 41
- Gorgas et al. (1993) Gorgas J., Faber S. M., Burstein D., Gonzalez J. J., Courteau S., Prosser C., 1993, ApJS, 86, 153
- Henry & Worthey (1999) Henry R. B. C., Worthey G., 1999, PASP, 111, 919
- Hogg et al. (2004) Hogg D. W., et al 2004, ApJ, 601, L29
- Holden et al. (2004) Holden B. P., Stanford S. A., Eisenhardt P., Dickinson M., 2004, AJ, 127, 2484
- Jarrett et al. (2000a) Jarrett T. H., Chester T., Cutri R., Schneider S., Rosenberg J., Huchra J. P., Mader J., 2000a, AJ, 120, 298
- Jarrett et al. (2000b) Jarrett T. H., Chester T., Cutri R., Schneider S., Skrutskie M., Huchra J. P., 2000b, AJ, 119, 2498
- Jarrett et al. (2003) Jarrett T. H., Chester T., Cutri R., Schneider S., Huchra J. P., 2003, AJ, 125, 525
- Jørgensen (1999) Jørgensen I., 1999, MNRAS, 306, 607
- Kauffmann & Charlot (1998) Kauffmann G., Charlot S., 1998, MNRAS, 294, 705
- Kauffmann et al. (2003a) Kauffmann G., et al. 2003a, MNRAS, 341, 33
- Kauffmann et al. (2003b) Kauffmann G., et al. 2003b, MNRAS, 341, 54
- Kennicutt (1998) Kennicutt R. C., 1998, ApJ, 498, 541
- Kodama & Arimoto (1997) Kodama T., Arimoto N., 1997, A&A, 320, 41
- Kodama et al. (1998) Kodama T., Arimoto N., Barger A. J., Arag’on-Salamanca A., 1998, A&A, 334, 99
- Larson (1974) Larson R. B., 1974, MNRAS, 166, 585
- Stanford et al. (1998) Stanford S. A., Eisenhardt P. R., Dickinson M., 1998, ApJ, 492, 461
- Stanford et al. (1995) Stanford S. A., Eisenhardt P. R. M., Dickinson M., 1995, ApJ, 450, 512
- Stoughton et al. (2002) Stoughton C., et al. 2002, AJ, 123, 485
- Terlevich et al. (2001) Terlevich A. I., Caldwell N., Bower R. G., 2001, MNRAS, 326, 1547
- Thomas et al. (2003) Thomas D., Maraston C., Bender R., 2003, MNRAS, 339, 897
- Thomas et al. (2004) Thomas D., Maraston C., Korn A., 2004, MNRAS, 351, L19
- Trager et al. (2000) Trager S. C., Faber S. M., Worthey G., González J. J., 2000, AJ, 119, 1645
- Trager et al. (1998) Trager S. C., Worthey G., Faber S. M., Burstein D., Gonzalez J. J., 1998, ApJS, 116, 1
- Visvanathan & Sandage (1977) Visvanathan N., Sandage A., 1977, ApJ, 216, 214
- Worthey (1996) Worthey G., 1996, in ASP Conf. Ser. 98: From Stars to Galaxies: the Impact of Stellar Physics on Galaxy Evolution Elliptical Galaxies: Abundance Ratio Trends and Implications. pp 467–+
- Worthey et al. (1992) Worthey G., Faber S. M., Gonzalez J. J., 1992, ApJ, 398, 69
- Worthey & Ottaviani (1997) Worthey G., Ottaviani D. L., 1997, ApJS, 111, 377
- Wu et al. (2005) Wu H., Shao Z., Mo H. J., Xia X., Deng Z., 2005, ApJ, 622, 244
- York et al. (2000) York D. G., et al. 2000, AJ, 120, 1579