The first optical validation of an XLEO:
a detection in the XMM-Newton observation
of the CDFS111Based on observations obtained with XMM-Newton, an ESA science mission
with instruments and contributions directly funded by
ESA Member States and NASA.
Abstract
We present the first optical validation of an X-ray Line-Emitting Object (XLEO) discovered in the XMM-Newton observation of the Chandra Deep Field South. The object is an AGN at z. An optical spectrum of the source indeed confirms and refines (z) the redshift obtained from the X-ray line. The X-ray and optical properties of the source are presented and discussed.
1 Introduction
We have recently developed FLEX (Finder of Line Emitting X-ray sources), a new algorithm to search for X-ray Line Emitting Objects (hereafter XLEOs) in XMM-Newton observations (Maccacaro et al., 2004). The detection method is based on a raster scan that is extended to the third dimension (energy) that characterizes the EPIC-pn images. In simple words it is a sliding “cube” search algorithm. Basically, the counts of the EPIC-pn data-cube are grouped both in spatial bins and in energy bins and a search for a significant excess is performed along the energy axis. A full description of FLEX will be presented in Braito et al., (in preparation). The first three sources found with this technique, from the analysis of 13 XMM-Newton observations, have been reported and discussed in Maccacaro et al., (2004). The FLEX algorithm is still being tested in order to optimize, among other things, its various critical parameters as well as to establish its efficiency. Over the last few months FLEX was run on a second set of XMM-Newton EPIC-pn observations with different combinations of spatial ( and ) and energy sizes (200 and 300 eV) for the three-dimensional detection cell. A substantial number of XLEOs have been found and this sample will be reported elsewhere. Since the detection of the X-ray line rests on very few photons (e.g. a dozen or even less, when 1 or 2 are expected from the continuum) we are faced with the problem of finding strong independent support to the reality of the XLEOs detected, especially in this early phase of the project. One of the strong point of the detection of an XLEO is its redshift determination directly from the X-ray data, from the assumption that the line seen is Fe at 6.4 keV. The identification of an XLEO with an object at the same redshift indicated by the iron line, but optically determined, should thus be considered a strong validation of the reality of the XLEO. To this end we have successfully proposed VLT observations of the optical counterparts of some of the XLEOs found so far. While waiting for the observations to be taken, we have decided to run FLEX on a field for which deep optical spectroscopic observations are already available for a large number of objects, i.e. the Chandra Deep Field South (CDFS). For this field deep XMM-Newton observations exist. In this paper we present the first optical validation of an XLEO deriving from the discovery of an object coincident with a spectroscopically identified X-ray source, having the same redshift as determined by the FLEX algorithm.
2 XMM-Newton observations of the CDFS
Eight separate XMM-Newton observations of the CDFS region are available in the public archive222xmm.vilspa.esa.es/external/xmm_data_acc/xsa/index.shtml. These data have been cleaned from high background time intervals and the resulting pn exposures are between 24 and 64 ks. The log of the observations is given in Table 1.
We have run FLEX on the 8 individual EPIC-pn observations and we have selected only those XLEO candidates lying on a clearly detected XMM-Newton source. XLEO J03322744 was detected in the analysis of observation n. 7 (see Table 1). The discovery scan (a box of eV was used) is shown in Figure 1. An excess in the count distribution is clearly visible at 3.8 keV, where 9 counts are recorded. The “noise” level (background + source continuum) is estimated at 1.06 counts. Thus the probability that the excess is a random noise fluctuation at the energy and spatial position where it is seen is P. Taking into account that the total number of trials is , this converts into a probability of finding such a fluctuation in the observation analyzed of less than (see the discussion in Maccacaro et al. 2004). A significant excess was also detected from the same observation in a scan with a box of eV. In this case 12 counts are recorded at 3.8 keV, to be compared with an expectation of 1.95 (P).
FLEX did not detect XLEO J03322744 in any of the other 7 observations. In two cases (n. 1 and n. 3), this is due to the fact that the source falls in a gap between two CCD chips. In observation n. 8 there is an excess in the count distribution at 3.7 keV, however its significance () is below the FLEX threshold for flagging. No excess is seen in the other four observations. Prompted by the conviction that the line is indeed real (an excess of counts at 3.8 keV is seen also in the sum of the corresponding MOS observations) we have further analyzed the other datasets. We determined that the putative emission line which is present in the two chronologically consecutive EPIC-pn observations n. 7 & 8, when the 210 keV source flux continuum is at a minimum ( ergs cm-2 s), is not detectable, if at the same intensity, in the other EPIC-pn observations characterized by a higher continuum ( ergs cm-2 s). To summarize, FLEX detects the line in observation n. 7 as well as in the sum of 7 & 8 (15 counts vs 3.3 expected) but does not detect it in the sum of all the XMM-Newton observations. Given the presence of an excess also in the independent MOS data we conlcude that the source is probably variable and that the line is real and best visible (maximum contrast) when the continuum is low. Data points are however too scanty, and the source too faint, to allow any investigation of a possible correlation, or time delay, between continuum and line flux variations.
If the line detected is interpreted as the Fe emission line at 6.4 keV, then the redshift of the source can be derived directly from the X-ray data. A proper spectral analysis (see section 3.1) indicates a best fit energy position for the line at 3.85 keV. We thus derive a redshift .
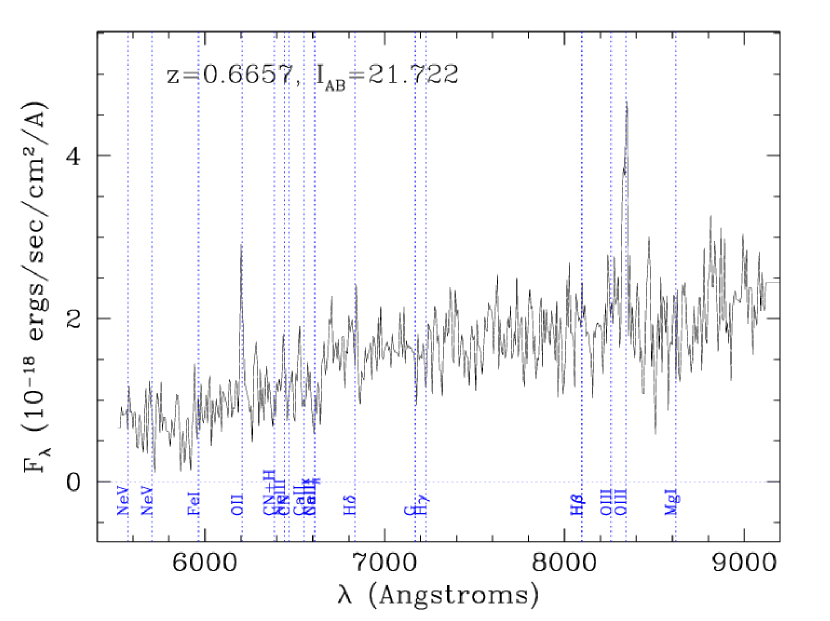
The FLEX algorithm is not providing an accurate X-ray position for the sources found. However, since XLEO J03322744 is found at the position of a catalogued Chandra source (Giacconi et al. 2002; Szokoly et al. 2004), a very accurate localization of the X-ray source is available (03:32:36.7; 27:44:7.1, J2000.0). The XMM-Newton position, as derived from the SAS, is consistent, within 1′′, with the Chandra position. An optical image of the region of XLEO J03322744 is avaiable at: www.mpe.mpg.de/CDFS/data/33.html. The object within the circle has been already proposed as the counterpart of the X-ray source (Giacconi et al., 2002). The optical spectrum (from http://cencosw.oamp.fr/VVDS/CDFS.html) is reproduced in Figure 2; it shows two prominent emission lines identified as [OII]3727Å and [OIII]5007Å from which a redshift is derived (Szokoly et al., 2004). This is in excellent agreement with the X-ray determination, and thus validates our XLEO detection.
We have also inspected the 1Ms Chandra ACIS-I observation. The resulting 2-10 keV flux is times higher than the XMM-Newton flux, further implying source variability. Variability (within the Chandra observation) is also found (Tozzi, private communication). No evidence for a significant excess is found in the 1Ms Chandra observation at keV, in agreement with the result of Tozzi et al. 2005 (A&A, submitted). As we did for the XMM-Newton observations characterized by a high flux, we tested the visibility of a line of the same intensity of that seen in the XMM-Newton observations n. 7 & 8 in the “high state” Chandra observation. We found that it would have been undetectable. It must be said that an excess of counts is seen in the Chandra data at a sligthly higher energy: 4.1 keV. Whether this is a real emission line and, if so, whether the 200 eV difference is due to physical rather then instrumental reasons is not clear to us and would require a detailed and accurate analysis of the Chandra data that goes beyond the scope of this paper. Given the concordance between the XMM-Newton EPIC-pn, MOS and optical data, the XMM line detection at 3.85 keV rests on firm ground.
3 The nature of XLEO J03322744
3.1 X-ray Spectral analysis
To investigate the spectral properties of XLEO J03322744 we have considered all the 8 public XMM-Newton pointings on this field in the XMM-Newton archive333In 2 XMM-Newton pointings (n. 1 and n. 3) only MOS1 and MOS2 were used since in the pn the source falls in a gap between two CCDs.. Source counts from each individual exposure and from each instrument (pn, MOS1, and MOS2) were extracted using a circular region of radius 13′′ to 15′′, while background counts were derived from a nearby source-free region having an extraction radius 2–3 times larger. Response matrices at the position of the source have been created using the SAS tasks arfgen and rmfgen. Summed source and background spectra, as well as summed response matrices and effective areas, were also created using standard FTOOLS tasks.
The resulting total exposure times are 277, 416 and 419 ksec for pn, MOS1 and MOS2 respectively. The source spectra have been rebinned to have at least 15-20 counts per bin and, to improve statistic, MOS1 and MOS2 data were combined together. All models discussed here have been filtered for the Galactic absorbing column density along the line of sight ( cm-2; Dickey & Lockman, 1990). Unless otherwise stated, errors are given at the 90% confidence level for one interesting parameter (). Finally pn and MOS data were fitted simultaneously keeping their relative normalizations free to vary.
A single absorbed power law model is a good description of the combined data sets; this simple
model, acceptable from a statistical point of view (), gives parameters
which are typical of a relatively unabsorbed AGN (, cm-2), in agreement with the Chandra X-ray classification (AGN1, Giacconi
et al. 2002). However, since an excess of counts is present at keV, both in the pn
and MOS data, we have fitted this “line-like” excess adding a narrow gaussian line. The
addition of the line is not strictly required. However since we have external evidence for the
presence of a line, its inclusion, that leads to a marginal improvement of the fit (see Table 2),
provides a better description of the data.
The best fit spectral parameters are reported in Table 2; the best fit energy position of the line is 3.85 keV, in
very good agreement with the energy position derived by FLEX, while the line equivalent width () is
eV, corresponding to of eV.
The spectrum shown in Figure 3 is the
result of the analysis of all the XMM-Newton observations (upper panel), and of observations n. 7 plus
8, where the line has a higher contrast with respect to the continuum (lower panel). As expected, the line EW
(see Table 2) in this latter case is larger than in the former, characterized by a higher continuum.
Given the large uncertainty on the equivalent width of this line it is difficult to understand if it is consistent or not with the measured intrinsic . If produced by transmission, an of eV implies an absorption column density higher than cm-2 (Turner et al., 1997; Leahy & Creighton 1993, ), in contrast with the low absorption measured from spectral fitting. We checked the possible presence of an “extra” X-ray absorption using two different models: adding a second absorbed power law component or fitting a partial-covering model. Both tests show that a column density of the order of cm-2 is not required by the present data. On the other hand we cannot exclude from the X-ray data alone that the primary AGN emission is even more absorbed ( cm-2) and that its signature falls outside the XMM-Newton bandpass.
3.2 Optical data
The optical spectrum, from the VVDS catalog, shows a continuum emission dominated by the host-galaxy, plus two relatively strong (20-30Å) emission lines ([OII]3727Å and [OIII]5007Å). The rest–frame wavelength range sampled is 3000Å–5400Å. Given the relative importance of the host galaxy emission, the properties of the nuclear emission are difficult to assess. For this reason, we have adopted a two-components model, characterized by an AGN emission plus a galaxy template, and we attempted to reproduce the observed spectrum, following the approach discussed in Severgnini et al. (2003). In particular, we have used an AGN template from Francis et al. (1991) and Elvis et al. (1994) and a galaxy template taken from Bruzual & Charlot (2003). The AGN narrow emission line ratios are taken from Krolik (1999). In the AGN template the continuum and the broad emission lines have been absorbed on the basis of the value, assuming a Galactic standard value of E=1.710-22 mag cm-2 (Bohlin et al. 1978). Both the normalizations and the value of are free parameters.
The optical observed spectrum can be well reproduced with an intrinsic column density higher than 31021 cm-2 embedded in a host galaxy. We find that the observed [OII]3727Å must be mostly produced by the host galaxy while the [OIII]5007Å probably comes from the AGN. This model reproduces also the RK4 color measured by Szokoly et al. (2004). The lower limit obtained for the value is in agreement with the X–ray spectral analysis result. The optical–to–X–ray spectral index estimated assuming an obscuration of a few 1021 cm-2 (444The is defined in the rest frame as follows: log(f2500Å/f2keV)/log(/.1.4) is similar to the typical value expected for a high–luminosity Seyfert (). This model does not put any upper limit on the amount of obscuration. However, assuming a strong X–ray obscuration of 1024 cm-2 or more, the intrinsic 2 keV flux would be at least a factor of 100 higher and the spectral index would be 1. This latter value, typical of low luminosity AGN (e.g. Ho 1999), is in contrast with the high intrinsic 2–10 keV luminosity that this source would have (i.e. in the “Compton thick” hypothesis the intrinsic 2–10 keV luminosity would be 1044 erg s-1).
An additional constraint on the total amount of obscuration can be derived from the thickness parameter (T=F2-10keV/F[OIII]) discussed in Bassani et al. (1999). This ratio, combined with the EW of the Fe line, is used as an indicator for the presence of strong obscuration in local AGN. In order to apply this diagnostic to our source, we have estimated the rest–frame 2–10 keV and [OIII] fluxes. We obtain T70 which excludes the presence of a highly obscured (a “Compton thick”) AGN which is characterized by T1 (see Bassani et al. 1999).
In summary, the optical properties of the source are all consistent with a scenario in which an AGN with an value between a few 1021 cm-2 to a few 1023 cm-2 is present. On the basis of our model, this scenario could be firmly confirmed and refined by observing the spectral region were the H line is expected (i.e. around 1.1 ). In the case of low absorption, a strong and broad H line should be observed, while no broad component should be present in the case of strong obscuration.
4 Discussion and conclusions
We have presented the first optical validation of an XLEO, namely an independent optical
redshift determination that confirms the redshift derived from the X-ray data alone. XLEO
J03322744 was discovered in the XMM-Newton observation of the Chandra Deep Field
South. It is coincident with a previously reported Chandra and XMM-Newton source,
identified with an AGN at moderate redshift (z = 0.665). From the X-ray and optical spectra
the object seems to be only moderately absorbed ( cm-2)
unlike the first 3 XLEO discovered that were close to the “Compton thick” regime, being
characterized by cm-2 (Maccacaro et al. 2004). Deeper X-ray observations are
difficult to conceive given the faintness of the source. Observations at other wavelengths
are however feasible and have the potential of providing crucial informations for a better
understanding of the nature of this source. In particular infrared spectroscopy in the
region around , where Hα in emission is expected, will allow to
better constrain the amount of intrinsic obscuration.
It is worth stressing that, for sources with limited
statistics, the standard spectral description used for X-ray data (i.e. through binning of
the original data) does not always allow to recognize the presence of a line; indeed the inevitable large energy binning
adopted dilutes the source counts at the energy of the emission line. The results presented here confirm
the power of FLEX, the algorithm we have specifically developed to search for X-Ray Line
Emitting Objects.
References
- Bassani et al. (1999) Bassani, L., Dadina, M., Maiolino, R., et al., 1999, ApJS, 121, 473
- Bohlin et al. (1978) Bohlin, R.C., Savage, B.D., Drake, J.F. 1978, ApJ, 224, 132
- Bruzual & Charlot (2003) Bruzual, G. & Charlot, S. 2003, MNRAS, 344, 1000
- Dickey & Lockman (1990) Dickey, J. M. & Lockman, F. J. 1990, ARA&A, 28, 215
- Elvis et al. (1994) Elvis, M., Wilkes, B. J., McDowell, J.C., et al. 1994, ApJS, 95, 1
- Francis et al. (1991) Francis, P.C., Foltz, C.B., Chaffee, F.H., et al. 1991, AJ, 101, 1121
- Giacconi et al. (2002) Giacconi, R., et al. 2002, ApJS, 139, 369
- Ho (1999) Ho, L. C., 1999, ApJ, 516, 672
- Krolik (1999) Krolik, J. H. 1999, Active galactic nuclei : from the central black hole to the galactic environment/Julian H. Krolik. Princeton, N. J. : Princeton University Press, c1999.
- (10) Leahy, D. A. & Creighton, J. 1993, MNRAS, 263, 314
- Maccacaro et al. (2004) Maccacaro, T., Braito, V., Della Ceca, R., Severgnini, P., & Caccianiga, A. 2004, ApJL, 617, L33
- Severgnini et al. (2003) Severgnini, P., Caccianiga, A., Braito, V., et al. 2003, A&A 406, 483
- Szokoly et al. (2004) Szokoly G.P., Bergeron, J., Hasinger, G., et al. 2004, ApJS, 155, 271
- Turner et al. (1997) Turner, T. J., George, I. M., Nandra, K., & Mushotzky, R. F. 1997, ApJs, 113, 23


| N | Obsid | Exposure (s) | Obs. Date | Notes |
|---|---|---|---|---|
| pn MOS1, MOS2 | ||||
| 1 | 0108060401 | 24686, 30508, 30520 | 2001-07-27 | in pn gap |
| 2 | 0108060501 | 33592, 45485, 45584 | 2001-07-28 | line not detected |
| 3 | 0108060601 | 39110, 49004, 49703 | 2002-01-13 | in pn gap |
| 4 | 0108060701 | 63746, 76808, 77042 | 2002-01-14 | line not detected |
| 5 | 0108061801 | 42824, 50480, 52117 | 2002-01-16 | line not detected |
| 6 | 0108061901 | 34868, 43621, 43825 | 2002-01-17 | line not detected |
| 7 | 0108062101 | 39152, 43601, 43752 | 2002-01-20 | XLEO detected in pn |
| 8 | 0108062301 | 63986, 76608, 76433 | 2002-01-23 | line present but not detected |
| MODEL | Ec | EWb | Flux2-10 | L2-10 | INST | |||
|---|---|---|---|---|---|---|---|---|
| 1021cm-2 | keV | keV | 10-15cgs | 1043cgs | ||||
| PL | 1.71 | 1.8 | / | / | 4.6d | 0.7 | 60.6/74 | XMM all |
| PL+Gauss. | 1.78 | 1.8 | 3.9 | 4.5e | 0.8 | 57.6/72 | XMM all | |
| PL+Gauss. | 1.8c | 1.8 | 3.9 | 3.2e | 0.6 | 40.2/41 | XMM 78 |