Dynamical and chemical properties of the “starless” core L1014
Spitzer Space Telescope observations of a point-like source, L1014-IRS, close to the dust peak of the low-mass dense core L1014 have questioned its starless nature. The presence of an object with colors expected for an embedded protostar makes L1014-IRS the lowest luminosity isolated protostar known, and an ideal target with which to test star formation theories at the low mass end.
In order to study its molecular content and to search for the presence of a molecular outflow, we mapped L1014 in at least one transition of 12CO, N2H+, HCO+, CS and of their isotopologues 13CO, C18O, C17O, N2D+and H13CO+, using the Five College Radio Astronomy Observatory (FCRAO), the IRAM 30 meter antenna and the Caltech Submillimeter Observatory (CSO).
The data show physical and chemical properties in L1014 typical of the less evolved starless cores: i.e. H2 central density of a few 105 molecules cm-3, estimated mass of 2 M⊙, CO integrated depletion factor less than 10, (N2H+) cm-2, (N2D+)/(N2H+) equal to 10% and relatively broad N2H+(1–0) lines (0.35 km s-1). Infall signatures and significant velocity shifts between optically thick and optically thin tracers are not observed in the line profiles.
No classical signatures of molecular outflow are found in the 12CO and 13CO observations. In particular, no high velocity wings are found, and no well-defined blue-red lobes of 12CO emission are seen in the channel maps. If sensitive, higher resolution observations confirm the absence of an outflow on a smaller scale than probed by our observations, L1014-IRS would be the only protostellar object known to be formed without driving an outflow.
Key Words.:
ISM: clouds – ISM: evolution – ISM: individual(L1014) – ISM: molecules – ISM: jets and outflows – Stars: formation1 Introduction
Starless cores are cold ( 10-20 K) and dense ( cm-3) condensations of gas and dust in which no sign of the presence of a central protostellar object has been found. Previously, the easiest way to determine if dust emission was associated with a protostellar object was to search for a source emitting at mid-infrared wavelengths in the catalogue (see, Beichman et al., 1986). This technique was obviously limited by the sensitivity.
A clear example is represented by IRAM 04191: although André, Motte & Bacmann (1999) found a clear sign of the presence of a Class 0 object represented by a clear collimated bipolar outflow departing from the core peak, does not show a point source towards the dust emission peak. Moreover, the CS line they observed towards the nucleus confirmed the presence of star formation activity showing a clear double peaked profile with the blue peak brighter than the red one. This spectral asymmetry has been recognized as an indicator of systematic inward motion (Snell & Loren, 1977; Zhou, 1992; Tafalla et al., 1998; Lee, Myers & Tafalla, 1999).
In the same fashion, we present here the case of L1014.
This core, listed as an opacity class 6 object in the Lynds (1962) catalogue,
lies 025 below the galactic plane, has a line of sight velocity of 4 km s-1 with respect to the local standard of rest and is projected just 10′ south of another
dark globule B362 111 We note that B362 and L1014 were called “L1014-1”
and “L1014-2” in Lee & Myers (1999). In the present paper we keep the original names as in
Barnard, Frost & Calvert (1927) and Lynds (1962). .
These cores can be seen in the Digital Sky Survey optical
image presented in Figure 1, where we have overlaid visual
extinction contours derived from near-infrared color excesses
of background stars listed in the 2MASS catalog using
the NICE technique (e.g. Lada et al., 1994; Alves et al., 1998).
L1014 was included in a survey for infall asymmetry in starless cores performed
observing CS(2–1) and N2H+(1–0) (Lee, Myers & Tafalla, 1999); given the weak detection in CS, no
N2H+ observations were attempted.
The dust continuum from L1014 was first detected at 260 m using the NASA Kuiper Airborne
Observatory (KAO) Keene (1981).
Subsequently a 850 m emission map (Visser, Richer & Chandler, 2001) taken with SCUBA showed a dust emission
peak at (21h24m076, 49°59′02″, J2000) coincident with
the visual extinction peak.
These authors then performed an unsuccessful search for high velocity gas, observing 12CO(2–1)
at five points around the dust peak with a sensitivity of 0.3 K km s-1 in a 0.2 km s-1channel.
The Spitzer Space Telescope (hereafter Spitzer) observed L1014 in December 2003 as part of the Legacy program ”From Molecular Cores to Planet Forming Disks” (Evans et al., 2003). Surprisingly, a strong (81.816 mJy) point source was detected with MIPS at 24 m towards the center of L1014 (Young et al., 2004), being coincident with both the 850 m peak (Visser, Richer & Chandler, 2001) and 1.2 mm peak (Young et al. 2004; Kauffmann et al., in preparation). This object, referred to as L1014-IRS, is also clearly detected in each of the 4 IRAC bands (3.6, 4.5, 5.8 and 8.0 m) and at 70 m with MIPS and, most importantly, shows a Spectral Energy Distribution (SED) compatible with an embedded protostar having an effective temperature of K according to the IRAC data at m. Considering that L1014-IRS is the only source visible at 70 m in the 5′5′ field observed with the Spitzer and L1014 is the only starless core present in the same region, Young et al. (2004) concluded that a chance alignment of the two sources was unlikely although not negligible. Naively, dividing the Spitzer field of view in squared cells with 30″ of side, the chance probability of having both L1014 and L1014-IRS in the same cell would be 1%. In this paper, although we will consider the chance alignment as an alternative explanation, we will devote more discussion to the hypothesis of association since the weight of the evidence supports this hypothesis. Assuming a distance to the core of 200 pc, Young et al. (2004) determine a luminosity of 0.09 L⊙ for L1014-IRS. From the bolometric temperature (= 50 K) and the ratio between bolometric and sub-millimeter luminosity (= 20), Young et al. (2004) classified L1014-IRS as a Class 0 protostar (see André, 1994, for a review on Class 0 properties).
Outflows are an ubiquitous tracer of protostellar activity (André, 1994; Richer et al., 2000), and so, in an attempt to support the classification of L1014-IRS as a Class 0 protostar, we deepened the search for high velocity 12CO with a better combination of resolution and sensitivity than in past searches. We report here on observations of 12CO, 13CO, C18O, C17O, CS, N2H+, N2D+, HCO+ and H13CO+ aimed at surveying the molecular content of L1014 and at studying its kinematical properties.
2 Observations
Observations were performed during March and April 2004, using the 32-pixel SEQUOIA focal
plane array mounted on the Five College Radio Astronomy Observatory (FCRAO) 14 meter telescope.
We mapped L1014 in CO(1–0), 13CO(1–0), C18O(1–0), N2H+(1–0) and CS(2–1) using the on-the-fly
position switching mode.
Adopted frequencies, telescope half power beam widths, system temperatures, channel spacings and size
of the mapped area are in Table 1. Temperatures were converted in the main beam
brightness scale according to the efficiencies tabulated in the FCRAO web
page222http://www-astro.phast.umass.edu/fcrao/observer/status14m.html#ANTENNA.
Data were reduced and convolved onto a 20″ spaced grid (circa Nyquist sampling) using the
otftool software
(Heyer, Narayanan & Brewer, 2001)333http://www-astro.phast.umass.edu/fcrao/library/manuals/otfmanual.html
available at FCRAO and then analysed using CLASS, the spectral line analysis
software of IRAM and Observatoire de Grenoble (see Buisson et al., 2002, for a manual).
Angular offsets throughout this paper are relative to the 1.2-mm continuum peak position
(21h24m075, 49°59′05″, J2000), which is 4″ south
of L1014-IRS position.
Complementary higher-resolution observations of N2H+(1–0), (3–2), N2D+(1–0), (2–1), (3–2)
and C17O(1–0) were obtained in August 2004 using the IRAM-30m telescope.
The observations consisted in a 5-pointings cross spaced by 20″ around the 1.2-mm peak
position for N2H+(1–0), N2D+(1–0) and N2D+(3–2), while N2H+(3–2) and N2D+(2–1) were
observed only at the (0,0), (20,0) and (20,0) and C17O(1–0) only at the peak position.
These data were taken in frequency switching mode using the facility autocorrelator as the backend.
Information about the telescope parameters (channel spacing, HPBW, system temperatures) are reported
in Table 2.
Intensities were converted in the main beam brightness scale using the efficiencies reported in the
IRAM web site444http://www.iram.fr/IRAMES/telescope/telescopeSummary/telescope_summary.html.
Finally, we used the Caltech Submillimeter Observatory in August 2004 to obtain HCO+(3–2), H13CO+(3–2) and HCN(3–2) spectra towards the central position and a small map in C18O(2–1) and C17O(2–1). Spectra were obtained in position switching mode. Although the single pointing observations were performed 6″ south of L1014-IRS, the 30″ beam allows us to consider them as relative to the infrared source position. Conversion factor to the main beam temperature () was evaluated from observations of planets. Other informations for the telescope set-up are reported in Table 2.
The pointing accuracy for all our observations was measured to be ″.
3 Results
3.1 Maps
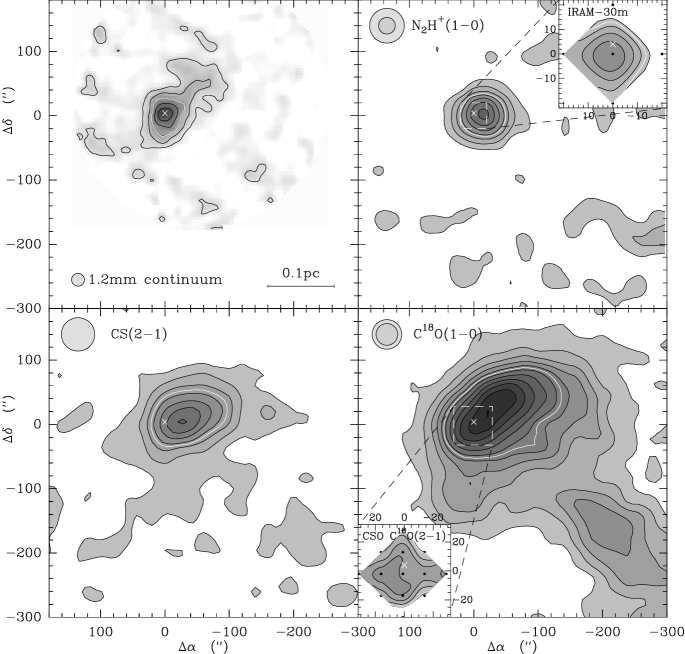
In Figure 2, we present integrated intensity emission maps of L1014 (V km s-1) in N2H+(1–0), CS(2–1) and C18O(1–0) taken with FCRAO together with the 1.2-mm continuum from Young et al. (2004), the 5-points map of N2H+(1–0) taken with the IRAM-30m and the 13-points map of C18O(2–1) from CSO. The half maximum contour of each map is rendered in white. The white cross shows the position of L1014-IRS, the candidate protostellar object embedded in L1014 according to Young et al. (2004). The area observed with the FCRAO is 10′10′ in size, but only the inner 8′8′ region where emission was detected is shown in Figure 2.
N2H+(1–0) emission, which comes from the high density nucleus of the core, is very concentrated (FWHM 70″, in the FCRAO observations) and peaks 10″ west of the dust emission (within the uncertainties due to the 54″ FCRAO beam width and the Nyquist sampling of the observations). Since the emitting region is comparable in size with the telescope beam some dilution is very likely. In fact, IRAM-30m observations of N2H+(1–0) with a 26″ beam showed spectra 3 times brighter than those observed by FCRAO towards the dust continuum peak, although still the emission does not seem to be fully resolved. In these higher resolution observations, the integrated intensity peak falls 5″ south of L1014-IRS. We note that the equivalent radius of the N2H+(1–0) emission from FCRAO (0.034 pc, evaluated as the square root of the area within the 50% contour divided by ) is among the smallest radii found in Lee, Myers & Tafalla (2001) and Caselli, Benson, Myers & Tafalla (2002), which observed 63 starless cores altogether using FCRAO and evaluated the equivalent radius with the same technique. The integrated intensity of N2H+(1–0) at peak observed with FCRAO is also lower (a factor of 2) than any other core reported in Lee, Myers & Tafalla (2001) and Caselli, Benson, Myers & Tafalla (2002), although the beam dilution should be kept in mind. Following Caselli, Benson, Myers & Tafalla (2002), we calculated the virial mass of L1014 from , where is the typical radius of the N2H+ emission from FCRAO and is the velocity dispersion of the mean mass molecule (see Caselli, Benson, Myers & Tafalla, 2002, for the definition). In this way we obtained a virial mass of 2.1 M⊙, again, among the smallest in the Caselli, Benson, Myers & Tafalla (2002) sample. This estimate is in agreement with the mass evaluated from the extinction map in Figure 1. In fact, using a conversion factor of per magnitude of visual extinction (Bohlin, Savage, & Drake, 1978), we obtained a mass of 1.5 M⊙ above the A magnitudes contour.
The CS(2–1) emission is much more extended than the 1.2-mm continuum and N2H+(1–0), as expected due to its lower critical density and possible depletion effects (Tafalla et al., 2002). The integrated intensity peak lies 30″ west of the dust emission, although the same caveats about the limited resolution and sampling apply here as in the N2H+ map.
C18O(1–0) observations reveal more structure than previous observations, showing a secondary
peak at (200″,200″) from the reference position. Note that the 1.2-mm map did not cover
that area. Also the C18O(1–0) integrated intensity peaks west of the continuum, although
the peak is less constrained than the other tracers.
The flatness of the C18O map and the offset of its peak with respect to the dust are typical
features of starless cores (Tafalla et al., 2002), where CO (and its isotopologues) freeze-out onto
dust grains in the high density nucleus. To test if this is the situation in L1014, we
follow Caselli et al. (2002b) evaluating the degree
of CO depletion as the ratio of the canonical CO abundance ([CO]/[H2],
Frerking, Langer & Wilson 1982) and the observed abundance derived from the ratio of C18O and H2 column
densities (for details see Caselli et al., 2002b).
Following Crapsi et al. (2005), the CO column density was derived under the constant excitation temperature
approximation (CTEX, see eq. A4 in Caselli et al., 2002b) assuming that C18O emission is
optically thin. In this way we derived a C18O column density of cm-2 at
the dust peak position which increases to cm-2 at the C18O peak
position (20″, 20″). The CO column density can then be inferred from the local
interstellar medium relative abundance value ([CO]/[C18O]=560; Wilson & Rood 1994).
H2 column density was inferred from the 1.2-mm emission assuming constant dust temperature (10 K) and
emissivity ( cm2 g-1) similarly to Ward-Thompson, Motte & Andre (1999), obtaining
cm-2 at the dust peak position and cm-2 at the C18O peak position.
We thus found a depletion factor around 9 at the dust peak, whereas it drops to 5 at the C18O peak.
These values are typical of starless cores with moderate chemical evolution (e.g. L1495, L1498, L492)
with densities of about a few cm-3(Crapsi et al., 2005).
The 30″ map of C18O(2–1) obtained at CSO is shown in an inset of Figure 2.
Note that the error on the integrated intensity for the points outside the peak is 2.5 times the
value reported in Table 3.
Similarly to the N2H+ high–resolution observations, the C18O(2–1) from CSO seems to peak south of
L1014-IRS.
While the 1.2-mm emission peak in L1014 (23 mJy (11″ beam)-1) is comparable in intensity with the majority of N2H+ emitting starless cores (see e.g Crapsi et al., 2005), it is relatively weak if compared with high-density, evolved pre–stellar cores such as L1544 ( 60 mJy (11″ beam)-1, Ward-Thompson, Motte & Andre 1999). Consequently, the H2 central volume density inferred from it is 6 times less ( cm-3 in L1014 vs. cm-3 in L1544) when evaluated with the same technique and physical parameters as in Tafalla et al. (2002). This technique derives the density profile of a spherically symmetric core which best fit the observed 1.2-mm continuum. In our calculations we adopted a density profile model of the form , finding, in addition to the central density, the radius of the “flat” region 20″ and the asymptotic power law index 2.7. Note that the central H2 density value given in Young et al. (2004) ( cm-3) was evaluated using a dust opacity equal to 0.0104 cm2 g-1.
3.2 Spectra towards dust peak
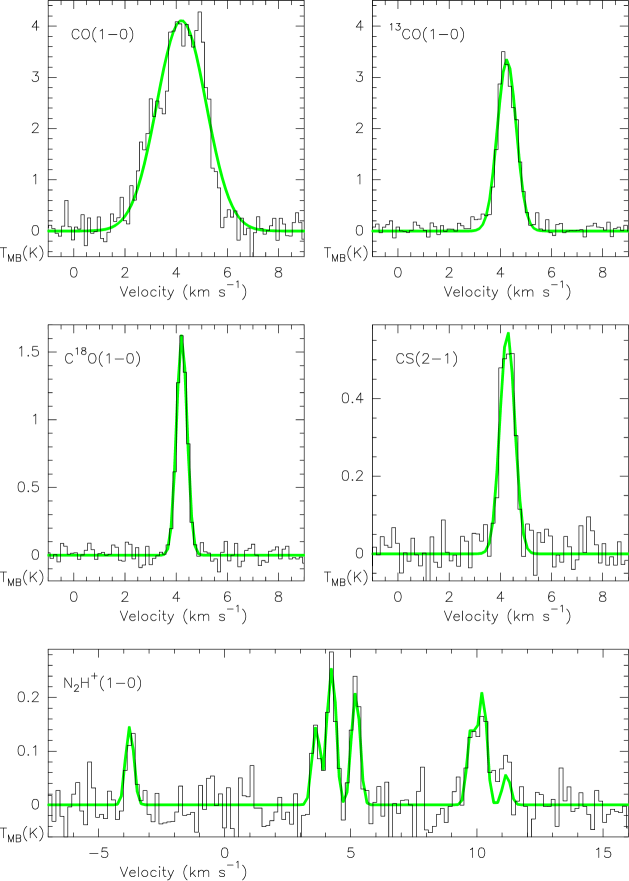
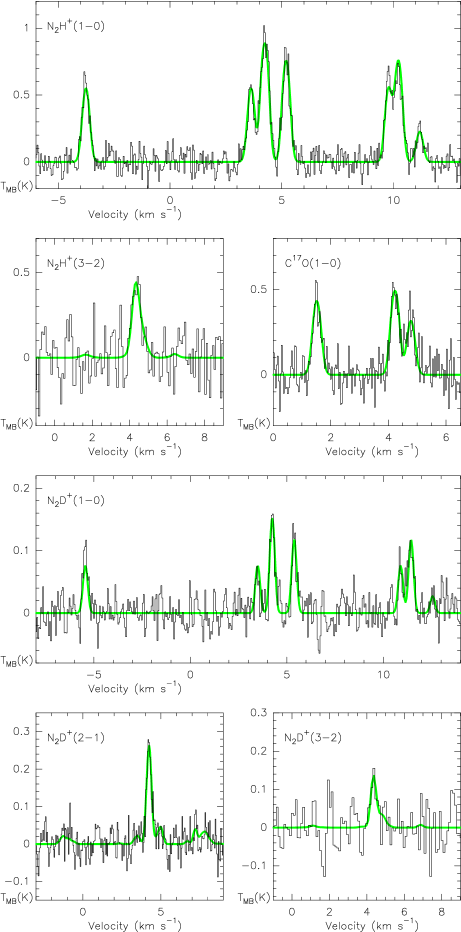
The spectra observed towards the dust emission peak with FCRAO are shown in Figure 3 while those observed with IRAM-30m are shown in Figure 4 and those taken at CSO in Figure 5. Gaussian fits were performed using the CLASS fitting procedure and results are presented in Table 3. In the case of lines with hyperfine structure, all the hyperfine components were simultaneously fit. This kind of fit also furnishes the opacity of the line in the presence of high S/N spectra. The N2H+(1–0) line widths (0.35 km s-1) are slightly broader than the prototype of evolved starless core L1544 (0.31 km s-1, Caselli et al., 2002a), suggesting a combination of nonthermal and systematic motions in the inner nucleus of L1014. Using the CTEX approximation on the higher resolution (IRAM-30m) data, we found a column density at the integrated intensity peak position of (N2H+) cm-2, comparable to other starless cores moderately evolved in a chemical sense like e.g. L1512, L1498, L1495, L1517B (Crapsi et al., 2005), and a factor of 2-3 less than in IRAM 04191, the other very low-luminosity Class 0 object known (Belloche & André, 2004). Similarly, the N2D+ column density derived from the N2D+(1–0) and (2–1) IRAM-30m spectra yielded a value of cm-2 from both lines. The deuterium fractionation at the peak of L1014 was, thus, found to be 10%, a value higher than the average starless core (Crapsi et al., 2005). N2H+ and N2D+ column densities were calculated also in the Large Velocity Gradient approximation (see e.g. Crapsi et al., 2005, for details) yielding values of cm-2 and cm-2 respectively. This approach furnishes also an estimate of the H2 volume density from observations of multiple rotational transitions; in this way we obtained (H2) cm-3 from N2H+ and (H2) cm-3 from N2D+, both estimates are consistent within their errors with the central density evaluated from the dust continuum.
12CO(1–0) and 13CO(1–0) profiles are much more asymmetric than the other lines and their observed line widths (2 km s-1 and 1 km s-1) are broader (0.5 km s-1). This occurrence is not consistent with a line broadening caused by opacity effects alone, as already noted by Robert & Pagani (1993). A possible explanation could be found considering that CO and 13CO emission comes from the combination of emissions by randomly-moving, low-density parts of the cloud with different velocities along the line of sight and with larger turbulence. C17O(1–0) opacity was found to be from hyperfine structure fitting although the low signal-to-noise ratio lets us think that this might be just an upper limit. In fact, the total column density derived from other indicators is totally inconsistent with such a high opacity for C17O.
Interestingly, our CS(2–1) spectra do not show the asymmetric double peaked structure, with the blue peak stronger than the red one, typical of the cores undergoing infall (Zhou, 1992; Mardones et al., 1997; Lee, Myers & Tafalla, 1999). This feature was clearly seen in IRAM 04191 (André, Motte & Bacmann, 1999). Moreover, the difference in line velocity between CS and N2H+ in units of the N2H+(1–0) line width (), that is supposed to gauge the extended infall motions of the core (Mardones et al., 1997; Lee, Myers & Tafalla, 1999), is very small in L1014 (0.04).
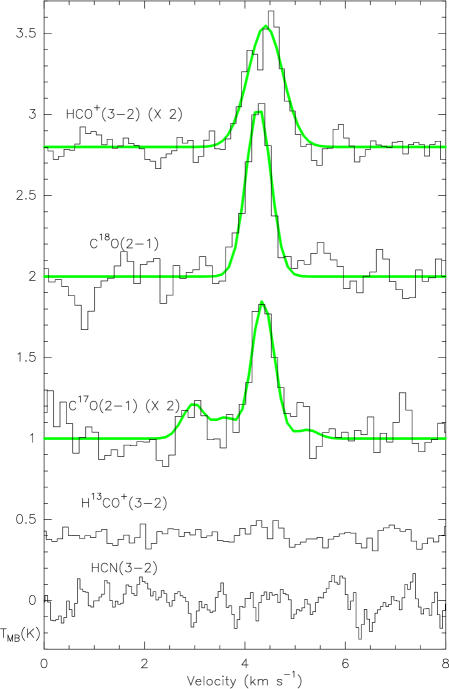
On the contrary, HCO+(3–2) observations show the opposite asymmetry revealing a red peak brighter than the blue peak (see Figure 5). This line profile can be produced by a rotating, expanding, or pulsating core (Lada et al., 2003). We note that the velocity of the self absorbed feature corresponds to the velocity of the optically thin C18O(2–1) line as predicted by the models. Given the moderate signal to noise ratio of the present data, it is necessary to confirm these indications with higher sensitivity and higher resolution observations and to retrieve a map of HCO+ in order to search for spatial patterns for the expansion asymmetry.
We failed to detect H13CO+(3–2) and HCN(3–2) towards L1014-IRS up to a 0.02 and 0.03 K km s-1 level respectively.
3.3 The search for the outflow in L1014
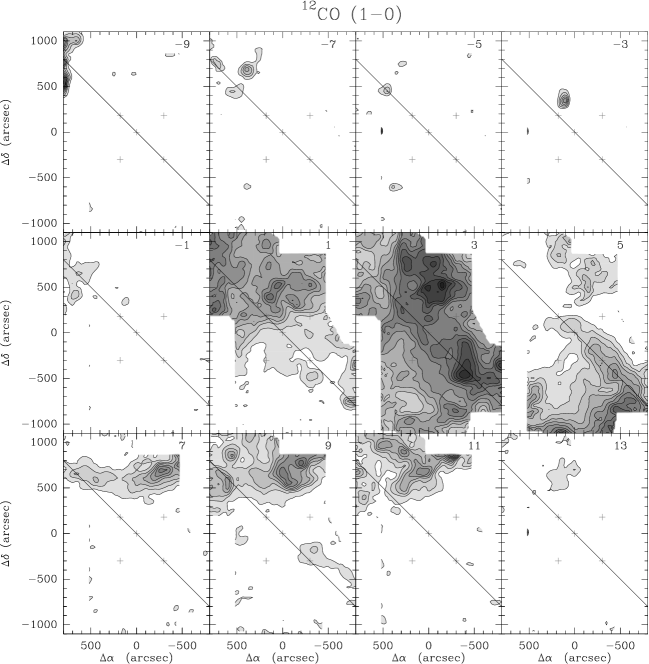
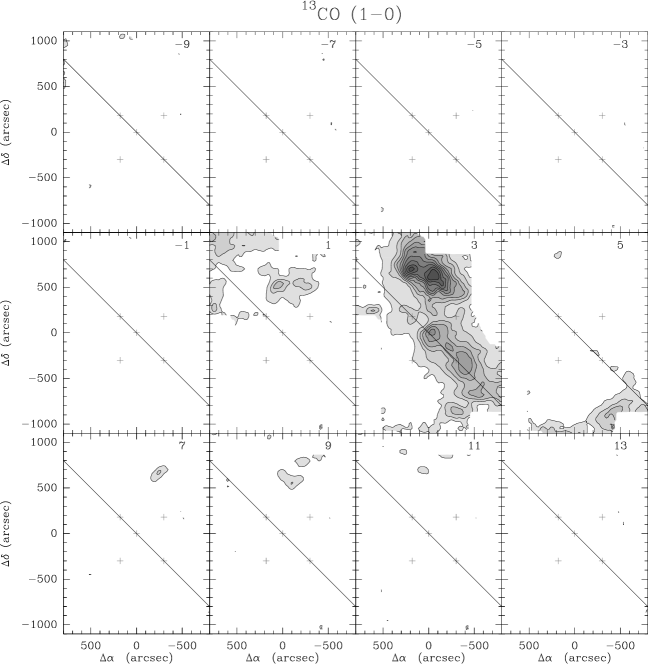
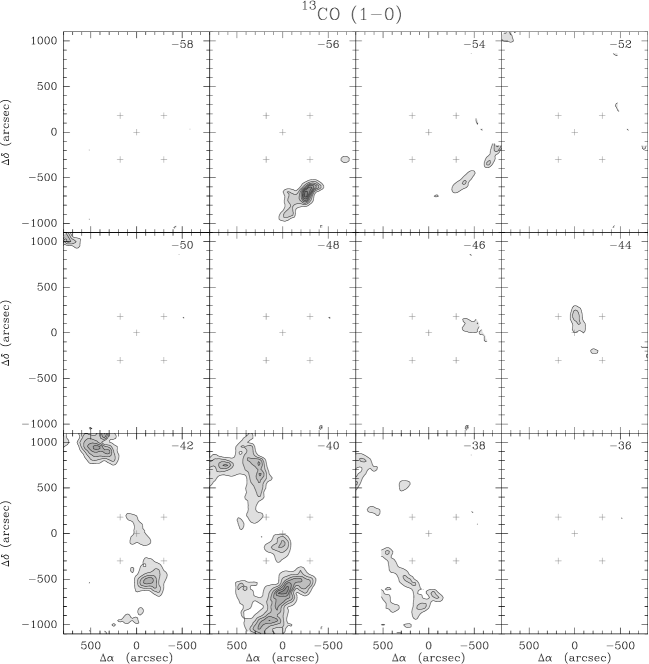
In Figure 6, we present channel maps of CO(1–0) (top) and 13CO(1–0) (bottom) in a range of velocities, 9 km s-1 to 15 km s-1, centered around the L1014 typical velocity (4.2 km s-1). Emission was integrated in 2 km s-1 intervals. No CO emission was found anywhere in the mapped area between 35 km s-1 and 9 km s-1 and between 15 km s-1 and 25 km s-1, i.e at velocities departing more than 10 km s-1 from the L1014 rest velocity. The 1 errors for the 12CO and 13CO channel maps are 0.06 K km s-1 and 0.03 K km s-1 respectively, less than the lowest contours adopted in Figures 6 and 8
Using IRAM 04191 (André, Motte & Bacmann, 1999) as a guide, we searched for 12CO(1–0) wing emission at velocities . No wing-like emission was found in this range (see maps labeled 5, 3, 1 and 7, 9, 11 in Figure 6).
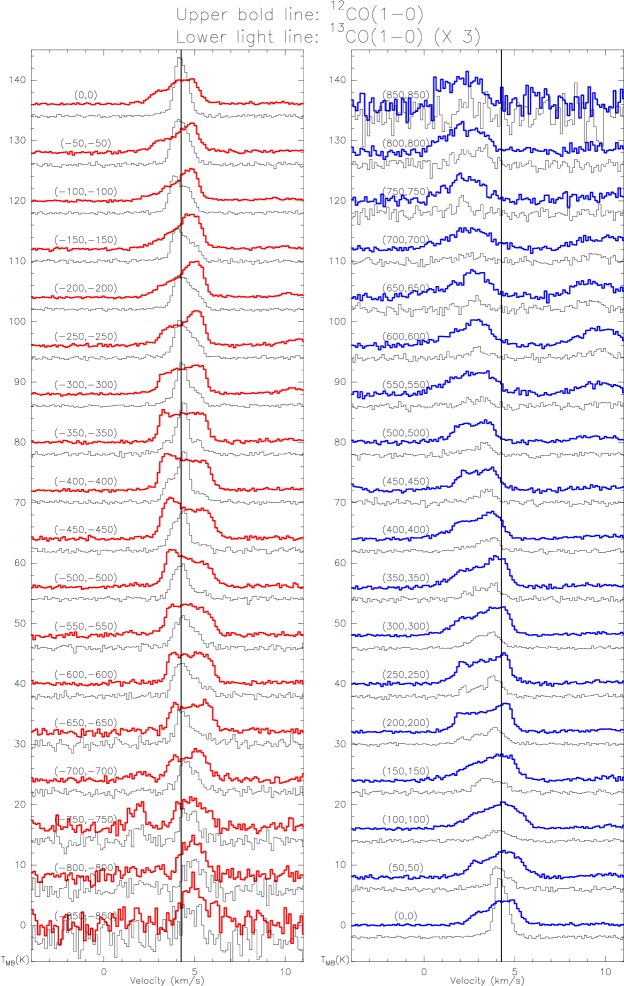
Nevertheless, given the very low luminosity of L1014-IRS we examined also the possibility of less energetic wings. The most likely outflow feature present in L1014 is along position angle 45° (measured East of North) where we can see red emission in the SW lobe between 5 and 7 km s-1 and blue emission in the NE part in the bin 1 to 3 km s-1. This axis was identified mainly from the jet-like appearance of the “red lobe”, but the fact that this feature is also seen in the 13CO(1–0) and C18O(1–0) emission, which typically are not sensitive to outflows, poses serious questions as to whether this is indeed due to a classical outflow lobe. Moreover, as can be seen in the sequence of spectra along this axis (Figure 7), we do not see the typical outflow features in the line profiles. For example:
- i)
-
12CO(1–0) line at the cloud rest velocity is not present throughout all the cut and is not the dominant component in all the positions,
- ii)
-
the “low velocity wings”, seen for example in the positions (500, 500) in the red lobe or (100,100) in the blue lobe, look less like wings in the following positions (200, 200) and (400, 400).
From the spectra in Figure 7, we deduce that the red lobe and the blue extended emission seen in the 12CO map arise from different parts of the cloud with different velocities along the line of sight. This view is reinforced also by the observations of 13CO and C18O emission in the same region and with consistent velocities. The presence of gas with different velocities along the same line of sight would also explain the relatively broad 12CO and 13CO line widths found towards the entire map (see Robert & Pagani 1993 and Section 3.2).
A peculiar feature of the 12CO channel maps is the presence of several small spots of emission in the NW part of the map at velocities smaller than 1 km s-1 and one spot at 9 km s-1 in the SE. Although these may be interpreted as molecular “bullets” coming from the L1014 nucleus, their asymmetric positioning, low velocity and large distance from the nucleus (0.05 pc) make them very different from the prototypical cases (Bachiller, 1996).
We conclude that no classical outflow signature is present at the large scales investigated with the FCRAO. Further sensitive observations must be performed with smaller beams to probe the CO emission within the inner 45″ (the FCRAO beam size).
3.4 The background component
The Spitzer observations presented by Young et al. (2004) left open the possibility of L1014-IRS being a more massive but less embedded distant protostar aligned by chance with the L1014 nucleus. Although the relative rarity of embedded protostar and starless cores do not favour this chance, the fact that we are looking close to the galactic plane and towards the Perseus spiral arm did not allow us to disregard it just on a statistical basis. Now, recent deep near-infrared observations confirm that L1014-IRS is associated with the nearby L1014 core (T. Huard et al. 2005, in prep.), our FCRAO observations are consistent with this finding.
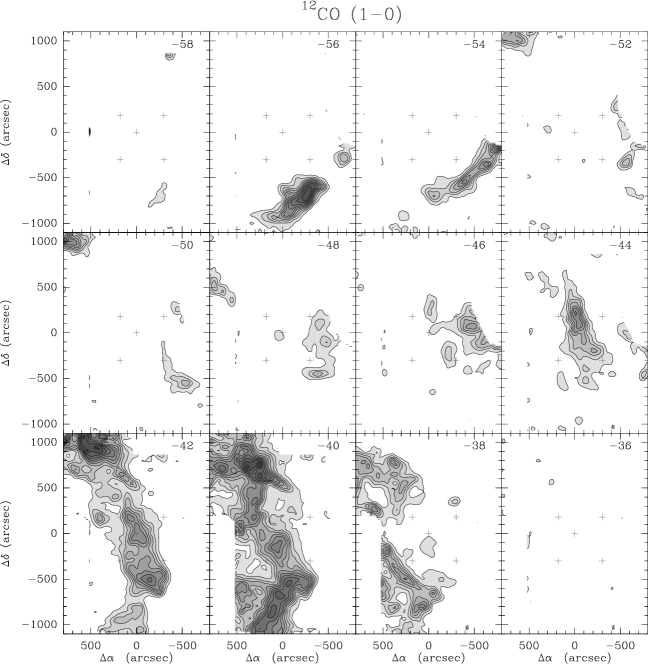
We searched for signatures of infall-outflow activity towards L1014-IRS also at the Perseus arm velocity (near -40 km s-1). No N2H+(1–0), CS(2–1) and C18O(1–0) emission was detected at these velocities, most likely because of beam dilution given the small scales traced by those species and the large Perseus arm distance (2.6 kpc, Brand & Blitz, 1993). Young et al. (2004) calculated that, assuming a distance of 2.6 kpc for L1014-IRS, the protostar whose emission would fit best the observed SED would have a luminosity of 16 L⊙. Class I and Class 0 protostars with comparable bolometric luminosity like L1165 (Visser, Richer & Chandler, 2002), L1448 and L1157 (Bachiller, 1996) drive outflows of 0.3 pc in size, corresponding to 20″ at the Perseus arm distance. Although this size is smaller than the FCRAO beam, we performed a search for high velocity wings in the 40 km s-1 component. CO and 13CO channel maps at these velocities are shown in Figure 8, with the same intensity scale as in Figure 6. No emission was detected below 58 km s-1 and above 36 km s-1. As for the component around 4 km s-1, no clear-cut outflow features are seen in the channel map.
4 Discussion
The contradiction between the relatively young evolutionary status of L1014 derived from chemical indicators
and the presence of a protostellar object embedded in its nucleus is puzzling.
L1014 shows continuum and line intensities much lower than well-studied starless cores; in particular,
the H2 volume density, N2H+ column density and the degree of CO depletion are smaller
than the average starless core, from which we did not expect L1014 to be close to the star formation.
Moreover, the CS observation does not indicate the presence of inward motions, and the
HCO+ line profile show hints of outward motions.
On the other hand, we report also relatively high deuterium fractionation and broad (if compared
to other low-mass starless cores) N2H+ and N2D+ lines which are typical of more evolved objects.
We speculate that either i) the very low-luminosity nature of the central source
(0.09 L⊙, Young et al., 2004) makes its chemical and dynamical evolution different
to any other observed core or ii) that a low-mass, low-luminosity “seed” is present long
before the protostellar phase in every “starless” core.
Boss & Yorke (1995) and Masunaga, Miyama & Inutsuka (1998) modeled the early phase of protostar formation introducing the
“first hydrostatic core” or “Class –I” protostar as a short lived precursor of the Class 0.
During this phase, the central temperature should reach a value of 200 K
(3 times lower than the temperature derived by Young et al. 2004) and no outflow emission is expected.
According to the duration of this phase, we could expect the detection of similar sources in the nuclei
of some other starless cores in future Spitzer observations.
Considering that L1014-IRS was classified as a Class 0 protostar (Young et al., 2004) having met the requirements of K and (Andre, Ward-Thompson, & Barsony, 1993), our observations indicate that L1014-IRS might be the first Class 0 protostar not associated with an observed molecular outflow. Even IRAM 04191, which has a bolometric luminosity comparable to L1014-IRS (0.15 L⊙), has an easily detected, very extended outflow (André, Motte & Bacmann, 1999); thus, it seems unlikely that the weakness of the central source is responsible for the lack of the outflow detection. In any case, one should bear in mind that differences in the inclination angle, collimation factor, in the age, as well as in the external environment could make the detection of the outflow more difficult even in presence of two jets with comparable momenta. We can speculate that either the accretion rate of L1014-IRS is currently too little to power the outflow or that the magnetic field that threads the disk is too weak (Bachiller, 1996). Alternatively, we may have caught L1014 in the epoch between the protostar formation and the outflow ignition (see e.g. Boss & Yorke 1995; Masunaga, Miyama & Inutsuka 1998), although this hypothesis seems less likely given the short lifetime associated to this phase.
We remark that our observations do not probe small scale outflows that would be diluted in the 45″ FCRAO beam, in particular if the outflow is very young and therefore compact. Strong molecular outflows are a hallmark of Class 0 protostar (André, 1994) , thus it is of fundamental importance to extend the search for the outflow to a smaller scale.
The present data alone cannot rule out conclusively the possibility of chance alignment,
although our search for background dense cores through N2H+ and CS was negative, and
no signatures of molecular outflows were found in the CO background component.
The absence of a background dense core could be explained by the chance crossing of a T-Tauri star born
elsewhere and expelled in the direction of L1014 (see the case of PV Cephei, Goodman & Arce 2004).
This explanation, although difficult to rule out, is even less probable
than the chance alignment, given the additional requirements of a favourable trajectory
from the parent cloud to L1014 and the coincidence in the epoch of observations.
Further evidence that L1014-IRS is a young stellar object embedded within
L1014 comes from deep near-infrared observations and will be presented by
T. Huard et al. (in preparation).
5 Conclusions
We observed the starless core L1014 with the FCRAO antenna in N2H+(1–0), CS(2–1), C18O(1–0), 13CO(1–0) and 12CO(1–0), combined with literature 1.2-mm continuum data and new N2H+(1–0), N2H+(3–2), N2D+(1–0), N2D+(2–1), N2D+(3–2) and C17O(1–0) observations from the IRAM-30m and C18O(2–1), C17O(2–1), HCO+(3–2), H13CO+(3–2) and HCN(3–2) spectra from CSO to study its chemical status and to search for the presence of a molecular outflow. The results of our study are summarized below.
1. The chemical and physical properties of L1014 derived from the present observations are not typical of highly evolved low-mass starless cores. In particular, we found: molecular hydrogen volume density of (H2) cm-3, N2H+ column density of (N2H+) cm-2, M M⊙, CO integrated depletion factor equal to 9, absence of CS double peaked profile with infall signature, absence of velocity shifts between self-absorbed optically thick (CS) and optically thin (N2H+) tracers and a profile asymmetry in HCO+(3–2) consistent with outward motions. On the other hand, we found an enhanced degree of deuterium fractionation equal to 10% which is higher than the average starless core, and broad N2H+ and N2D+ lines suggestive of unresolved kinematical activity in the inner nucleus.
These diverging indications could be reconciled considering that we are observing either a very young stage of star formation or an extremely low-luminosity object exhibiting characteristics that differ significantly from previously known cases.
2. No classical signatures of a molecular outflow were found towards L1014. In particular, we note the absence of high velocity wing and of symmetric well-defined red-blue lobes in the CO channel maps. Bearing in mind that the scale probed by the present observations might be too large to detect the outflow in L1014, we suggest that the formation of a protostar might occur prior to or in absence of the molecular outflow.
The presence of a protostar in L1014 seems to challenge the idea that there is a unique path to forming a protostar that all cores must follow.
Acknowledgements.
We gratefully thank Paola Caselli and Arnaud Belloche for taking care of the observations at the IRAM-30m, and the referee, Dr. Laurent Pagani, for clarifying several points in the manuscript. A.C. was partly supported by NASA “Origins of Solar System Grant” (NAG 5-13050). C.W.L. acknowledges supports from the Basic Research Program (KOSEF R01-2003-000-10513-0) of the Korea Science and Engineering Foundation. This work has been partly supported by NASA ”Origins of Solar System Grant” (NNG04GG24G).References
- Alves et al. (1998) Alves, J., Lada, C. J., Lada, E. A., Kenyon, S. J., & Phelps, R. 1998, ApJ, 506, 292
- Andre, Ward-Thompson, & Barsony (1993) Andre, P., Ward-Thompson, D., & Barsony, M. 1993, ApJ, 406, 122
- André (1994) André, P. 1994, The Cold Universe, 179
- André, Motte & Bacmann (1999) André, P., Motte, F., & Bacmann, A. 1999, ApJ, 513, L57
- Barnard, Frost & Calvert (1927) Barnard, E. E., Frost, E. B., & Calvert, M. R. 1927, Carnegie institution of Washington
- Bachiller (1996) Bachiller, R. 1996, ARA&A, 34, 111
- Beichman et al. (1986) Beichman, C. A., Myers, P. C., Emerson, J. P., Harris, S., Mathieu, R., Benson, P. J., & Jennings, R. E. 1986, ApJ, 307, 337
- Belloche & André (2004) Belloche, A. & André, P. 2004, A&A, 419, L35
- Brand & Blitz (1993) Brand, J. & Blitz, L. 1993, A&A, 275, 67
- Bohlin, Savage, & Drake (1978) Bohlin, R. C., Savage, B. D., & Drake, J. F. 1978, ApJ, 224, 132
- Boss & Yorke (1995) Boss, A. P. & Yorke, H. W. 1995, ApJ, 439, L55
- Buisson et al. (2002) Buisson G., Desbats L., Duvert G., Forveille T., Gras R., Guilloteau S., Lucas R., & Valiron P. 2002, CLASS manual
- Caselli et al. (2002a) Caselli, P., Walmsley, C. M., Zucconi, A., Tafalla, M., Dore, L., & Myers, P. C. 2002a, ApJ, 565, 331
- Caselli et al. (2002b) Caselli, P., Walmsley, C. M., Zucconi, A., Tafalla, M., Dore, L., & Myers, P. C. 2002b, ApJ, 565, 344
- Caselli, Benson, Myers & Tafalla (2002) Caselli, P., Benson, P. J., Myers, P. C., & Tafalla, M. 2002c, ApJ, 572, 238
- Crapsi et al. (2005) Crapsi, A., Caselli, P., Walmsley, C. M., Myers, P. C., Tafalla, M., Lee, C. W., & Bourke, T. L. 2005, ApJ, 619, 379
- Evans et al. (2003) Evans, N. J., et al. 2003, PASP, 115, 965
- Frerking, Langer & Wilson (1982) Frerking, M. A., Langer, W. D., & Wilson, R. W. 1982, ApJ, 262, 590
- Goodman & Arce (2004) Goodman, A. A., & Arce, H. G. 2004, ApJ, 608, 831
- Heyer, Narayanan & Brewer (2001) Heyer, M. H., Narayanan, G., & Brewer, M. K. 2001, On the Fly Mapping at the FCRAO 14m Telescope, FCRAO
- Keene (1981) Keene, J. 1981, ApJ, 245, 115
- Lada et al. (1994) Lada, C. J., Lada, E. A., Clemens, D. P., & Bally, J. 1994, ApJ, 429, 694
- Lada et al. (2003) Lada, C. J., Bergin, E. A., Alves, J. F., & Huard, T. L. 2003, ApJ, 586, 286
- Lee & Myers (1999) Lee, C. W. & Myers, P. C. 1999, ApJS, 123, 233
- Lee, Myers & Tafalla (1999) Lee, C. W., Myers, P. C., & Tafalla, M. 1999, ApJ, 526, 788
- Lee, Myers & Tafalla (2001) Lee, C. W., Myers, P. C., & Tafalla, M. 2001, ApJS, 136, 703
- Lynds (1962) Lynds, B. T. 1962, ApJS, 7, 1
- Mardones et al. (1997) Mardones, D., Myers, P. C., Tafalla, M., Wilner, D. J., Bachiller, R., & Garay, G. 1997, ApJ, 489, 719
- Masunaga, Miyama & Inutsuka (1998) Masunaga, H., Miyama, S. M., & Inutsuka, S. 1998, ApJ, 495, 346
- Richer et al. (2000) Richer, J. S., Shepherd, D. S., Cabrit, S., Bachiller, R., & Churchwell, E. 2000, Protostars and Planets IV, 867
- Ridge & Moore (2001) Ridge, N. A. & Moore, T. J. T. 2001, A&A, 378, 495
- Robert & Pagani (1993) Robert, C., & Pagani, L. 1993, A&A, 271, 282
- Shu, Adams & Lizano (1987) Shu, F. H., Adams, F. C., & Lizano, S. 1987, ARA&A, 25, 23
- Snell & Loren (1977) Snell, R. L. & Loren, R. B. 1977, ApJ, 211, 122
- Tafalla et al. (1998) Tafalla, M., Mardones, D., Myers, P. C., Caselli, P., Bachiller, R., & Benson, P. J. 1998, ApJ, 504, 900
- Tafalla et al. (2002) Tafalla, M., Myers, P. C., Caselli, P., Walmsley, C. M., & Comito, C. 2002, ApJ, 569, 815
- Visser, Richer & Chandler (2001) Visser, A. E., Richer, J. S., & Chandler, C. J. 2001, MNRAS, 323, 257
- Visser, Richer & Chandler (2002) Visser, A. E., Richer, J. S., & Chandler, C. J. 2002, AJ, 124, 2756
- Ward-Thompson, Motte & Andre (1999) Ward-Thompson, D., Motte, F., & Andre, P. 1999, MNRAS, 305, 143
- Wilson & Rood (1994) Wilson, T. L. & Rood, R. 1994, ARA&A, 32, 191
- Young et al. (2004) Young, C. H. et al. 2004, ApJS, 154, 396
- Zhou (1992) Zhou, S. 1992, ApJ, 394, 204
| line | frequency | HPBW | TSYS | vel. cov. | Mapped region | |
| (1) | (2) | (3) | (4) | (5) | (6) | (7) |
| N2H+(1–0) | 93.1737725 | 54 | 280 | 0.157 | 5′ 5′ | |
| CS(2–1) | 97.980953 | 52 | 280 | 0.149 | 5′ 5′ | |
| C18O(1–0) | 109.782173 | 46 | 280 | 0.133 | 5′ 5′ | |
| 13CO(1–0) | 110.201370 | 46 | 440 | 0.133 | 20′ 32′ | |
| 12CO(1–0) | 115.271203 | 44 | 920 | 0.127 | 20′ 32′ | |
| Note. – Col. (2) line rest frequency (GHz); Col. (3) Half Power Beam Width (″); | ||||||
| Col. (4) System Temperature (K, main beam scale); Col. (5) Channel Spacing (km s-1); | ||||||
| Col. (6) Usable velocity coverage (km s-1); Col. (7) R.A. and Dec. extension of the mapped region. | ||||||
| line | frequency | HPBW | TSYS | vel. cov. | Nobs | |
| (1) | (2) | (3) | (4) | (5) | (6) | (7) |
| IRAM-30m observations | ||||||
| N2H+(1–0) | 93.1737725 | 26 | 165 | 0.021 | 5 | |
| N2H+(3–2) | 279.511863 | 9 | 1500 | 0.042 | 3 | |
| N2D+(1–0) | 77.109626 | 32 | 155 | 0.025 | 5 | |
| N2D+(2–1) | 154.217137 | 16 | 300 | 0.026 | 3 | |
| N2D+(3–2) | 231.321966 | 11 | 440 | 0.050 | 5 | |
| C17O(1–0) | 112.358990 | 22 | 240 | 0.034 | 1 | |
| CSO observations | ||||||
| C18O(2–1) | 219.560352 | 34 | 390 | 0.130 | 13 | |
| C17O(2–1) | 224.714214 | 33 | 330 | 0.128 | 5 | |
| HCO+(3–2) | 267.557620 | 28 | 320 | 0.107 | 1 | |
| H13CO+(3–2) | 260.255478 | 29 | 300 | 0.110 | 1 | |
| HCN (3–2) | 265.886434 | 28 | 500 | 0.054 | 1 | |
| Note. – Col. (2) line rest frequency (GHz); Col. (3) Half Power Beam Width (″) | ||||||
| Col. (4) System Temperature (K, main beam scale); Col. (5) Channel Spacing (km s-1); | ||||||
| Col. (6) Usable velocity coverage (km s-1); Col. (7) Number of observed positions. | ||||||
| line | intensity | |||
|---|---|---|---|---|
| (1) | (2) | (3) | (4) | (5) |
| FCRAO spectra | ||||
| N2H+(1–0) | 0.520.03 | 4.2390.014 | 0.3540.033 | 4.63.2 |
| CS(2–1) | 0.410.02 | 4.2790.014 | 0.6770.031 | … |
| C18O(1–0) | 0.840.02 | 4.2240.005 | 0.4840.012 | … |
| 13CO(1–0) | 3.180.07 | 4.2580.008 | 0.8640.019 | … |
| 12CO(1–0) | 9.300.17 | 4.2110.022 | 2.2610.049 | … |
| IRAM-30m spectra | ||||
| N2H+(1–0) | 1.8500.032 | 4.2420.004 | 0.3540.009 | 6.10.8 |
| N2H+(3–2) | 0.2630.036 | 4.2700.035 | 0.4430.058 | 0.100 |
| N2D+(1–0) | 0.2030.010 | 4.2480.007 | 0.2840.020 | 2.11.6 |
| N2D+(2–1) | 0.1820.015 | 4.2730.010 | 0.3070.029 | 0.100 |
| N2D+(3–2) | 0.0660.014 | 4.3030.044 | 0.3150.128 | 0.100 |
| C17O(1–0) | 0.4760.022 | 4.2290.009 | 0.3100.027 | 2.41.5 |
| CSO spectra | ||||
| C18O(2–1) | 0.6410.036 | 4.2700.019 | 0.5750.048 | 1.4a |
| C17O(2–1) | 0.3440.035 | 4.0920.023 | 0.4890.051 | 0.100 |
| HCO+(3–2) | 0.3160.015 | 4.4100.019 | 0.8190.041 | … |
| H13CO+(3–2) | 0.0250.019 | … | … | … |
| HCN (3–2)c | 0.03 | … | … | … |
| Note. – Col. (2) (K km s-1) (in presence of hyperfine structure | ||||
| we integrated over all the components; 12CO and 13CO lines were | ||||
| integrated between 1 and 7 km s-1 and 3 and 5.5 km s-1 respectively); | ||||
| Col. (3) Rest velocity (km s-1) | ||||
| Col. (4) Full width half maximum (km s-1); | ||||
| Col. (5) Sum of the opacity of all the hyperfine components. | ||||
| Opacity was evaluated from the opacity of C17O (2–1) and assuming the | ||||
| relative abundance as in Wilson & Rood (1994). | ||||
| Upper limit on integrated intensity was evaluated for a line-width | ||||
| equal to H13CO+(3–2). | ||||