An extensive library of 2500-10500 Å synthetic spectra††thanks: Figure 1 available only in electronic form at CDS via anonymous ftp to cdsarc.u-strasbg.fr (130.79.128.5) or via http://cdsweb.u-strasbg.fr/cgi-bin/qcat?J/A+A/. The entire library of synthetic spectra is accessible via http://archives.pd.astro.it/2500-10500/ or (for the 1 Å/pix version only) http://gaia.esa.int/spectralib/spectralib1A/ SpectraLib1a.cfm
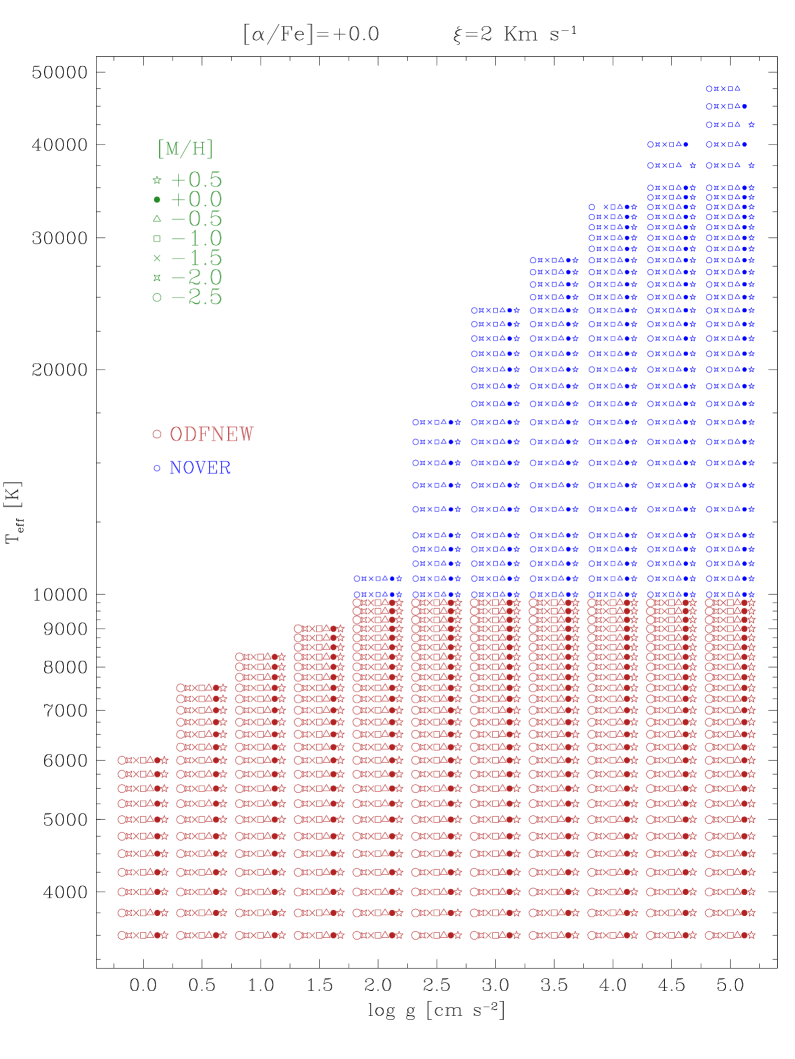
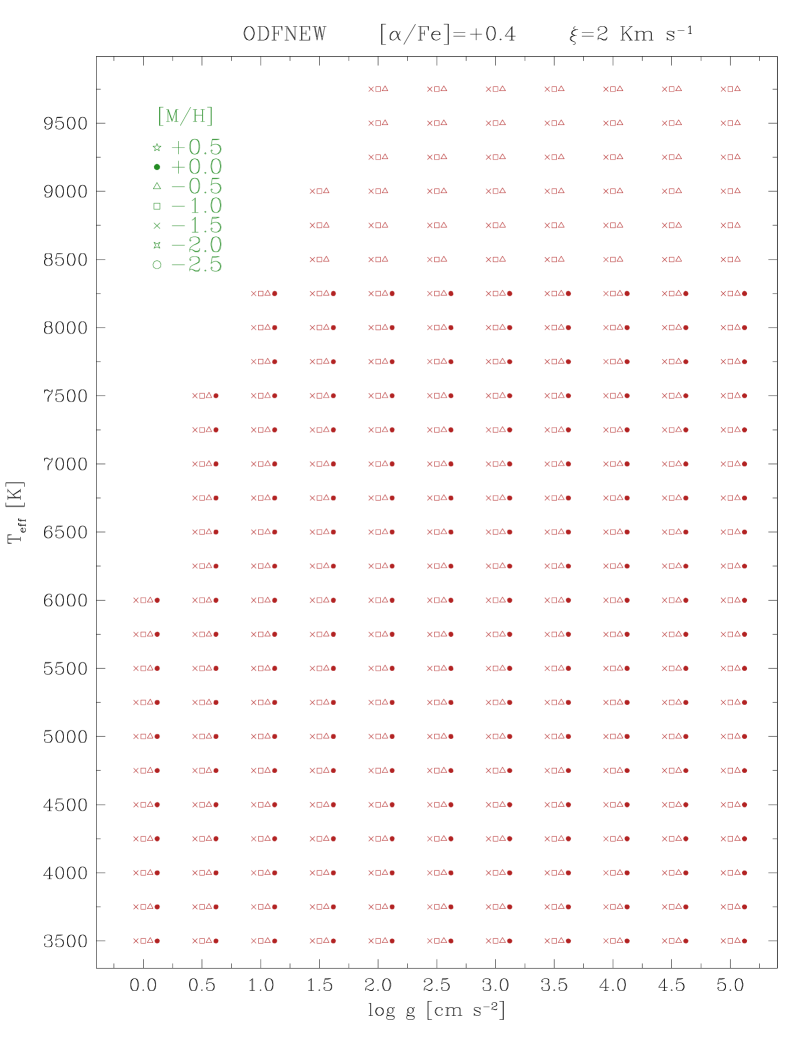
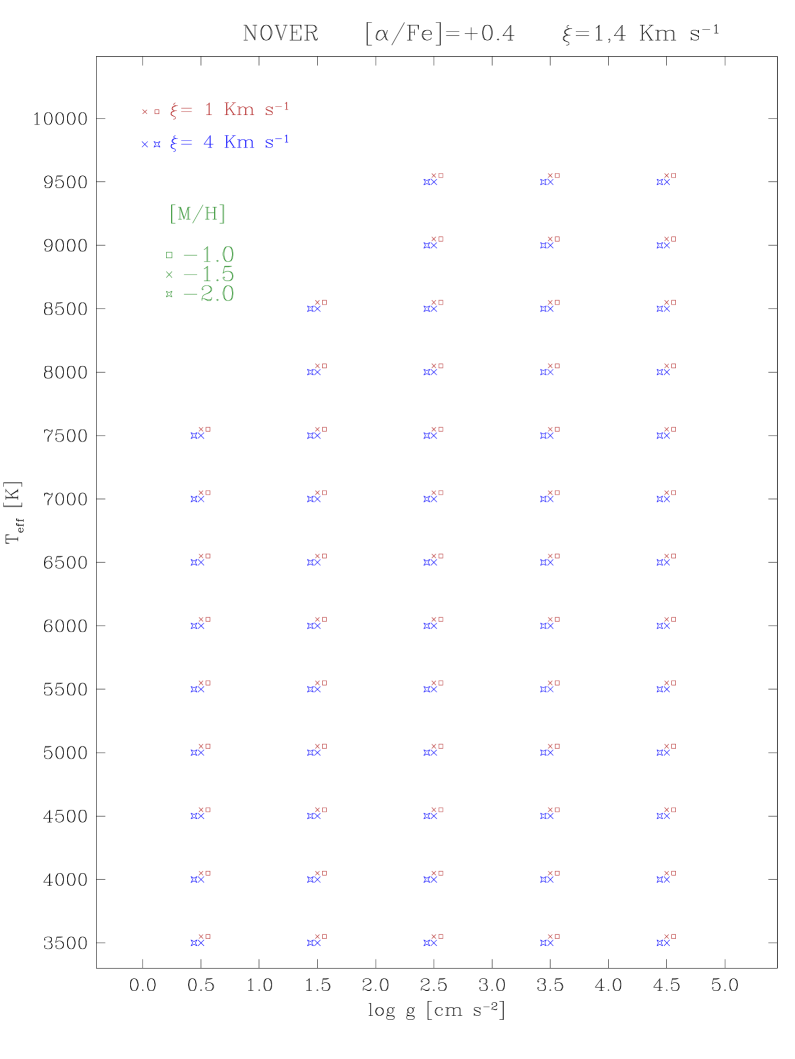
We present a complete library of synthetic spectra based on Kurucz’s codes that covers the 2500–10 500 Å wavelength range at resolving powers =20 000, 11 500 ( GAIA), 8500 ( RAVE), 2000 ( SLOAN) and uniform dispersions of 1 and 10 Å/pix. The library maps the whole HR diagram, exploring 51 288 combinations of atmospheric parameters spanning the ranges: 3500 K, 0.0, 2.5 [M/H] 0.5, [/Fe] = 0.0,+0.4, =1,2,4 km sec-1, 0 500 km sec-1. The spectra are available both as absolute fluxes as well as continuum normalized. Foreseen applications of the library are briefly discussed, including automatic classification of data from spectroscopic surveys (like RAVE, SLOAN, GAIA) and calibration of differential photometric indexes. Data distribution and access to the library via dedicated web page are outlined.
Key Words.:
Astronomical data bases – Stars: atmospheres – Stars: fundamental parameters – Surveys1 Introduction
The interest in large and complete synthetic spectral libraries of normal stars ranges over many different application areas, including () automatic analysis and classification of large volumes of data, like those collected by ongoing spectral surveys, () derivation of radial velocities via cross-correlation against best matching templates, () calibration of spectroscopic line/band classification criteria, and () calibration of photometric indexes. Tasks - require the synthetic spectra to match the absorption lines in observed spectra normalized to the local continuum, generally irrespective of how well the overall spectral energy distribution is reproduced. The goal of task is instead to match the energy contained within photometric bands, irrespective of the performance on the individual absorption lines. Therefore, synthetic spectral libraries well suited for one task does not necessarily perform equally well on another. For example, within the Kurucz’s synthetic spectra suite, the inclusion in the computations of the so called ‘predicted lines’ (hereafter PLs, Kurucz 1994) limits the range of applications. The PLs are calculated absorption lines due to transitions involving one and sometimes two levels whose locations are predicted by atomic structure codes. Wavelengths for these lines may be uncertain by 10 Å, with large uncertainties affecting also their computed intensity. As a consequence the predicted lines may not correspond in position and size to the observable counterparts (cf. Bell et al. 1994, Castelli and Kurucz 2004). For all these reasons the predicted lines are not intended to be used for the analysis of high resolution spectra, but are an essential contribution to the total line blanketing in model atmospheres and spectral energy distribution computations. Very accurate line wavelengths and shapes are in fact not needed for the statistical computations of the line opacity in model atmospheres as well as for the prediction of low resolution spectra.
Various libraries of synthetic spectra are becoming available, and they are summarized and compared in their basic characteristics in Table 1. These libraries widely differ in wavelength interval, spectral resolution, input model atmospheres and range of atmospheric parameters explored, so that their overlapping is not significant.
As other libraries in Table 1, our one is based on Kurucz’s atmospheres, line-lists and computing software. The main goal of our spectral library are spectroscopic applications of the and types above, which imposes for ex. the exclusion of the PLs from computations and therefore no pretension of accurate broad-band photometric performances particularly at the lower temperatures. Other relevant characteristics of our library are the various resolutions and rotational velocities at which it is provided, its wide wavelength range, the adoption of improved model atmospheres based on the new opacity distribution functions (ODFs) by Castelli and Kurucz (2003), the use of the TiO line list of Schwenke (1998), the inclusion of -element enhancement and different micro-turbulent velocities.
2 The spectra
The whole grid of spectra in our library was computed using the SYNTHE code by Kurucz (Kurucz and Avrett 1981, Kurucz 1993), running under VMS operating system on a Digital Alpha workstation in Asiago. We adopted as input model atmospheres the ODFNEW models (http://wwwuser.oat.ts.astro.it/castelli/grids/; Castelli and Kurucz 2003). They differ from the NOVER models (http://kurucz.harvard.edu/grids.html; Castelli et al. 1997) for the adoption of new ODFs, replacement of the solar abundances from Anders and Grevesse (1989) with those from Grevesse and Sauval (1998), and improvements in the molecular opacities among which the adoption of the molecular line-lists of TiO by Schwenke (1998, as distributed by Kurucz 1999a) and of H2O by Partridge and Schwenke (1997, as distributed by Kurucz 1999b). For the combination of atmospheric parameters for which no ODFNEW models were available at the time of writing, we adopted the corresponding NOVER input model atmospheres. We plan to update the library from NOVER to ODFNEW models as more of the latter will become available and to post the result on the library web page (see below). We remark that both the NOVER and the ODFNEW models were computed with the overshooting option for the mixing-length convection switched off, while Kurucz (K) atmospheric models (also available from http://kurucz.harvard.edu/grids.html) were computed with the overshooting option switched on. Several papers have demonstrated that for stars with active convection (9000 K) the no-overshooting convection treatment provides better agreement with the observations than the overshooting case does (Castelli et al. 1997, Smalley and Kupka 1997, Gardiner et al. 1999, Smalley et al. 2002). The no-overshooting models used by us were computed for the mixing-length parameter to the scale height of 1.25. This value allows to fit the observed solar irradiance, while a lower value, like that of 0.5 suggested by Smalley et al., 2002, does it not. On the contrary, 0.5 seems to better fit the wings of H, provided that the position of the continuum is known with an uncertainty smaller than 1%. In fact, a difference of 1% in the position of the solar continuum corresponds to the difference between 0.5 and 1.25 of the mixing-length parameter (Castelli et al., 1997). Generally, it’s very difficult to state the location of the continuum across the wings of the Balmer lines, especially in Echelle spectra which are notoriously severely affected by the blaze function.

![[Uncaptioned image]](/html/astro-ph/0502047/assets/x2.png)
| temperature (K) | 3500 47 500 | steps of 250 K for 10 000 K; proportionally larger for higher |
| gravity (cgs units) | 0.0 5.0 | |
| metallicity | 2.5 [M/H] +0.5 | |
| rotation velocity (km sec-1) | 0 Vrot 500 | 0,2,5,10,15,20,30,40,50,75,100 for 6000 K |
| 0,10,20,30,40,50,75,100,150,200,250,300,400,500 for 6000 K | ||
| enhancement | [/Fe] = 0.0, +0.4 | [/Fe]=+0.4 for [M/H]=0.5, 1.0, 1.5 |
| micro-turbulent velocity (km sec-1) | = 1, 2, 4 | 1 and 4 km sec-1 for [/Fe]=+0.4 |
| ODFs | new | old where new ones not yet available |
| predicted lines | excluded |
In computing the synthetic spectra we used the Kurucz’s atomic and molecular line-lists (Kurucz 1992). The effects of several molecules were taken into account, including C2, CN, CO, CH, NH, SiH, SiO, MgH and OH. The TiO molecular lines (from Schwenke 1998) were included in the computation when 5000 K. The synthetic spectra are calculated and made available both as fluxes for unit wavelength and as normalized intensities. The latter have a different meaning from the normalization to the continuum of the observational spectroscopy jargon, where the location of the continuum is taken to be represented by the regions away from absorption lines or bands. In synthetic spectra, a continuum normalized spectrum is obtained by dividing the absolute fluxed spectrum by its calculated continuum. Noticeable differences are essentially limited to the head of the Paschen and Balmer series of hydrogen, and to the coolest stars dominated by molecular bands.
3 The library
The spectra in our library covers from 2500 to 10500 Å and were calculated at a resolving power RP==500 000 and then degraded by Gaussian convolution to lower resolving powers and properly re-sampled to Nyquist criterion (the FWHM of the PSF being 2 pixels), to limit the data volume and therefore facilitate the distribution.
The highest resolving power for our library is =20 000, which is typical of moderately high resolution Echelle observations, as the spectral database of real stars of Munari and Tomasella (1999) and Marrese et al. (2003). The library is also provided at the resolving powers of the SLOAN survey =2 000 (York et al. 2000), of the RAVE survey =8 500 (Steinmetz 2003, Munari et al. 2005) and of the Gaia space mission =11 500 (Katz et al. 2004, Wilkinson et al. 2005). Furthermore, the present library is also made available at the uniform dispersions of 1 and 10 Å/pix (again with the FWHM of the PSF being 2 pixels). The latter two are intended to be of assistance in classification of medium and low resolution grating spectra obtained in single dispersion mode (as with conventional B&C spectrographs or EFOSC-like imager/spectrographs).
Each spectrum is provided for a range of rotational velocities, as detailed in Table 1, spanning 14 values between 0 and 500 km sec-1 for stars hotter than 6000 K and 11 values between 0 and 100 km sec-1 for cooler ones.
The explored combinations of parameters in Table 2 give rise to 51 228 spectra, each provided in six different combinations of resolving power and sampling, and two flux varieties (absolute units and normalized intensities). The total number of individual spectra contained in this library is therefore 51 28862=615 456. The spectra are provided as gzipped ASCII files containing only the flux column, the common wavelength column being given separately only once for each of the six resolutions. The adopted scheme for the naming of files is outlined in Table 3.
All spectra in the library can be directly accessed and retrieved through the dedicated web page http://archives.pd.astro.it/2500-10500/. The version of the library at 1 Å/pix is accessible also via ESA’s web site http://gaia.esa.int/spectralib/, where browsing facilities based on Virtual Observatory tools are provided. A distribution via DVDs will be possible in special cases (to be arranged directly at munari@pd.astro.it).
| example: T04000G45M05V015K2ANWNVR20F.asc | ||
|---|---|---|
| characters | meaning | |
| 1–6 | T04000 | (K) |
| 7–9 | G45 | 10 (cgs units) |
| 10 | M | sign for metallicity: M=‘’, P=‘+’ |
| 11–12 | 05 | 10 [M/H] |
| 13–16 | V015 | rotational velocity (km sec-1) |
| 17–18 | K2 | microturbulent velocity (km sec-1) |
| 19 | A | [/Fe] enhancement: S=0.0, A=+0.4 |
| 20–21 | NW | NW = new ODF models, |
| OD = old ODF models | ||
| 22–23 | NV | no overshooting |
| 24–26 | R20 | R20 = resolving power 20 000; |
| RVS = resolving power 11 500 (GAIA); | ||
| RAV = resolving power 8500 (RAVE); | ||
| SLN = resolving power 2000 (SLOAN); | ||
| D01 = 1 Å/pix dispersion; | ||
| D10 = 10 Å/pix dispersion | ||
| 27 | F | F=fluxed spectrum (erg cm-2 sec-1 Å-1 ) |
| N=normalized spectrum | ||
4 Test applications
To evaluate the spectroscopic and photometric performances of our library we have carried out several tests. They support the fully satisfactory use of the library in spectroscopic applications (our main goal), while caution applies on the photometric use at the lower temperatures and/or shorter wavelengths. It is worth noticing that significant discrepancies affect the comparison of available libraries with observational data over blue wavelengths and low temperatures.
4.1 Eclipsing binaries
A heavily demanding spectroscopic application of our library has been carried out by Siviero et al. (2004) and Marrese et al. (2005) in state-of-the-art investigation of double-lined solar type eclipsing binaries, as a source for () best matching templates in cross-correlation determination of radial velocities and () reference grid in analysis of atmospheric properties of binary components. They used the =20 000 version of the library.

The availability of a wide and complete range of rotational velocities for all the spectra in our library always allowed to select the best template even with binaries characterized by high rotations, a key ingredient to reach absolute precisions better than 1 km sec-1 in individual radial velocities even on modest S/N spectra.
The derivation of atmospheric parameters via fitting to the library converged independently to the same values as derived geometrically by the orbital solution. The and orbital determinations provide the same gravities within 0.03 dex, the same rotational velocities within 4 km sec-1 and the same difference in temperature between the two components within 42 K (0.6%). The metallicity was indirectly derived by the orbital solution via matching with theoretical isochrones tracks on the temperature-luminosity plane. The values derived in this way are confirmed within 0.06 dex by direct analysis. Given the significant rotation exhibited by components of binaries (generally synchronous with orbital motion) the wide range of rotational velocities covered by our library proved once again to be a mandatory ingredient for accurate results.
The above results would have been significantly degraded if, instead of our one, it would have been used a library computed with inclusion of the PLs. To support this assertion we have re-run exactly the same fits of Siviero et al. (2004) and Marrese et al. (2005) using an identical grid of synthetic spectra, this time however computed on purpose with the inclusion of PLs. In the case of V570 Per the use of spectra with PLs pushes the fit away from the geometrical solution by =109 K and [M/H]=0.16, and by =98 K, =0.10 and [M/H]=0.11 for V432 Aur (average values for the components of the given binary). The differences are always in the sense that inclusion of PLs pushes the fit away from the correct one by going toward cooler temperatures and lower metallicities. This is an expected, systematic trend. In fact, the inclusion of PLs causes the continuum in synthetic spectra to become fainter (cf. bottom panel of Figure 2), causing a reduction in the contrast between strong absorption lines (those dominating the outcome of the fit) and the adjacent continuum. To re-establish the proper contrast, the fits a cooler temperature. Also fitting a lower metallicity helps in re-establish the proper contrast. In fact, PLs are mainly a forest of weak, optically thin lines that respond much faster to a small change in metallicity than the stronger absorption lines which are much closer to optically thick conditions than PLs.
We observed also a reduction in the accuracy of the radial velocities, which is however more difficult to quantify. In fact, it appears as a systematic shift (toward shorter or longer wavelengths) dependent on the actual wavelength interval and the orbital phase. This is caused by the beating in the cross-correlation between the pattern of PLs and the observed absorption lines which is function of both and radial velocity separation between the binary components. The presence of these locally different systematic shifts become evident only when radial velocities from various wavelength intervals on the same spectrum are inter-compared (like those provided by individual orders in an Echelle spectrum). The overall effect is an increase of the scatter of individual measurements, different in amount from spectrum to spectrum.
This concerns the analysis performed on wavelength regions dominated by weak PLs, as in the example on the bottom panel of Figure 2. There are however limited wavelength intervals where PLs much stronger than usual are stochastically clustered together. The result of a fit performed on any such interval would provide non-sense results. One such interval is illustrated in Figure 3, where the observed spectra of V432 Aur and V570 Per are taken from Siviero et al. (2004) and Marrese et al. (2005). While the fit with synthetic spectra computed without PLs provide - for the values of the atmospheric parameters derived by the geometrical orbital solution - an almost perfect match to the observed spectra, the same spectra computed with inclusion of PLs bear no resemblance at all to the observed spectrum. It is evident that the photometric calibration of a color-index that includes a narrow band centered on such a wavelength interval would provide non-sense results if carried out on synthetic libraries computed with PLs.

4.2 RAVE spectra
We are engaged in the data analysis of the RAVE spectroscopic survey of the galactic Halo (Steinmetz 2003, Munari et al. 2005) with the 6dF fiber positioner and spectrograph at the UK-Schmidt at the Anglo-Australian Observatory. The survey is carried out at high S/N over the 8420–8780 Å interval at =8 500 resolving power.
Two low galactic latitude calibration fields rich in HD stars (1607m492 and 1716m425) have been observed a few times during the survey. Spectral classification of these stars are taken from the Michigan Project (Houk 1978). To test the performance of our library, we have fitted the spectra of these HD stars against our library of synthetic spectra in its =8 500 version. The results of the fitting are presented in Figure 4. The right panels illustrate the accuracy of the achieved fits by over-plotting observed and synthetic spectra for the sample cases of a Sun analogue and of a A-type star. The and values derived by the fit well match those expected from the G2V and A7IV classifications following the calibration by Straizys and Kuriliene (1981). For the whole sample of HD stars observed in the two calibration fields, the left panels of Figure 4 compare the and values derived by the fitting with those expected on the base of the spectral classification and the Straizys and Kuriliene (1981) calibration. The results in Figure 4 show an agreement within 3% for and better than 0.25 dex in , the dispersion being almost entirely accountable for by the natural width in both and of a spectral sub-type and a luminosity class in the MK classification scheme.
4.3 The distance to the Pleiades
The present library, in the 1 Å/pix version, was used in differential broad-band photometric applications by Munari et al. (2004) while deriving a precise distance to the Pleiades via orbital solution of the eclipsing binary member star HD 23642, which spectral type is A2V.
Magnitudes in ten different photometric systems were found in literature for this star, and they were used to derive temperature, gravity and reddening of both components of the binary via calibration on our spectral libraries of the color indexes of each photometric system. The zero point of colors was fixed to 0.00 for a Vega model characterized by =9400, =3.9, [M/H]=0.5 and =0.0 km sec-1 downloaded from Kurucz’s web site.
The photometric results on atmospheric and reddening parameters so derived for both components of HD 23642 were confirmed by high resolution spectroscopy and the orbital solution. The successful photometric application of the library was made possible by the proximity in the parameter space of HD 23642 and the calibrator Vega.
4.4 Broad-band photometric tests
To test the broad-band photometric performances of our library we have investigated the reproduction of observed colors along the Main Sequence (MS). The results are shown in Figures 5 and 6, where the and of stars along the main sequence were adopted from Straizys and Kuriliene (1981). We stopped at M2V as the MS faint end, because later types are characterized by cooler than the 3500 K limit of our library (cf. Table 4). We included as a term of comparison all the other libraries from Table 1 for which data are actually accessible and are characterized by a wavelength coverage wide enough to cover at least three consecutive photometric bands. In this regard, a word of caution is necessary when considering the results from Martins et al. (2005) library, which red limit is placed at 7000 Å where the band has still 1% transmission and does reach 0.0 only at 7400 Å. The effect of missing this far red wing of the transmission profile has effects on colors of cooler stars by making their color marginally bluer.

To assist in the interpretation of the result of the photometric tests we have also recomputed the spectra of our library that define the MS, this time with inclusion of PLs (these spectra are available on the library web page). In Figure 5 and 6 by ‘NOVER 1221 pt’ and ‘ODFNEW 1221 pt’ we mean the flux distributions that are predicted directly from the model atmosphere code, not to be confused with the spectra generated by the spectral synthesis code.

Figure 5 illustrates the behaviour on classical 2-color diagrams. Our library perform similarly well to the others on the , plane for colors bluer than 0.7 in . For redder colors, the synthetic MS has colors too blue by some hundredths of a magnitude. The inclusion of PLs in the computation brings the synthetic MS in close agreement with the observed one and very close to the ODFNEW 1221 pt flux distributions. The effect of adopting the ODFNEW models atmospheres affects the lowest temperatures where the synthetic spectra (with and without PLs, as well as the 1221 pt flux distributions) fails to match the very red colors observed in real stars, with the synthetic MS displaying a small upward hook.
Figure 6 illustrates the data in a different format and expanded scale. The difference in the single color between real stars and synthetic spectra are plotted as function of the spectral type along the MS. This diagram highlights better the scatter between observed colors and those from synthetic spectra, particularly in . It shows that, in all colors, significant departures of our library from observations are limited to spectral types cooler than K4V (4500 K).
![[Uncaptioned image]](/html/astro-ph/0502047/assets/x7.png)
Having already proved the satisfactory spectroscopic performance of our library, we refrain from discussing any further its broad-band photometric performances and that of the other libraries listed in Table 1, which is clearly beyond the scope of this paper. Figures 5 and 6 should not be considered as the ultimate comparison of the photometric performances of the available synthetic libraries, even if we placed all libraries on the same reference system, using the same band profiles and the same / conversion to spectral type for all of them. Even if different reconstruction of the band profiles or / conversion would have been used, the spread among different synthetic libraries and with respect to observed colors would have remained. As a matter of the caution that one has to bear in main in such comparisons, Table 4 shows the widely different calibration that have been published for the cooler spectral types along the MS considered in Figures 5 and 6.
Acknowledgements.
Support to R.S. by MIUR COFIN2001 program is acknowledged. We would like to thank S.Ansari for managing the library access via the ESA web portal within the framework of GAIA support activities and M.Fiorucci for useful support in connection with treatment of RAVE data. The careful scrutiny and stimulating comments by the anonymous referee were deeply appreciated.References
- (1) Anders, A., Grevesse, N. 1989, GeCoA 53, 197
- (2) Bell, R. A., Paltoglou, G., Tripicco, M. J. 1994, MNRAS, 268, 771
- (3) Bertone, E., Buzzoni, A., Chavez, M., Rodriguez-Merino, L.H. 2004, AJ 128, 829
- (4) Bessell, M.S. 1990, PASP 102, 1181
- (5) Bessell, M.S. 1995, in The Bottom of the Main Sequence and Beyond, C.G. Tinney ed., Springer-Verlag, pag. 123
- (6) Brott, I., Hauschildt, P.H. 2005, in The Three Dimensional Universe with Gaia, M.A.C. Perryman and C. Turon eds., ESA SP-576, 565
- (7) Buser, R. 1978, A&A 62, 411
- (8) Castelli, F., Gratton, R.G., Kurucz, R.L. 1997, A&A 318, 841
- (9) Castelli, F., Kurucz, R. L. 2003, in Modelling of Stellar Atmospheres, IAU Symposium vol. 210, N.E. Pisukunov, W.W. Weiss, D.F. Gray eds., Poster A20 available on CD-ROM (astro-ph/0405087)
- (10) Castelli, F., Kurucz, R. L. 2004, A&A, 419, 725
- (11) Chavez, M., Malagnini, M. L., Morossi, C. 1997, A&AS 126, 267
- (12) Drilling, J.S., Landolt, A.U. 2000, in Allen’s Astrophysical Quantities 4th ed., A.N.Cox ed., AIP Press, Springer
- (13) Fitzgerald, M. Pim 1970, A&A 4, 234
- (14) Gardiner, R.B., Kupka, F., Smalley, B., 1999, A&A 347, 876
- (15) Grevesse, N., Sauval, A.J. 1998, SSRv 85, 161
- (16) Houk, N. 1978, Michigan Catalogue of Two-Dimensional Spectral Types for the HD Stars, University of Michigan
- (17) Katz, D., Munari U., Cropper, M. et al. 2004, MNRAS 354, 1223
- (18) Kurucz, R.L. 1992, RMxAA 23, 45
- (19) Kurucz, R.L. 1993, SYNTHE Spectrum Synthesis Programs and Line Data, CD-ROM Nr. 18
- (20) Kurucz, R.L. 1994, Atomic Data Opacity Calculations, CD-ROM Nr. 1
- (21) Kurucz, R.L. 1999a, TiO Linelist from Schwenke (1998), CD-ROM Nr. 24
- (22) Kurucz, R.L. 1999b, H2O Linelist from Partridge and Schwenke (1997), CD-ROM Nr 26
- (23) Kurucz, R.L., Avrett, E.H. 1981, SAO Spec.Rep. 391
- (24) Marrese, P.M., Boschi, F., Munari, U. 2003, A&A, 406, 995
- (25) Marrese, P.M., Munari, U., Sordo, R., Dallaporta, S., Siviero, A., Zwitter, T. 2005, A&A, in press (astro-ph/0411723)
- (26) Martins, L.P., Delgado, R.M.G., Leitherer, C., Cervino, M., Hauschildt, P. 2005, MNRAS 358, 49
- (27) Munari, U., Tomasella, L. 1999, A&AS, 137, 521
- (28) Munari, U., Siviero, A., Dallaporta, S. et al. 2004, A&A 418, L31
- (29) Munari, U., Zwitter, T., Siebert, A. 2005, in The Three Dimensional Universe with Gaia, M.A.C.Perryman and C.Turon eds., ESA SP-576, 529
- (30) Murphy, T., Meiksin, A. 2004, MNRAS 351, 1430
- (31) Partridge, H., Schwenke, D.W. 1997, JChPh 106, 4618
- (32) Rodriguez-Merino, L.H., Chavez, M., Bertone, E., Buzzoni, A. 2005, ApJ 626, 411
- (33) Schwenke, D.W. 1998, Faraday Discuss., 109, 321
- (34) Siviero, A., Munari, U., Sordo, R., Dallaporta, S., Marrese, P.M., Zwitter, T., Milone, E.F. 2004, A&A 417, 1083
- (35) Smalley, B., Kupka, F. 1997, A&A 328, 349
- (36) Smalley, B., Gardiner, R.B., Kupka, F., Bessell, M.S. 2002, A&A 395, 601
- (37) Steinmetz, M. 2003, in GAIA Spectroscopy, Science and Technology, U.Munari ed., ASP Conf. Ser. 298, 381
- (38) Straizys V. 1992, Multicolor Stellar Photometry, Pachart Publishing House, Tucson
- (39) Straizys, V., Kuriliene, G. 1981, Astr.&Sp.Sc. 80, 353
- (40) Sviderskiene, Z. 1988, Vilnius Obs. Bull. 80, 3
- (41) York, D.G., Adelman, J., Anderson, J.E.Jr et al. 2000, AJ 120, 1579
- Zwitter, Castelli, Munari (2004) Zwitter, T., Castelli, F., Munari, U. 2004, A&A 417, 1055
- (43) Wilkinson, M.I., Vallenari, A., Turon, C. et al. 2005, MNRAS 359, 1306