Detection of Intracluster Planetary Nebulae in the Coma Cluster111Based on data collected with the FOCAS spectrograph at the Subaru Telescope, which is operated by the National Astronomical Observatory of Japan, during observing run S04A-024.
Abstract
[OIII]Å emission lines of 16 intracluster planetary nebulae candidates in the Coma cluster were detected with a Multi-Slit Imaging Spectroscopy (MSIS) technique using FOCAS on the Subaru telescope. The identification of these faint emission sources as PNe is supported by (i) their point-like flux distribution in both space and wavelength, with tight limits on the continuum flux; (ii) the identification of the second [OIII] line in the only object at high enough velocity that this line too falls into the filter bandpass; (iii) emission line fluxes consistent with PNe at 100 Mpc distance, in the range ; and (iv) a narrow velocity distribution approximately centered on the systemic velocity of the Coma cluster. Comparing with the velocities of galaxies in our field, we conclude that the great majority of these candidates would be intracluster PNe, free floating in the Coma cluster core. Their velocity dispersion is , and their mean velocity is lower than that of the galaxies. The velocity distribution suggests that the intracluster stellar population has different dynamics from the galaxies in the Coma cluster core.
Subject headings:
(ISM:) planetary nebulae: general; galaxies: cluster: general; galaxies: cluster: individual (Coma cluster); galaxies: evolution1. Introduction
Cosmological simulations of structure formation predict that galaxies are dramatically modified by galaxy interactions during the assembly of galaxy clusters, losing a substantial fraction of their stellar mass which today must be in the form of intracluster stars (Murante et al. 2004). Observations now show that there is a substantial amount of intracluster stellar population, which is observed as diffuse intracluster light (ICL, Bernstein et al. 1995), or as individual stars, i.e., planetary nebulae (PNe; Arnaboldi et al. 2003, Feldmeier et al. 2004) and red giant stars (Durrell et al. 2002). The ICL represents about 10% of the stellar mass in the Virgo cluster and as much as 50% in rich Abell clusters (Arnaboldi 2004).
Intracluster planetary nebulae (ICPNe) are the best suited tracers for dynamical studies of the ICL because of their strong [OIII] 5007Å emission, which allows both identification and radial velocity measurement. Measuring the projected phase-space for the ICPNe constrains how and when this light originated (Napolitano et al. 2003). So far, ICPNe velocities have been measured only in the Virgo cluster at 15 Mpc distance (Arnaboldi et al. 2004). Here we extend these studies to the Coma cluster (Abell 1656), one of the best studied nearby galaxy clusters. Of these, it is the richest and the most compact one, providing a laboratory of prime importance for studying the effect of a dense environment on galaxy evolution. The ICL in Coma has been suspected since the early study by Zwicky in 1951 and was confirmed by Thuan & Kormendy (1977) and Bernstein et al. (1995). The brightest PNe in the Coma cluster at distance of (Bernstein et al. 1995) have fluxes of (Ciardullo et al. 2002). To detect even the brightest of the Coma PNe, we must find a way to decrease substantially the noise from the night sky.
We can achieve this with a technique that is similar to the approach used by Tran et al. (2004) and Martin & Sawicki (2004) to search for Ly emitting galaxies at very high redshift. It combines a mask of parallel multiple slits with a narrow band filter, centered around the [OIII]Å line at the redshift of the Coma cluster, to obtain spectra of all PNe that happen to lie behind the slits. Because the [OIII] emission lines from PNe are only a few km s-1 wide, their entire flux still falls into a small number of pixels in the 2D-spectrum, determined by the slitwidth and seeing. On the contrary, the sky emission is dispersed in wavelength, allowing a large increase in signal-to-noise (S/N). The narrow band filter limits the length of the spectra on the CCD, so that more slits can be exposed. For brevity we will refer to this as the Multi Slit Imaging Spectroscopy (MSIS) technique. No conventional imaging technique can decrease the sky surface brightness in a similar way. In this Letter we show that with this technique we are indeed able to detect PNe in the Coma cluster, and briefly describe the first results obtained from one MSIS image in Coma.
2. Observations
The observations were carried out with the FOCAS spectrograph at the 8.2m Subaru telescope on April 23, 2004. The spatial resolution of FOCAS is pix-1, so the diameter of the circular field of view (FOV) corresponds to 3600 pixels. We used grating 300B, which gives a measured dispersion of 1.4–1.5Å per pixel on the two FOCAS CCD chips. We used the N512 filter with FWHM of 60Å, centered at Å, the wavelength of the redshifted [OIII] emission from a PN at the mean velocity of the Coma cluster. The FWHM includes only the galaxy velocity dispersion in the Coma core. We will be able to detect the redshifted [OIII] 4959Å emission only for the brighter PNe with the largest receding velocities, , so that it can be seen near the blue edge of the filter.
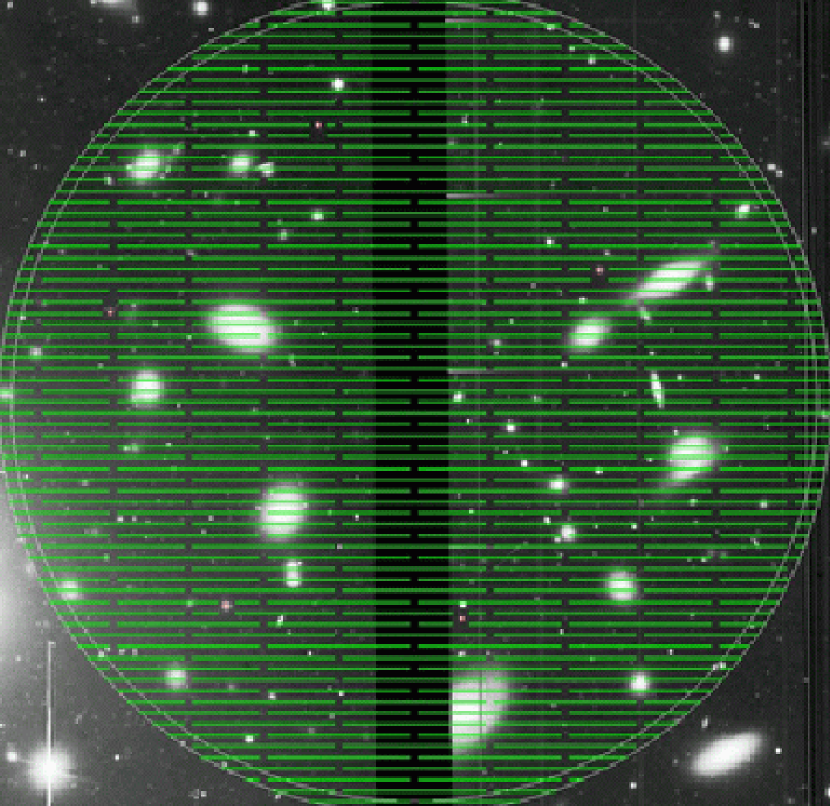
The light passing through the narrow band filter and a -wide long slit, and dispersed by the grism projects down to a spectrum of about 43 pixels. A mask was therefore constructed with uniform long slits spaced every 50 pixels, and interrupted only by short sections to ensure mechanical stability (see Fig. 1). The slitlet width on the mask was 0.′′6, corresponding to six 0.′′1 pixels. The area surveyed by this mask configuration is then about slits arcsec2, or 12% of the whole FOCAS FOV.
With this mask, grism, and filter we took six 30 min exposures of a field centered at 12:57:17, +28:09:35 (B1950). This field is near the X-ray centroid of the Coma cluster and is essentially concident with the field observed by Bernstein et al. (1995). The measured seeing of the images varied from 0. to 0.′′8. The CCD readout of the image was done with full spectral resolution and with a spatial binning of 2 pixels. Monochromatic, point-like emitters appear as elongated ellipses on the CCD, with width of approximately 4 rebinned pixels and height of 5 pixels in the wavelength direction. Then the effective spectral resolution is Å, or . Data reduction was carried out in IRAF, with flux calibration using the spectrophotometric standard star BD+33d2642.
2.1. How many PNe do we expect per slit configuration?
We have estimated the average surface brightness of the diffuse light in our Coma core field from the results of Bernstein et al. (1995) to be mag arcsec-2. Assuming B-R = 1.0, the average surface brightness in B in this field is 25.7. The total magnitude in the FOCAS circular field of diameter is then , which amounts to a total luminosity of . To estimate the corresponding number of PNe, we assume that the planetary nebulae luminosity function (PNLF) can be described by the formula of Ciardullo et al. (2002) which is a good fit to numerous observations in nearby galaxies. With the observations described below, we will be complete for PNe mag fainter than the bright cutoff of the PNLF. Using the luminosity-specific PN density determined for an evolved population such as in M87, PN L (Jacoby et al. 1990, Peletier et al. 1990, Ciardullo et al. 1998), we expect PNe associated with the diffuse light in this field, down to 1 mag fainter than the cutoff.
The fraction of the FOCAS FOV surveyed by the mask used in our observations is 12% (see Section 3), giving about 50 PNe located behind the mask slitlets. However, because the seeing FWHM is nearly equal to the slit width, of order half of these will have a significantly lower flux measured than their true flux; for FWHM=slitwidth, a point source at the center (edge) of the slit is dimmed by 24% (51%). Also, we lose a small fraction of the remaining PNe due to the limited filter bandwidth, if these PNe have the same velocity distribution as the Coma galaxies. Thus finally we expect to detect approximately 20–30 PNe per mask.
2.2. The influence of observational parameters on the detectability of PNe
Here we show how the S/N of the detected PNe depends on the observational parameters, mainly seeing, slit-width, and spectral resolution. For a distance modulus of 34.9, a PN at the bright end of the PNLF has a flux in the [OIII] 5007Å line of resolution corresponds to 300 pc at this distance.
For a sky surface brightness , the magnitude of sky in a pixel , and the monochromatic flux from sky at 5500Å in the pixel is , or For a dispersion and slit width , the true spectral resolution is , where is a constant of order unity. In our observational set-up, the CCD is rebinned , giving a spatial resolution , Å, , and . Thus the flux from the sky surface brightness in the rebinned FOCAS pixel is For our instrumental set-up, we have measured on the flux-calibrated two-dimensional spectra which gives an effective at 5120Å, inserting our pixel sizes and spectral resolution.
The PN as a point-like, monochromatic source falls onto pixels, where in our observations the seeing is FWHM and . We can thus compute the total signal-to-noise for a PN source. For a total integration time of 3 hrs, i..e. sec, a total telescope area of cm2, and an overall efficiency of telescope + spectrograph + airmass, , and at Å we obtain
| (1) |
for a PN fainter than the cutoff by magnitudes. Relative to the sky noise in one pixel, the S/N of a PN at the PNLF cutoff would be 32. Both values assume that the emission from the PN falls through the slit completely. Detection of a source is normally considered to be secure if the S/N relative to the sky noise in one pixel is . In our data this corresponds to , i.e., probability of the source being real. If we use this criterion for secure detection, we can detect PNe about 1.4 magnitudes down the PNLF.
Equation (1) shows that independent of all other parameters, good seeing is critical for these observations. Also the increases like the inverse square root of the true spectral resolution. However, so that the light of a PN falls through the slitlet completely, we must have . Because large slitwidths degrade the spectral resolution, there exists a trade-off between and the number of PNe that can be observed throught the mask (previous subsection). Consider that the PNLF has a sharp cutoff and then it is nearly flat. Therefore, as long as the remains large enough that we can detect PNe one magnitude fainter than the bright cutoff, it is advantageous to use larger slit-widths. For with a larger slit-width, the additional PNe that come through the mask outnumber the PNe that are lost at the faintest fluxes. Typically, to observe one slit configuration for hours will work as long as the seeing is not worse than .

3. Results and Discussion: PNe in the Coma Cluster
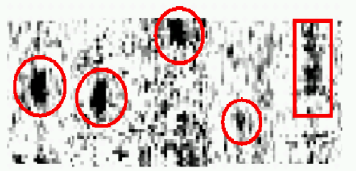
A total of 16 spectrally unresolved, point-like sources with undetected continuum were detected on the two CCD chips. Their emission line fluxes were in the range . Objects with a flux of less than (5 ADU) were considered as not real. Figure 2 shows two-dimensional spectra of the two brightest objects, an intermediate flux source, and a low S/N emission. These are all PN candidates. Fig. 2 also shows a source with a possible emission line and a continuum redwards of the line, but no continuum on the blue side, most likely a Ly-absorbed background galaxy.
We now consider the evidence that the unresolved emission sources are in fact planetary nebulae. Figure 3 shows their 1-d spectra, obtained by summing the respective columns in the 2-d-spectra. The intermediate flux source in Fig. 2 is at sufficiently large recession velocity that, if the observed line is [OIII]Å, the second Å line also falls into the narrow band filter. In fact, its 1-d-spectrum in Fig. 3 does show both lines of the doublet: the ratio of the equivalent widths of both lines is consistent with the theoretical value of 1:3.
The brightest object has measured counts of 34.7 ADU in the median image, corresponding to a total line flux of , and is detected at S/N. The faintest PN candidate has a S/N, a line flux of 5.6 ADU, corresponding to , or a total of 68 [OIII]Å photons in three hours, about one photon every three minutes. The flux from a PN in Coma at the bright cutoff of the PNLF is (Section 2)222In the [OIII] PNe magnitudes defined by Jacoby (1989) these two objects have m and m, and the bright cut-off of the PNLF in Coma is at .. Note that our emission sources are generally not centered in the slitlets, and even if they are, we lose 24% (38%) of the flux, given the slitlet width of 0.′′6 and a seeing FWHM of (). Thus the brightest fluxes we measure are consistent with PNe in Coma at the cutoff of the PNLF.
Our candidates are also undetected in the continuum. The -upper limit on the pixel flux for the extracted spectra in the range ÅÅ, excluding the line, is 3.4 ADU, corresponding to a continuum flux limit of . Our brightest object thus has EW110Å. The V-band continuum flux of an O8 star at the distance of Coma is – with our observing technique we would see the continuum from a few O stars in the Coma cluster! This rules out compact HII regions such as or brighter than those observed in Virgo (Gerhard et al. 2002). Similarly, background galaxies would often have a much larger continuum flux than our limit; for example, see the background object shown in Fig. 2. For our brightest candidates, the large equivalent widths are larger than those of known [OII] emitters at (Hogg et al. 1998). The line fluxes we measure are 10 - 100 times fainter, and the surface number density is 10 - 100 times higher, than for currently studied Ly emitters at (Fynbo et al. 2003). Moreover, in the flux decade brighter than our brightest line flux, we see no object without measurable continuum, and only one object with blue continuum, for which EW=50Å.
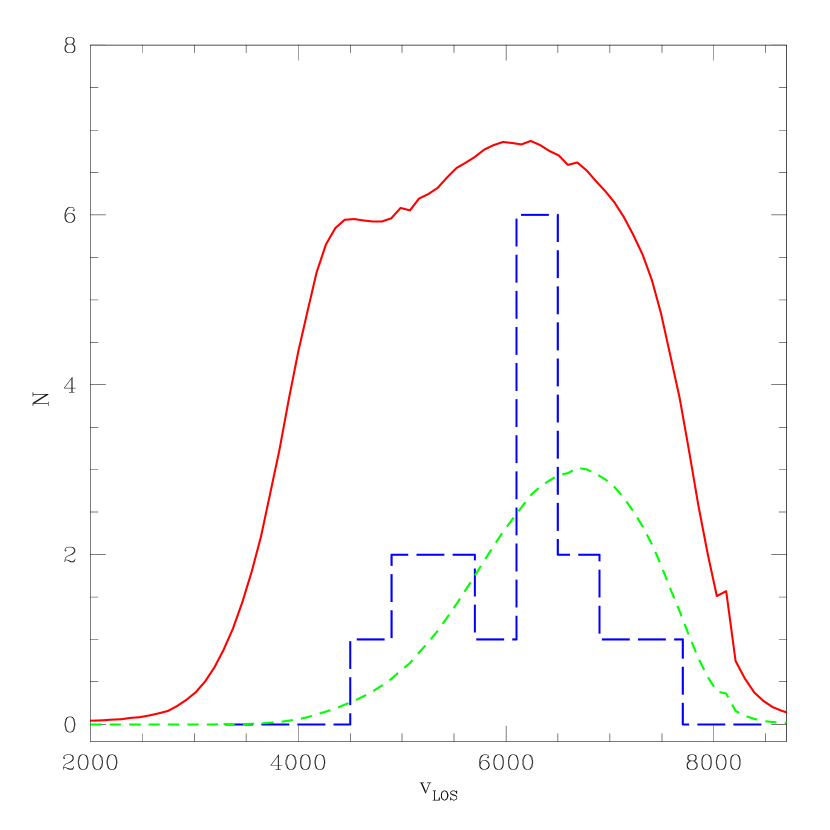
Figure 4 shows the velocity histogram for our PNe candidates. They have velocities between . With our instrumental setup, we detect wavelengths in the range Å (FWHM), or velocities in . The velocity histogram is clearly not uniform in the filter bandpass (Fig. 4); an unclustered population of background emission line galaxies would appear as such a nearly uniform distribution, because only the faintest objects near the filter edges would fall out of the sample.
In summary, we have the following evidence that our unresolved emission sources are PNe in the Coma cluster: (i) They are unresolved both spatially and in wavelength. (ii) They have no detectable continuum, to a limit of . The brightest object thus has EWÅ. (iii) We have seen both lines of the [OIII] doublet in the only source at sufficiently large recession velocity that also Å is redshifted into the wavelength range probed. (iv) The emission fluxes of the brightest objects are consistent with those of the brightest PNe in a population at distance 100 Mpc. (v) The number density of our candidates is consistent with that expected from the measured surface brightness of the ICL in our Coma field. (vi) The distribution of recession velocities is centered around the Coma cluster and is inconsistent with a population of background objects uniformly distributed in velocity. However, we cannot rule out that a population clustered in velocity of so far undetected low-luminosity background emission galaxies could contribute to our sample, if these exist in sufficient numbers at (Ly) or ([OII]).
From Bernstein et al. (1995), approximately half of the total luminosity in our field is in the ICL component of the Coma cluster, the other half is in the brighter galaxies, while faint galaxies do not contribute significantly. In the PNe, we expect a larger diffuse light fraction: PNe near bright galaxies will be harder to see because of the increased background. We have superposed our PNe candidates on the image of the field and compared their velocities with those of the brighter galaxies in the field. None of our candidates is close in space and velocity to any of these, but two PNe have measured velocities and positions that could be consistent with the cD envelope of NGC 4874, which is just outside our field, from the field center. NGC 4874 itself has a radial velocity of and a velocity dispersion of (Smith et al. 2000). Most of our PNe, which have and , are therefore not associated with the halo of NGC 4874.
Thus, the great majority of the detected PNe candidates would be intracluster PNe (ICPNe) in the Coma cluster. It is interesting that the measured mean and dispersion velocities for these ICPNe are smaller than those measured for the Coma cluster core centered around NGC 4874, , velocity dispersion (Colless & Dunn, 1996). A KS test shows that the ICPN velocity distribution has probability 12% to be drawn from the expected velocity distribution of galaxies in our filter (Gaussian times filter band transmission). This suggests that the dynamics of the intracluster population in the Coma core may differ from that of the galaxies, and calls for further investigation.
References
- Arnaboldi (2004) Arnaboldi, M., 2004, in IAU Symp. 217, Recycling intergalactic and interstellar matter, eds. P.A. Duc , J. Brian, E. Brinks, ASP, 54
- Arnaboldi et al. (2003) Arnaboldi, M. et al. 2003, AJ, 125, 514
- Arnaboldi et al. (2004) Arnaboldi, M. et al. 2004, ApJ, 614, L33
- Bernstein et al. (1995) Bernstein, G.M., et al. 1995, AJ, 110, 1507
- (5) Ciardullo, R. et al. 1998, ApJ, 492, 62
- Ciardullo et al. (2002) Ciardullo, R., et. al. 2002, ApJ, 577, 31
- (7) Colless, M., & Dunn, A.M. 1996, ApJ, 458, 435
- Durrell et al. (2002) Durrell, P. R., Ciardullo, R., Feldmeier, J. J., Jacoby, G. H., & Sigurdsson, S. 2002, ApJ, 570, 119
- Feldmeier, Ciardullo, Jacoby, & Durrell (2004) Feldmeier, J. J., Ciardullo, R., Jacoby, G. H., & Durrell, P. R. 2004, ApJ, 615, 196
- Gerhard et al. (2002) Gerhard, O., Arnaboldi, M., Freeman, K.C., Okamura, S. 2002, ApJ, 580, L121
- Fynbo et al. (2003) Fynbo, J.P.U., et al. 2003, A&A, 407, 147
- Hogg et al. (1998) Hogg, D.W., Cohen, J.G., Blandford, R., & Pahre, M.A. 1998, ApJ, 504, 622
- Jacoby, G.H. (1989) Jacoby, G.H. 1989, ApJ, 339, 39
- Jacoby et al. (1990) Jacoby, G.H., Ciardullo, R., Ford, H.C. 1990, ApJ, 339, 39
- Martin and Sawicki (2004) Martin, C.L., & Sawicki, M. 2004, ApJ, 603, 414
- Murante et al. (2004) Murante, G. et al. 2004, ApJ, 607, L83
- Napolitano et al. (2003) Napolitano, N.R. et al. 2003, ApJ, 594, 172
- (18) Peletier, R.F., Davies, R.L., Illingworth, G.D., Davis, L.E., Cawson, M. 1990, AJ, 100, 1091
- (19) Smith, R.J., Lucey, J.R., Hudson, M.J., Schlegel, D.J., Davies, R.L. 2000, MNRAS, 313, 469
- (20) Thuan, T.H., Kormendy, J. 1977, PASP, 89, 466
- (21) Tran K.-V., Lilly, S.J., Crampton, D., Brodwin, M. 2004, ApJ, 612, L89