Observations of Rapid Disk-Jet Interaction in the Microquasar GRS 1915+105
Abstract
We present evidence that minute episodes of jet formation in the Galactic microquasar GRS 1915+105 may sometimes entirely be a superposition of smaller, faster phenomena. We base this conclusion on simultaneous X-ray and infrared observations in July 2002, using the Rossi X-ray Timing Explorer and the Palomar 5 meter telescope. On two nights, we observed quasi-periodic infrared flares from GRS 1915+105, each accompanied by a set of fast oscillations in the X-ray light curve (indicating an interaction between the jet and accretion disk). In contrast to similar observations in 1997, we find that the duration of each X-ray cycle matches the duration of its accompanying infrared flare, and we observed one instance in which an isolated X-ray oscillation occurred at the same time as a faint infrared “subflare” (of duration seconds) superimposed on one of the main flares. From these data, we are able to conclude that each X-ray oscillation had an associated faint infrared flare and that these flares blend together to form, and entirely comprise, the minute events we observed. Part of the infrared emission in 1997 also appears to be due to superimposed small flares, but it was overshadowed by infrared-bright ejections associated with the appearance of a sharp “trigger” spike in each X-ray cycle that were not present in 2002. We also study the evolution of the X-ray spectrum and find significant differences in the high energy power law component, which was strongly variable in 1997 but not in 2002. Taken together, these observations reveal the diversity of ways in which the accretion disk and jet in black hole systems are capable of interacting and solidify the importance of the trigger spike for large ejections to occur on minute timescales in GRS 1915+105.
Subject headings:
accretion, accretion disks — black hole physics — infrared: stars — stars: individual (GRS 1915+105) — X-rays: binaries1. Introduction
GRS 1915+105 is one of the most fascinating objects in astrophysics today. It was one of the first systems in the Galaxy to be identified as a “microquasar” — an X-ray binary with relativistic jets which mimics some of the behavior of quasars on a smaller and closer scale. For a review of these objects, see Mirabel & Rodríguez, 1999 and Fender, 2004; for a review focusing on GRS 1915+105, see Fender & Belloni, 2004. Because timescales in microquasars are expected to be a factor of shorter than in quasars (owing to the much smaller mass of the compact object which powers the system), microquasars are excellent laboratories for investigating accretion disk evolution and jet formation in black hole systems.
GRS 1915+105 was first discovered as a transient X-ray source (Castro-Tirado et al., 1994), and its radio and infrared counterparts have since been identified (Mirabel et al., 1994). The system contains a black hole fed by Roche lobe overflow from a K-M giant companion (Greiner, Cuby & McCaughrean, 2001; Greiner et al., 2001). GRS 1915+105 displays extreme variability in many different wavebands and on many different timescales, making it unique among the X-ray binaries. Its uniqueness is likely due to its extremely high accretion rate, which allows it to regularly reach luminosities unseen in other Galactic X-ray sources (Done, Wardziński & Gierliński, 2004; Fender & Belloni, 2004).
Perhaps the most spectacular variability observed from GRS 1915+105 is seen in high resolution radio maps, which occasionally reveal the presence of resolved, bipolar ejections with flux densities up to mJy that form on timescales of weeks and move away from the system at relativistic speeds (; Mirabel & Rodríguez, 1994; Rodríguez & Mirabel, 1999; Fender et al., 1999a). These events are referred to as “class A” ejections by Eikenberry et al. (2000) to distinguish them from smaller “class B” radio and infrared flares on minute timescales which are also thought to correspond to jet ejection. In addition to the radio and infrared flares, GRS 1915+105 displays a broad range of variability in the X-rays, where it switches between many different states (reviewed extensively by Belloni et al., 2000) and where quasi-periodic oscillations (QPOs) on timescales as fast as Hz have been observed (Remillard et al., 2003; McClintock & Remillard, 2004).
Multiwavelength observations of “class B” events in GRS 1915+105 by Pooley & Fender (1997), Eikenberry et al. (1998a, b), and Mirabel et al. (1998) were the first to reveal the intimate link between accretion disk evolution and relativistic jet formation on short timescales in any black hole system. Eikenberry et al. (1998a) observed a one-to-one correspondence between repeating X-ray variability cycles and infrared flares ( mJy dereddened) on timescales of minutes. The observations are consistent with a picture in which emptying and refilling of the X-ray emitting inner disk (e.g. Belloni et al., 1997a, b) coincides with the ejection of material into a jet, which radiates through synchrotron emission to produce a flare (Fender et al., 1997; Pooley & Fender, 1997). The infrared and X-ray light curves decouple as the ejecta becomes causally separated from the inner disk (Eikenberry et al., 1998a), and as the plasma moves out of the accretion disk plane it can radiatively pump emission lines originating within the disk (Eikenberry et al., 1998b). Each infrared flare appears to be accompanied by a delayed radio flare, perhaps indicating adiabatic expansion of the ejected cloud (Mirabel et al., 1998) or motion along a conical jet (Fender & Pooley, 1998), while the jet itself is resolved by the Very Long Baseline Array as an optically thick synchrotron source of length AU that is variable on similar timescales as the X-rays and infrared (Dhawan, Mirabel & Rodríguez, 2000).
Though subsequent observations have revealed smaller, more complex infrared flaring behavior in this source (e.g. Eikenberry et al., 2000), the above represents the basic picture for the ejection of “class B” jets in GRS 1915+105. In this paper, we present multiwavelength observations of GRS 1915+105 on four nights during July 2002, when the source was undergoing another period of “class B” ejection. The similarities and differences between these observations and those obtained previously allow us to begin to map out how the many different X-ray states of GRS 1915+105 affect jet production in this unusual source. We conclude that the observed ejections may sometimes entirely be a superposition of smaller, more complex phenomena, and that the appearance of a “trigger” spike in the X-ray light curve (seen in the observations of Eikenberry et al., 1998a, but not in our July 2002 observations) is a key ingredient for large, infrared-bright ejections to occur on minute timescales.
2. Observations
We obtained infrared observations of GRS 1915+105 on the nights of 2002 July 27–29 UT in the K () band, using the D-78 camera at the Cassegrain focus of the Palomar Observatory 5 meter Hale telescope. X-ray observations (with coverage between 2–100 keV) were obtained on July 27–28 and July 30 using the Proportional Counter Array (PCA) on the Rossi X-Ray Timing Explorer (RXTE); further details regarding this instrument can be found in Greiner, Morgan & Remillard (1996) and references therein.
We configured the infrared camera to take pixel () images at a rate of one frame per second, with absolute timing provided by a WWVB radio signal from the National Institute of Standards and Technology ( ms accuracy). We observed GRS 1915+105 in this mode for hours on each of the first two nights and for hour on July 29. We processed each image by subtracting an averaged sky frame, dividing by a flat field, interpolating over bad pixels and filtering it in the Fourier domain to remove electronic pattern noise that corrupted many of the images. On July 27, we also observed the faint HST/NICMOS standard GSPC P182-E (star no. 9177 from Persson et al., 1998) for absolute flux calibration.
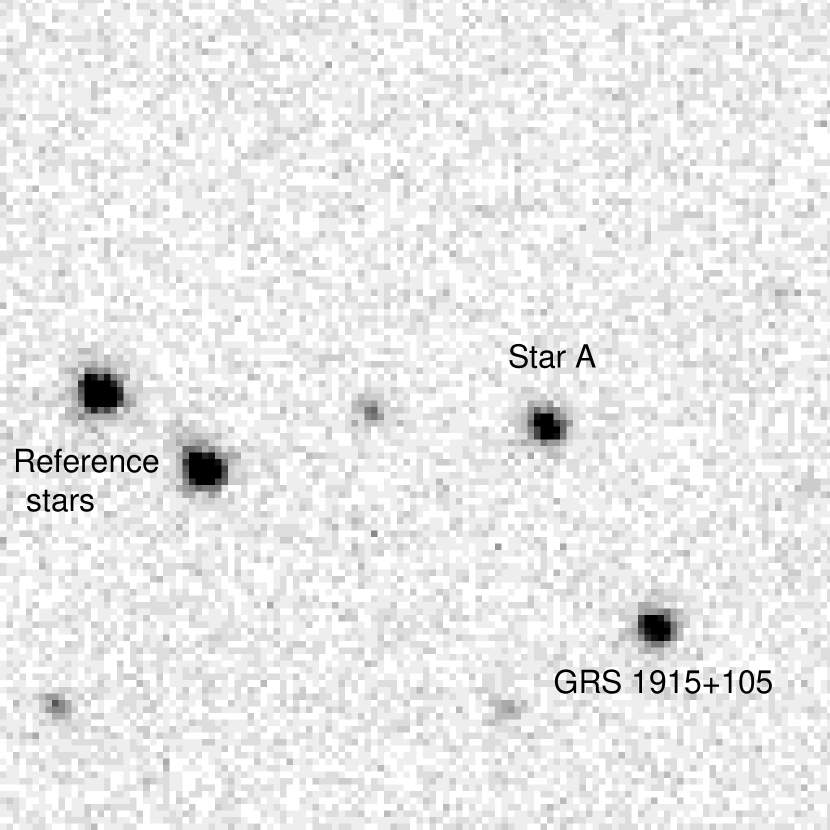
A typical processed image is shown in Figure 1. The field of view is large enough to capture GRS 1915+105 and several nearby stars. We performed differential photometry on GRS 1915+105 and the surrounding field stars, measuring their fluxes within a radius software aperture. We used the two brightest field stars as a reference, averaging their light curves together and dividing the normalized result into the GRS 1915+105 light curve to correct for atmospheric variability and changes in the point spread function. This procedure was also applied to “Star A” in Figure 1; its flux density remained steady at a value of 3.1 mJy (consistent with the reported value in Fender et al., 1997) and was used to determine the flux density of GRS 1915+105. The GRS 1915+105 light curve was then dereddened by magnitudes to correct for absorption in the Galactic plane (Fender et al., 1997). We chose to be consistent with the previous literature, although more recent work suggests that is a better estimate for this source (Fuchs, Mirabel & Claret, 2003; Chapuis & Corbel, 2004). If is adopted, then all the infrared flux densities in this paper should be reduced by a factor of .
For the X-ray analysis, we extracted light curves (at 1-second time resolution) from PCA Standard-1 data using FTOOLS v5.2. We also extracted X-ray spectra in the 3–25 keV range, using data from PCA Binned mode B_8ms_16A_0_35_H_4P and Event mode E_16us_16B_36_1s. We used standard procedures for response matrix generation, background estimation and subtraction, and correction for PCA deadtime. We then used XSPEC v11.2 to fit each spectrum with a standard model for black hole candidates consisting of a “soft” component (which peaks in the low energy X-rays) modeled as a multitemperature disk blackbody (e.g. Mitsuda et al., 1984) and a “hard” component (which extends to the higher energy X-rays) modeled as a power law, both modified by hydrogen absorption fixed to a column density of atoms cm-2 (Muno, Morgan & Remillard, 1999). A systematic error of 1% was added to each spectrum before the fit was performed.
3. Light Curves
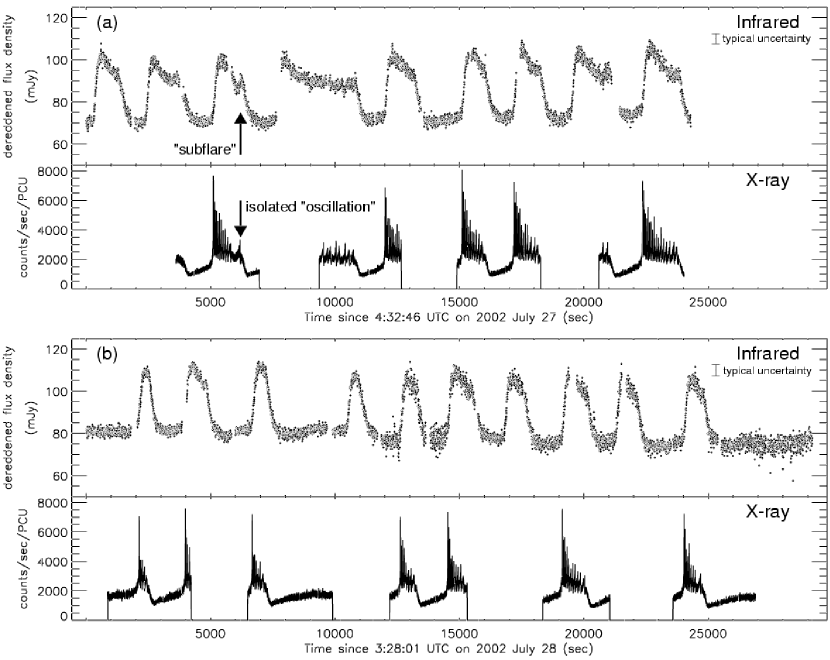
The resulting light curves from July 27–28 are shown in Figure 2. On each night, we detected quasi-periodic infrared flares with dereddened amplitudes of mJy. The flares have durations of 15–30 minutes and repeat on timescales of 30–60 minutes. The accompanying X-ray light curves show GRS 1915+105 undergoing a series of long “dips” and fast oscillations. The particular pattern of X-ray variability seen here has been observed many times in GRS 1915+105; it is the “class ” state defined by Belloni et al. (2000), characterized by oscillations which grow longer and fainter with time before the source enters an X-ray dip of duration seconds.
Our observations on July 29 were limited to hour but showed two infrared flares similar to those seen on July 27–28. This suggests that the state we observed lasted for more than two days. The light curves from July 29 are not shown here because there were no accompanying X-ray observations, but they are available upon request. X-ray observations on July 30 indicated that GRS 1915+105 was no longer undergoing oscillations and had entered a period of hard, steady X-ray emission (the “class ” state of Belloni et al., 2000).
3.1. Multiwavelength Features of the Light Curves
As can be seen from Figure 2, each time the X-ray light curve of GRS 1915+105 switches from a dip into a period of oscillation, it is accompanied by an infrared flare. Furthermore, the flare appears to be triggered by a sharp X-ray “spike” of duration several seconds which is present during each transition.
These features are broadly consistent with previous multiwavelength observations of GRS 1915+105 during “class B” ejections (e.g. Eikenberry et al., 1998a; Mirabel et al., 1998); in fact, many of the X-ray states classified by Belloni et al. (2000) in which the source transitions between a long dip and a period of oscillations are now known to trigger radio (and therefore presumably infrared) flares (Klein-Wolt et al., 2002).
What makes the current observations interesting is their high time resolution and broad coverage of many individual episodes of jet production, matched only by the similar observations of Eikenberry et al. (1998a). By looking at how the subtle differences in X-ray evolution between these two sets of observations lead to differences in the infrared behavior, we can begin to unravel the details of the complicated evolution of GRS 1915+105.

3.2. Origin of the Infrared Flares
Infrared flares similar to those presented here have been observed many times from GRS 1915+105 and have been consistently interpreted as synchrotron emission from a jet (Fender et al., 1997; Fender & Pooley, 1998; Eikenberry et al., 1998a; Mirabel et al., 1998; Ueda et al., 2002). We propose that the flares in Figure 2 have the same origin.
This interpretation is supported by 15 GHz observations at the Ryle Telescope which were obtained several hours before our July 28 observations (G. Pooley 2002, private communication). Radio flares with similar timescales as the infrared flares and amplitudes of 10–20 mJy (above a baseline flux density of mJy) were observed. If the infrared flares we observed had similar radio counterparts, then the relatively flat infrared-to-radio spectrum (as well as the 109 to 1010 K brightness temperatures of the radio flares) indicates a nonthermal origin.
4. Infrared/X-Ray Correlation
The most interesting result from these observations may be the strong correlation between the duration of each infrared flare and the duration of its accompanying X-ray oscillation period. All the flares have similar rise times ( 200–300 seconds), but each flare appears to “wait” to return to its quiescent level until the X-rays stop oscillating. This gives rise to asymmetric profiles for some of the longer flares, particularly those on July 27.
How does this behavior compare to that seen in previous observations of GRS 1915+105? The flares observed in August 1997 by Eikenberry et al. (1998a) were a few times stronger than those presented here, with peak amplitudes as high as mJy dereddened. A correlation between the infrared flare duration and the X-ray oscillation period was not directly evident in 1997, and a few flares appear to have decayed almost completely while the X-rays were still undergoing strong oscillations. An example of this behavior is shown in Figure 3a.
However, there is some evidence for a smaller contribution to the infrared light curve (on the mJy level) associated with the 1997 X-ray oscillations. In particular, a long series of oscillations occurred on August 15 at the same time as a period of “infrared excess” following a flare, in which the GRS 1915+105 flux density remained steady at a level above its quiescent value (see Figure 3b). Eikenberry et al. (2000) showed that if each X-ray oscillation in this series had a 5–10 mJy infrared flare associated with it, then the superposition of these flares could reproduce the observed infrared excess. Their conclusion was based on the spectral similarity of the 1997 oscillations to isolated X-ray oscillations in July 1998, each of which had an accompanying, time-resolved 5–10 mJy infrared flare (the “class C” flares).

The observations presented in our current work strengthen the argument made by Eikenberry et al. (2000). The key piece of evidence comes from the third infrared flare on July 27 (Figure 2a). This flare contains clear evidence for a “subflare” — a secondary peak that occurs after the flare has begun to decay. Furthermore, the subflare is associated with an isolated oscillation in the X-ray light curve that occurs after an unusually long delay between it and the previous set of oscillations. It is therefore plausible that each X-ray oscillation has a faint infrared subflare associated with it, but in general the oscillations are so closely spaced in time that the subflares blend together to create the illusion of one continuous flare.111Note that there are a few other infrared flares in Figure 2 that appear to have very faint subflares, but none of these events have good enough X-ray coverage to determine whether they are associated with isolated X-ray oscillations.
Unlike in the 1997 data, where these faint flares simply contribute an “infrared excess” on top of a larger episode of flaring behavior, we propose that the minute flares in 2002 are composed entirely of these superimposed events. This would immediately explain the correlation between the infrared flare duration and the X-ray oscillation period seen in 2002; the flare is only sustained by the continual production of subflares associated with the X-ray oscillations.
To test whether this idea is feasible, we show in Figure 4 the number of X-ray oscillations in each minute cycle plotted against the integrated flux density of the infrared flare accompanying that cycle. (The integrated flux densities were calculated by smoothing the light curve to 30 second resolution, determining the start and end times of each flare by eye, subtracting out the baseline and integrating the result numerically.) It is clear from Figure 4 that X-ray cycles with more oscillations produce more infrared emission, consistent with our suggestion. Figure 4 also shows linear fits to the data; the best fit line has a slope of Jy sec oscillation-1 and a vertical intercept of Jy sec, while the best fit line constrained to pass through the origin has a slope of Jy sec oscillation-1. Both lines appear to be reasonable fits, and if we assume a plausible value of Jy sec for our measurement errors in determining the integrated flux densities, then both fits are found to be statistically acceptable, with reduced chi-squared values of and 1.1, respectively.

We also tried fitting a power law to the data in Figure 4 and found a slightly nonlinear relationship (power law index ), but the quality of the fit was not significantly better than that of the linear fit ( ). Therefore, the simplest conclusion we can draw from our observations is that there is a roughly linear relationship between the number of X-ray oscillations in each minute cycle and the strength of the infrared flare accompanying that cycle. In addition, we tested whether the infrared flare strength might actually be related to the total amount of X-ray emission during the oscillations (rather than the number of oscillations) and found no evidence to support this; if the infrared flare strength is plotted against the integrated X-ray flux in each cycle (above a baseline level of 1800 counts/sec/PCU), the correlation has a larger scatter than that shown in Figure 4, and both linear and power law fits to the data are poor ().
The simplest interpretation of the linear relationship in Figure 4 is that each X-ray oscillation contributes a constant amount of infrared emission to the overall light curve, in the form of a faint flare. In addition, the fact that the vertical intercept of our fit is small (equivalent to an infrared excess of only a few mJy over the typical duration of a flare) and possibly consistent with zero supports our suggestion that the infrared events are composed entirely of these superimposed faint flares. Furthermore, the slope that we measure from our fit indicates that each X-ray oscillation should be responsible for Jy sec of infrared emission. This number is slightly larger than, but still consistent with, the integrated flux density in the subflare we observed (between 0.5 and 2 Jy sec, depending on how we choose to distinguish the “subflare” from the underlying main flare). It may also be reasonable to assume that an average X-ray oscillation triggers a slightly larger subflare than the one we observed, since this subflare was associated with one of the weakest oscillations in its series.
To further test our idea, we attempted to simulate the infrared light curve as a superposition of faint subflares. We began our simulation with a constant infrared background level of mJy and added one faint flare to this background for each oscillation in the X-ray data. We modeled each flare as a Gaussian with fixed amplitude and full width at half maximum (FWHM). Based on the observed properties of the July 27 subflare, we chose the position of each Gaussian so that its peak occurred 60 seconds after the peak of its accompanying X-ray oscillation. We performed several simulations with different, fixed values of the amplitude and FWHM, since these quantities were hard to determine from the observed subflare.
In general, these simulations did not fit the data well; the superimposed flares we produced reached peaks which were initially too high or dropped to values which were too low by the end of the minute cycle. We therefore decided to allow the FWHM of the flares to vary based on the duration of each X-ray oscillation. We chose a simple linear scaling, in which the FWHM of each flare was taken to be proportional to the rise time of its accompanying X-ray oscillation. Results of this simulation for the sixth infrared flare on July 27 are shown in Figure 5; in this case, we fixed the amplitude of each Gaussian to be 8 mJy and set each Gaussian’s FWHM to be a factor of 5 greater than the rise time of its accompanying X-ray oscillation. This choice guaranteed that a typical oscillation in each X-ray series, with a rise time of seconds, had an associated infrared flare with a FWHM of 250 seconds and an integrated flux density of Jy sec, consistent with the slope of the fit in Figure 4.222Note that by allowing the FWHM to vary, we are also varying the amount of infrared emission associated with each X-ray oscillation. However, this does not contradict the linear relationship found in Figure 4; it turns out that each X-ray cycle has about an equal number of oscillations with rise times above and below the typical value of seconds, so the stronger infrared flares may “cancel out” the weaker ones and still lead to a roughly linear relationship.
Simulations such as the one in Figure 5 do a good job of reproducing the observations, especially given the gross approximations we are making. Even so, some difficulties are encountered. The July 27 subflare is not reproduced using the above procedure; its accompanying X-ray oscillation has an extremely long rise time, and therefore the simulation tries to model it with an unrealistically large FWHM. In general, the simulations work better at the beginning of each minute cycle than at the end, suggesting that there is residual infrared emission associated with the end of each X-ray cycle that is not captured in our model. Nonetheless, the results shown in Figure 5 are fairly typical, and we can be confident that the 2002 flares consist primarily of superimposed faint flares associated with each X-ray oscillation.
5. X-Ray Spectral Evolution
We can compare our X-ray light curves and spectra to those obtained in August 1997 by Eikenberry et al. (1998a). Though both sets of observations show transitions between X-ray dips and oscillations, the details of the behavior are different; in the classification of Belloni et al. (2000), GRS 1915+105 was in the “class ” state in 1997 and the “class ” state in 2002.
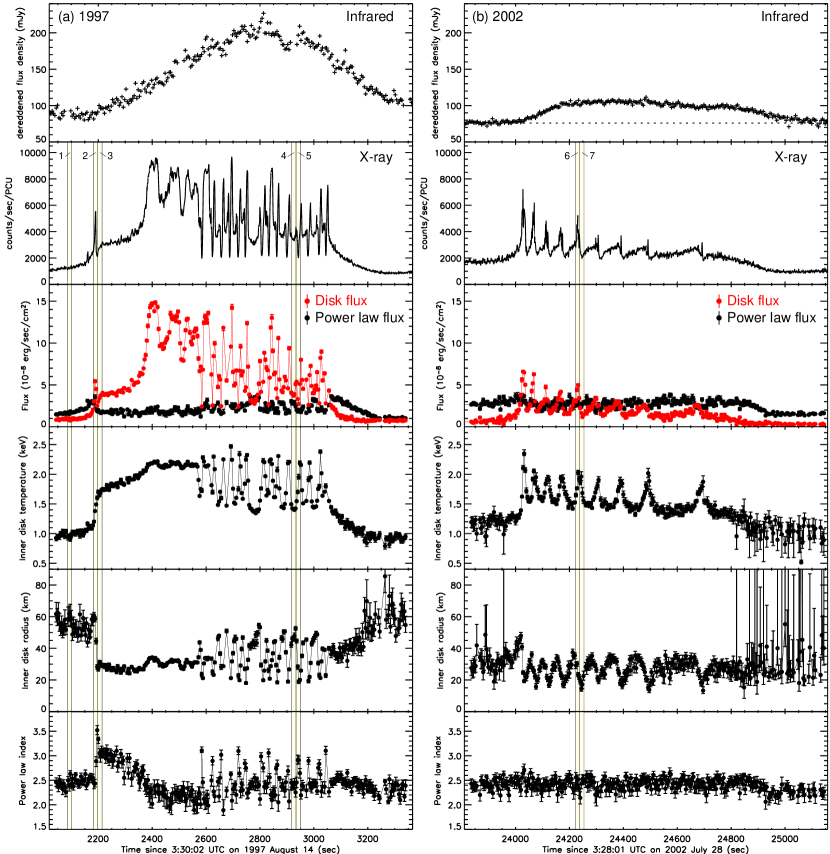
In Figure 6, we present one cycle of jet formation from each of the 1997 and 2002 observations. Several parameters obtained from our spectral fitting are plotted at 4-second resolution: the unabsorbed 2–25 keV flux from the multitemperature disk blackbody and power law components of the spectrum, the temperature at the inner edge of the accretion disk , the radius of the inner edge , and the power law index (where the flux density due to the power law, at photon energy , is ). The fits shown in Figure 6 have typical reduced chi-squared values of , and all fits with , as well as those for which XSPEC was unable to return uncertainties on the fit parameters, were excluded from the plot. Note that is calculated from the disk blackbody normalization (, where is the normalization) assuming a distance to GRS 1915+105 of 11 kpc and an accretion disk inclined to the line of sight (Fender et al., 1999a), but the values derived from this procedure should not be viewed as accurate estimates of the physical size of the disk (see §5.2.2 and Merloni, Fabian & Ross, 2000).
5.1. 1997 and 2002 State Changes
Figure 6 shows that in both 1997 and 2002, the X-ray spike which appears near the beginning of the infrared flare (at seconds in 1997 and seconds in 2002) represents a “state change” within the accretion disk, in the sense that it initiates changes that persist after the spike is finished. During the X-ray dip, the source is in a spectrally hard state in which the disk blackbody component is nearly absent, but the increase in and in the disk emission which occur at the spike indicate that the disk becomes hot and visible at this point and remains that way throughout the X-ray oscillations.
In 1997, there is a prolonged period of a few hundred seconds after the X-ray spike when the inner accretion disk has “turned on” but before the period of fast oscillations. It is clear that the infrared flare begins well before the oscillations, so although we may be able to ascribe some of the infrared emission to blended together “subflares” associated with each oscillation (as discussed in §4), there must be some other mechanism at work which leads to the initial rise of the infrared light curve right around the moment of the spike and allows it to reach a peak amplitude of mJy.
In 2002, however, the spike seems to represent the first oscillation in a series; it is spectrally similar to the oscillations which immediately follow it, and differs mainly in that it is the strongest and fastest oscillation in the group. This is consistent with the idea that the flares observed in 2002 consist entirely of superimposed 5–10 mJy subflares associated with each oscillation, and that no abnormally large ejection occurs at the moment of the first spike.
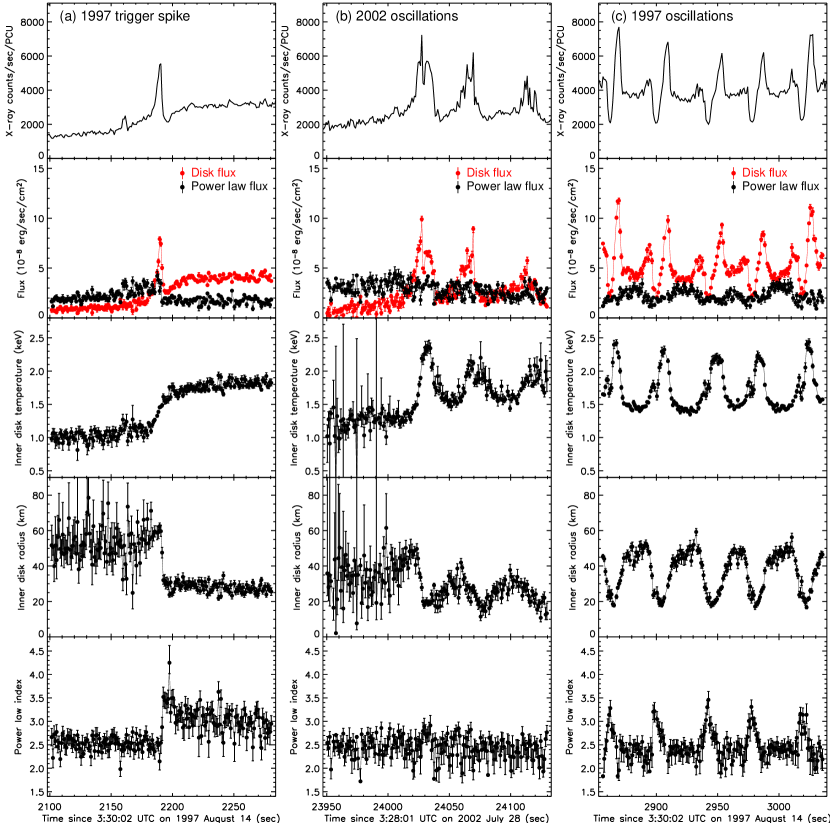
The differences between the 1997 and 2002 behavior can be more clearly seen in Figure 7, where we have plotted the results of X-ray spectral fitting performed at high time resolution (1 second). Again, all fits with , as well as those for which XSPEC was unable to return uncertainties on the fit parameters, were excluded from the plot. Figure 7a shows the initial X-ray spike in 1997, Figure 7b shows the initial X-ray spike in 2002 and the oscillations which immediately follow it, and Figure 7c shows a typical set of oscillations in 1997.
It is clear from Figure 7 that although the details of the 1997 and 2002 oscillations are different, there are also many similarities: both consist primarily of periodic changes in the disk emission and . The initial oscillation in 2002, which signals the beginning of the disk activity and coincides with the rise of the infrared flare, is no different in this regard. Figure 7a, however, shows that the initial spike in 1997 (which we refer to as the “trigger” spike) is an entirely different phenomenon. During this spike, rises monotonically to keV, where it remains, while the power law component of the spectrum does not vary noticeably during the spike but changes sharply as the spike ends. Similar behavior was observed by Migliari & Belloni (2003), but our spectral fits are performed at higher time resolution and therefore confirm that the power law does not change significantly even during the last few seconds of the spike’s rise.
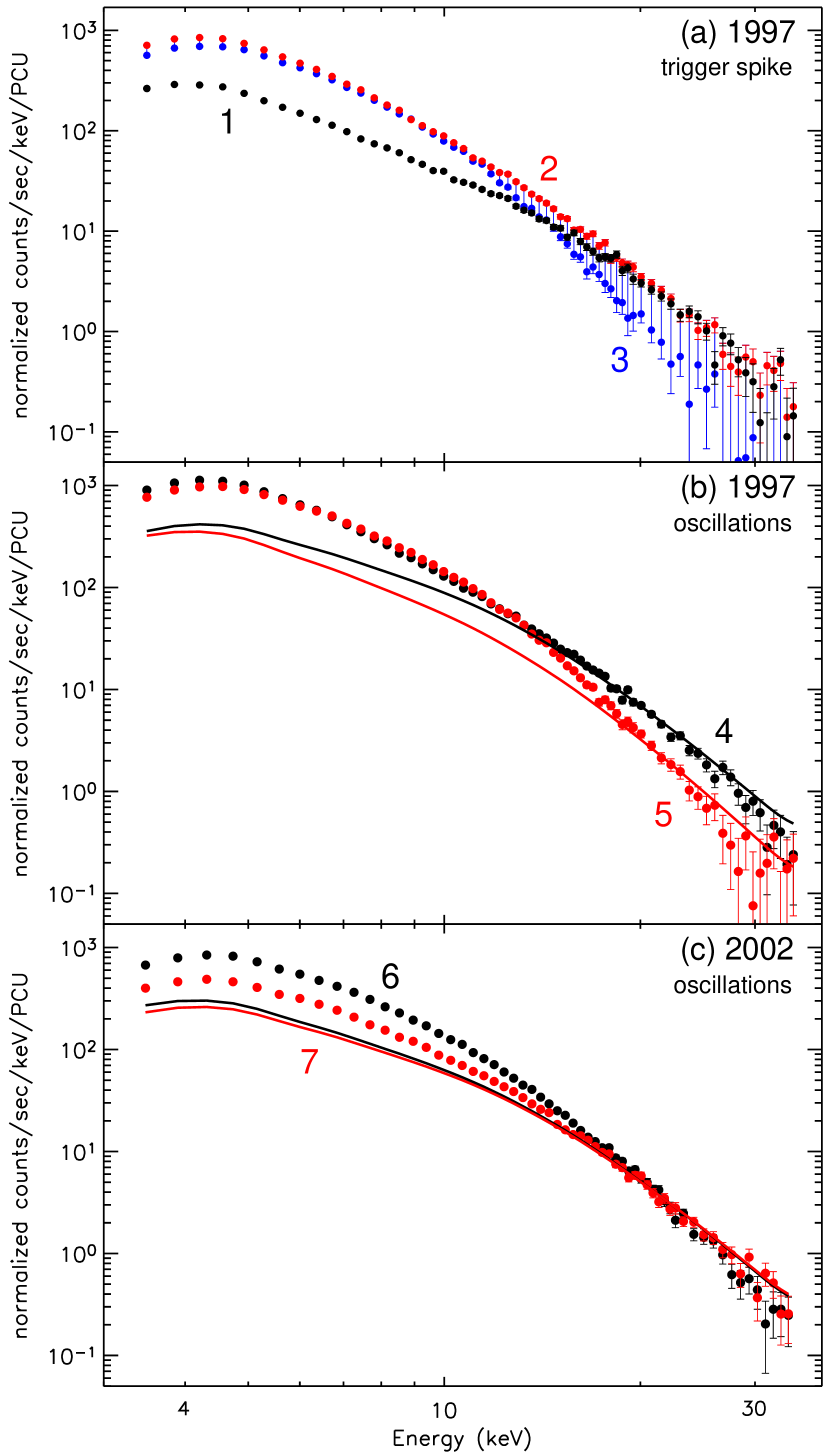
5.2. 1997 Trigger Spike
Given the importance of the 1997 trigger spike and its possible connection to large ejections in GRS 1915+105, it is useful to examine its evolution in a model-independent way. This is shown in Figure 8a, where we plot three X-ray spectra associated with the trigger spike (the parts of the X-ray light curve from which these spectra have been extracted are indicated by the vertical shaded regions numbered 1 through 3 in Figure 6a). We extracted the spectra at a time resolution of 16 seconds using PCA Standard-2 data, which have higher energy resolution than the Binned and Event mode data used for the fitting procedure.
As can be seen from Figure 8a, between regions 1 and 2 (as the spike begins) there is virtually no change in the hard ( keV) X-ray emission, but the soft X-rays brighten dramatically. After the drop at the end of the spike, however (region 3), the spectrum steepens sharply, and the hard X-rays become nearly undetectable. The soft X-rays in region 3 retain a similar spectral shape as in region 2, but decrease in intensity.
In this model-independent description, the trigger spike consists of:
-
1.
A factor of a few increase in the soft X-ray emission on a timescale of seconds or longer.
-
2.
A dramatic, factor of a few decrease in the hard X-ray emission and less dramatic decrease in the soft X-ray emission, on a timescale of a few seconds.
How do these changes in the soft and hard X-ray emission during the trigger spike relate to each other physically? There are several possible ways to understand this, depending on how much we believe the accuracy of the multitemperature disk blackbody model that we have employed above.
5.2.1 Nonthermal Models for the Spike
Although our spectral fitting indicates that the soft X-ray excess during the trigger spike consists of thermal emission from the accretion disk, this is not an ironclad conclusion. The energy resolution of our data is quite poor, and it is possible that other models could reproduce this brief burst of soft X-ray emission. Before the spike, the accretion disk component of the spectrum is extremely weak, and in fact, we are able to obtain acceptable fits at 1-second resolution ( ) for a model that only includes a power law and no accretion disk. Thus, it is possible to conclude that the spike is simply a “blip” on an otherwise smooth rise of the disk flux that corresponds (along with the smooth rise in ) to the accretion disk “turning on.” In this picture, when the 1997 X-ray light curve transitions from a dip into a period of oscillations, the thermal emission from the disk gradually becomes visible (as it does in 2002). At some point during this transition, however, a second nonthermal burst of soft X-rays is released, creating the spike. This interpretation certainly seems plausible in light of the second panel of Figure 7a, which shows the disk flux rising smoothly before the spike and finishing its smooth rise afterwards; the spike can easily be imagined as a sharp feature superimposed on an otherwise smooth event.
If this is the case, then when the nonthermal soft X-ray emission disappears at the end of the spike, the nonthermal hard X-ray emission (from the power law component of the spectrum) is also observed to drop (Figure 8a). The origin of the power law in X-ray binaries is a subject of some debate; it is generally assumed to represent either inverse Compton emission from a corona of relativistic electrons (Poutanen, 1998) which may constitute the base of a jet (Fender et al., 1999b), or the high frequency tail of synchrotron emission from the jet itself (Markoff, Falcke & Fender, 2001; Markoff et al., 2003). In either case, it comes from a region close to the accretion disk, so the decrease in the power law emission at the end of the spike indicates that changes are occurring immediately outside of the accretion disk at this time. Meanwhile, the infrared flare also begins, as energy is dissipated in the jet further downstream from the disk.
To test the nonthermal scenario, we tried fitting the soft X-ray emission during the spike as a power law (that is, we fit two power laws to the spectrum, the original one which extended to the hard X-rays, and a stronger, steeper one which covered the soft X-ray excess) but were not able to obtain acceptable fits at 1-second resolution. This implies the need for a “curved” spectral component to explain the emission during the spike; however, there are many possible sources for such a component besides thermal emission from the disk.
The above suggestions are tentative, and much more data would be required to confirm them. Nevertheless, a logical picture can be constructed in which the spike does not originate from thermal emission in the accretion disk. This picture would be consistent with several recent models, including the “magnetic bomb” (Eikenberry & van Putten, 2003) and “magnetic flood” (Tagger et al., 2004) models for GRS 1915+105 and the more general model proposed by Livio, Pringle & King (2003). These models all evoke the existence of large scale magnetic fields during the X-ray dip and associate the state transition at the end of the dip with the destruction of these magnetic fields, perhaps through a reconnection event that produces a second burst of nonthermal emission along with an ejection of material.
It is worth pointing out that our 2002 observations strengthen some of the above models, since they show that the large ejections ( mJy infrared flares which decouple from the X-ray light curve) only seem to occur in the presence of the trigger spike. However, they also show that the minute state transitions can occur without an initial large infrared event. Why is this the case? If the spike and ejection represent the destruction of the magnetic field which triggers the state transition, then why do state transitions sometimes seem to require a trigger spike and ejection seconds before the fast oscillations, but other times occur without them and jump immediately into the oscillations? Ideally, a model for the GRS 1915+105 behavior should answer these questions.
5.2.2 Thermal Accretion Disk Models for the Spike
If we instead elect to believe that the soft X-ray excess during the trigger spike is due to thermal emission from the accretion disk, we need to explain how the disk interacts with the corona or jet (which is responsible for the power law component of the spectrum) in order to produce the observed emission.
Yadav (2001) suggested a general picture for the spike in which the soft X-ray luminosity increases until it reaches a critical value, thus triggering the ejection and subsequent changes in the light curve and spectrum. In this picture, all of the “action” takes place at the end of the spike; at this time, the X-ray power law and infrared light curve change in a way that is consistent with jet ejection (just as they did in the nonthermal spike scenario of §5.2.1), but this change is now accompanied by a sharp drop in the accretion disk luminosity. This scenario has some advantages for observations in which the trigger spike does not have a well-defined beginning but rather seems to rise gradually to its maximum throughout the preceding X-ray dip (see, for example, the observation presented in Migliari & Belloni, 2003).
What could cause the accretion disk luminosity to decrease at the end of the spike, at the same time as the power law component changes? One possibility is that the drop in disk luminosity indicates a sharp increase in the fraction of the accretion power which is being dissipated in the GRS 1915+105 jet. Although detailed modeling of the disk spectrum would be required to confirm this suggestion, it is consistent with the changes observed in the disk parameters at the end of the spike (as discussed below), and it is also consistent with the observed changes in the X-ray power law and infrared light curve, which show that material may be ejected into the jet at the end of the spike.
To study in detail the changes in the disk parameters at the end of the spike, it is useful to examine Figure 7a. As can be seen from this figure, it is only the flux of radiation coming from the accretion disk which changes dramatically at the end of the spike, not the basic shape of the disk spectrum; the end of the spike occurs because of a sharp drop in over a few seconds, while increases over a slower timescale ( seconds) throughout the spike.
This behavior is puzzling. In general, changes in the disk parameters occur on similar timescales, in which case an increase in coupled with a decrease in can be understood by a model in which the physical conditions in the outer part of the disk remain similar but the inner part of the disk has “turned on,” either by refilling with matter or by beginning to emit detectable radiation (Belloni et al., 1997a, b). This scenario has been successfully simulated by Watarai & Mineshige (2003); the decrease in is due to the fact that at high accretion rates where the “slim disk” model of Abramowicz et al., 1988 applies, significant thermal radiation can emerge from inside the last stable circular orbit around the black hole (Watarai et al., 2000). However, the fact that in our observations the drop in occurs rapidly at the end of the spike, without any corresponding rapid changes in , is more difficult to understand, and it is therefore necessary to look for other interpretations for what is happening to the radiation from the accretion disk at the end of the spike.
Rodriguez et al. (2002) point out that when the normalization of the multitemperature disk blackbody is observed to drop, the simplest interpretation is that the effective area of the emitting region of the disk has decreased; the calculation of from the normalization is model-dependent and not necessarily reliable. A drop in the fitted value of can therefore be interpreted as the appearance of a hot spot or spiral shock pattern in the disk (Rodriguez et al., 2002), or more generally as a situation where some representative portion of the disk stops emitting radiation which we receive in the soft X-ray band (see also Muno et al., 2001). In this vein, Merloni, Fabian & Ross (2000) showed that if a more realistic model of the disk flow is used to simulate the X-ray spectrum, then changes in several parameters, including the fraction of the accretion power dissipated in regions outside of the disk (for example, in a corona or jet), could lead to apparent changes of by a factor of when the multitemperature disk blackbody model is used to fit the spectrum.
It is therefore plausible that the end of the spike coincides with a transfer of accretion power from the disk (where it is dissipated thermally) to the jet (where it initiates changes in the X-ray power law and infrared flare). During the second break between the spike and the subsequent oscillations, the disk then settles into the standard “slim disk” state, where the oscillations can occur. However, as in §5.2.1, it is still not clear from this scenario what physical parameter triggers the sharp transition and jet ejection in our 1997 observations but not in 2002.
5.2.3 The Spike in the Context of Other X-ray Binaries
Fender, Belloni & Gallo (2004) have proposed a unified model for jet formation in X-ray binary systems. The model is “unified” in the sense that the trigger spike in GRS 1915+105 is shown to have counterparts in several other sources, where a radio flare is produced around the time of a peak in the X-ray light curve that occurs during the transition from a hard to soft spectral state. Fender, Belloni & Gallo (2004) proposed a physical model in which a steady jet exists during the spectrally hard X-ray state preceding the spike and the speed of the jet increases sharply as the X-ray spectrum becomes softer; the jet is then quenched completely once the softness reaches a critical value. Thus, synchrotron flares are produced via internal shocks in the preexisting jet around the time of the X-ray spike, when the jet velocity is increasing the fastest.
Our observations are relevant to this model in several ways. First, we have shown that the sharp X-ray trigger spike observed in 1997 is associated with the appearance of large infrared flares that do not occur in 2002, when the spike is absent. This would seem to be evidence in favor of the Fender, Belloni & Gallo (2004) model. On the other hand, a hard-to-soft state transition clearly occurs in 2002 as well, and the first oscillation in each 2002 cycle might therefore meet the definition of a trigger spike in this sense (see also §7.1). If so, the model would need to explain why the 1997 trigger spike is associated with a mJy infrared flare, while the 2002 spike is only associated with a 5–10 mJy flare that is rivaled, at least in the infrared, by the flares that immediately follow it.
There are several reasons why the strength of the flare might vary. As suggested by Vadawale et al. (2003), the flare strength may be related to the total amount of material in the path of the faster jet — that is, if more material was ejected during the spectrally hard X-ray dip that preceded the spike, the resulting flare might be stronger. However, our observations do not show any particular relationship between the duration of each X-ray dip and the strength of the subsequent infrared flare. Therefore, there is no evidence to suggest that this effect is responsible for the stronger flares in 1997 as compared to 2002.
Another mechanism for varying the strength of the flare in the Fender, Belloni & Gallo (2004) model is to change the speed of the jet. Fender & Belloni (2004) suggested that the proposed increase in jet speed as the X-ray spectrum softens may be due to the inner edge of the accretion disk moving closer to the black hole, where the escape velocity increases rapidly. If we take the results of our X-ray spectral fits in Figure 7 at face value, we can attempt to test this suggestion, by seeing whether there are significant differences in the evolution of between 1997 and 2002.
It can be seen from Figure 7 that although decreases during the spike, it does so by a similar order of magnitude in 1997 as in 2002, suggesting that there may not be any large differences in the jet velocity. On the other hand, the value of just before the spike appears to be slightly larger in 1997 than it is in 2002. Therefore, if the argument of Fender & Belloni (2004) is correct, the velocity of the steady jet is slower in 1997, leading to a greater velocity differential and stronger internal shock when the highly relativistic jet is released during the spike. In addition, the decrease in happens on a faster timescale in 1997 than in 2002, which could mean that the jet velocity increases faster, leading to an internal shock in 1997 which occurs closer to the disk and therefore in the peak infrared-emitting region of the jet.
However, this interpretation carries with it many caveats since, as we have pointed out in §5.2.2, the observed change in may not correspond to an actual change in the inner radius of the disk, and even if it does, it only corresponds to the radius of the thermally emitting part of the disk (i.e. the region that is optically thick), which is not necessarily the same as the region from which the jet is ejected. Furthermore, there is a considerable range of X-ray behavior in both the 1997 and 2002 observations, so any conclusions that apply to the data shown in Figure 7 do not necessarily apply as strongly to the “class ” and “class ” states as a whole.
Another way in which our observations are relevant to the Fender, Belloni & Gallo (2004) model concerns the infrared subflare and our suggestion that each X-ray oscillation in 2002 is associated with a similar amount of infrared emission (see §4). If these faint infrared flares are interpreted as emission from the jet, then the jet in GRS 1915+105 may be active during the time of the soft X-ray oscillations, in contrast to the suggestion of Fender, Belloni & Gallo (2004). On the other hand, we cannot conclusively prove that the subflares represent jet emission (see §6), and even if they do, it is not clear exactly where the “dividing line” between jet and non-jet states in the Fender, Belloni & Gallo (2004) model actually exists; it is possible that the low points of the 2002 X-ray oscillations (where keV) are spectrally hard enough to produce a steady jet.
In general, our observations do not contradict the Fender, Belloni & Gallo (2004) model at this stage of its development; they will, however, likely be important in testing a more quantitative model based on the ideas that Fender, Belloni & Gallo (2004) proposed. Furthermore, any successful model will need to explain what parameter triggers the sharp X-ray state transitions and infrared-bright ejections that are observed in 1997 but not in 2002.

5.3. 1997 and 2002 Oscillations
Perhaps the most interesting difference between the 1997 and 2002 X-ray spectra is in the evolution of the power law component. In 1997, the power law index undergoes much more dramatic changes than in 2002, especially during the period of oscillations (see Figures 6 and 7). If this difference is real, it would suggest that significant changes are occurring in the corona or jet during the 1997 oscillations that do not take place during 2002, which is somewhat puzzling since both sets of oscillations produce similar “class C” infrared flares (see §4).
We investigated the possibility that the observed variations in the power law index were artificial. For example, if the multitemperature disk blackbody model provided a poor fit to the soft X-ray data, this could force the fitting routine to alter the power law component in order to fix the problems with the disk model on the soft X-ray end. Since the power law contributes significantly to both the soft and hard X-rays, the model spectrum might then fit the hard X-rays poorly, which would not necessarily be noticed in our fitting routine because the hard X-rays only provide a small percentage of the total flux and contribute little to the chi-squared value of the fit. Therefore, it might be possible to obtain changes in the fitted power law index even if there were no changes in the actual flux of hard X-ray photons, which comprise the bulk of the power law shape.
To get a handle on whether or not this is occurring, we show plots of X-ray spectra from the 1997 and 2002 oscillations in Figure 8b and 8c. The parts of the X-ray light curve from which these spectra have been extracted are indicated by the vertical shaded regions numbered 4 through 7 in Figure 6. As before, we extracted the spectra at a time resolution of 16 seconds using PCA Standard-2 data, in order to obtain the highest possible energy resolution.
It is clear from Figure 8 that the spectrum at energies keV does not change significantly during the 2002 oscillations but does during 1997, where the hard X-ray flux appears to drop by a factor of a few as the light curve enters the low point of its oscillation (the low point of the oscillation is an example of an X-ray “soft dip” discussed in e.g. Eikenberry et al., 2000). Furthermore, the solid lines in Figure 8 show the power law fit to the data; at high energies, the fit does seem to match the spectrum relatively well. There is a tentative suggestion that the actual data is steeper than the fitted power law, but it appears to be a minor effect.
We attempted to investigate this issue further by performing power law fits to the hard X-ray data only, thereby circumventing any problems introduced by the multitemperature disk blackbody model. We found that the power law index did appear to systematically increase by a value of to 1 when this procedure was used, but we were unable to obtain high enough signal-to-noise to reliably investigate the variability properties. Therefore, while we can conclusively state that the high energy power law component changes much more dramatically in 1997 than 2002, our data showing that this change specifically occurs in the power law index are less robust.
Finally, although the power law is much more variable in 1997 than 2002, there does appear to be a small peak in the fitted power law index during the first oscillation in 2002 (Figure 7b). There is also tentative evidence for this behavior in the first oscillation of other X-ray cycles in our 2002 observations. These detections are very close to our signal-to-noise limit, and thus we cannot determine whether the power law component varies in all the 2002 oscillations but is in general too weak for us to detect (since the subsequent oscillations are not as strong as the first one), or whether the first X-ray oscillation is in fact physically distinct, and produces power law variations even though the others do not.
6. Origin of the “Class C” Subflares
It is interesting to speculate on the origin of the 5–10 mJy “class C” infrared flares which seem so ubiquitous in GRS 1915+105.
Eikenberry et al. (2000) showed that when these flares were observed in July 1998, each flare preceded its associated X-ray oscillation by 200–600 seconds, including examples in which the infrared light curve peaked and started to decay before the X-ray disruption began. To see if this property applies to the events we observed in 2002, we show in Figure 9 a closer view of the isolated “subflare” from our first night of observations. The X-ray oscillation associated with this subflare consists of a smooth rise in the accretion disk flux, followed by a sharp spike. As can be seen from Figure 9, the subflare peaks after the X-ray spike, but its initial rise does seem to begin seconds before the spike. This evidence is tenuous, but it is another hint that the 5–10 mJy flares in GRS 1915+105 might all have a similar cause.
Note that the X-ray event shown in Figure 9 is in no way unusual except for the long delay between it and the previous oscillations; a similar spike is seen at the end of most, if not all, of the 2002 oscillations (for example, see the last event in Figure 7b). Similar oscillations have been discussed by Taam, Chen & Swank (1997), where the spike is referred to as a “secondary burst.” Spectral fitting of these spikes is inconclusive but indicates that they may consist of a momentary increase in the flux from the accretion disk and power law components of the spectrum, which makes them different from any other part of the 1997 or 2002 oscillations. Note that the “class C” infrared flares originally defined by Eikenberry et al. (2000) were associated with “soft dips” in the X-ray light curve that occur in the 1997 oscillations (see §5.3), but for the purposes of this paper, we will refer to any infrared subflare that occurs during the minute events and is associated with an individual oscillation as a “class C” flare.
We cannot directly rule out a thermal origin for the 2002 subflare (since it is an isolated event with no radio coverage), but the near-simultaneous presence of radio flares during our observations (see §3.2), combined with the idea that all of the infrared flaring behavior in 2002 was due to superimposed smaller events (see §4), strongly suggests that each small infrared flare has a radio counterpart, and therefore a nonthermal origin (see, however, §7.3). In addition, Eikenberry et al. (2000) argued that the July 1998 “class C” infrared flares were probably related to synchrotron jet emission, based on observations by Feroci et al. (1999) of a delayed, mJy radio counterpart to an X-ray oscillation spectrally similar to the July 1998 oscillations (again, however, we point out that the 2002 oscillations do not share this similarity).
It is clear that the “class C” flares are a complex phenomenon, with a variety of X-ray counterparts. There is also further fast variability within the “class B” events that has not been discussed here: large (up to mJy) subflares in some of the 1997 data that unfortunately have no X-ray coverage, and smaller ( 10–20 mJy) flares that do not occur during the X-ray oscillations but rather during the initial rise of the infrared light curve, right after the trigger spike (Rothstein & Eikenberry, 2003). If we accept a synchrotron jet origin for all the flares in GRS 1915+105, then the observations discussed here show that the accretion disk can interact with the jet under a wide variety of timescales and circumstances.
What is the nature of this interaction? The fact that at least some of the flares precede their associated X-ray oscillation argues for an “outside-in” origin for these events, in which the flare occurs somewhere outside of the inner accretion disk and eventually propagates inward to cause a disturbance in the X-rays emitted there (Eikenberry et al., 2000). Simulations of magnetized accretion disks by Lovelace, Romanova & Newman (1994) have shown that an increase in the poloidal magnetic field in the outer part of the disk can lead to an enhanced accretion rate, which triggers a slightly delayed burst of radiation from the inner disk. An alternate idea is that the flare could be produced by a reverse shock originating within a continuous jet outflow, which then propagates back down to the inner disk (Eikenberry et al., 2000).
The possibility that shocks within a preexisting jet could be responsible for the infrared flares from GRS 1915+105 is intriguing in light of the variability that we find within each flare. A model for internal shocks in microquasar jets was presented by Kaiser, Sunyaev & Spruit (2000). It was primarily used to explain the larger “class A” events, but a modified version might be applicable to the minute “class B” events as well (see Türler et al., 2004), especially given that a continuous jet has been observed in GRS 1915+105 and is known to be associated with the minute cycles (Dhawan, Mirabel & Rodríguez, 2000). In addition, Collins, Kaiser & Cox (2003) showed that particularly large ( mJy) “class B” events observed by Fender & Pooley (2000) cannot be explained by a simple model in which the flare results from an increase in the injected particle density at the base of the jet.
7. Discussion
In this section, we outline our scenario for the minute variability cycles in GRS 1915+105, based on the observations presented in this paper. The key feature of this scenario is that although GRS 1915+105 always dissipates energy in the jet (via infrared and radio flares) when the accretion disk becomes active, this emission is at least partially due to a superposition of smaller events, one for each oscillation in the X-ray light curve. Some of the events in GRS 1915+105 that would previously have been described as “class B” flares (in the sense that there is one large ejection every minutes) may really just be a superposition of smaller “class C” flares, which blend together and mimic a larger event. Episodes in which a large ejection really does occur, leading the infrared flare to dissociate from the X-ray light curve as the ejected material becomes causally separated from the inner disk (Eikenberry et al., 1998a), seem to require a “trigger” spike in the X-ray light curve at the moment of the state transition, when GRS 1915+105 does not immediately begin the fast X-ray oscillations but rather enters a phase of duration seconds in which the accretion disk is hot and visible but changes on a much slower timescale.
7.1. A Continuum of Behavior
It is important to realize that the minute cycles in GRS 1915+105 do not neatly fall into discrete categories. From perusing the figures in this paper, one can easily imagine a continuum of behavior, from an extreme example in which the initial ejection completely dominates the infrared flare (Figure 3a), to examples where the initial ejection is weaker and the excess emission from blended together faint flares is easier to see (Figure 3b), to examples from our 2002 observations where most of the infrared emission is due to blended together faint flares but a small “peak” is still observed at the beginning of the event, perhaps indicating a slightly larger initial ejection (some of the flares in Figure 2a), to examples on the other extreme, where there is no peak at the beginning of the flare and the event is consistent with the initial ejection being exactly the same as the subsequent ones (Figure 6b).
In this vein, we point out that X-ray observations which contain a strong trigger spike (the “class ” state defined by Belloni et al., 2000) have been observed to be accompanied by infrared flares with a wide range of amplitudes. The events observed by Eikenberry et al. (1998a) clustered around mJy but ranged from to 200 mJy, while a single event observed by Mirabel et al. (1998) during this X-ray state only reached a peak amplitude of mJy. Meanwhile, the superimposed faint flares reported in this paper during the “class ” state in July 2002 peak relatively consistently at mJy, but even these less extreme events may have some variation in amplitude; a single “class ” event observed by Mirabel et al. (1998) was accompanied by a flare that only appeared to peak at mJy.
The X-ray behavior during the minute cycles may also represent a continuum, between cases where there is a clear X-ray trigger spike and cases where this distinction is not so clear. Although the initial X-ray oscillation in each 2002 series is very similar to the subsequent oscillations, it does share a few subtle characteristics with the 1997 trigger spike. For example, Figure 7b shows that the initial 2002 oscillation is “double-peaked,” and at the end of the first peak the accretion disk flux drops sharply while the inner disk temperature continues its gradual rise. This is qualitatively the same behavior that was observed during the 1997 trigger spike (see §5), and thus the first peak in this oscillation may be regarded as a weak analog of the trigger spike in 1997, albeit one which leads immediately to the X-ray oscillations rather than requiring a second phase in which the accretion disk is much less variable. Based on these properties, it is not surprising that the initial 2002 oscillation sometimes appears to be accompanied by a slightly larger infrared flare (Figure 2a, as discussed above) and slightly more variation in the power law index (see §5.3) than the oscillations which follow it; it may really be a weak variant of the 1997 spike which leads to the large ejections.
7.2. When Does the Ejection Occur?
The observations presented in this paper contradict some of the conclusions of Klein-Wolt et al. (2002), who analyzed simultaneous X-ray and radio observations of GRS 1915+105 and argued that the radio flares are produced via a continuous ejection of material during the long, spectrally hard dips in the X-ray light curve (“state C” in the classification of Belloni et al., 2000).
Independent of any of the specific conclusions we have reached in this paper, our observations pose a serious challenge for this argument. As is easily visible from Figure 2, the duration of each infrared flare in our July 2002 observations is correlated with the duration of its accompanying period of X-ray oscillations, not with the previous X-ray dip. This strongly suggests that the flares are associated with the X-ray oscillations, while providing no indication that they are influenced by any properties of the preceding dip, as might be expected in the model of Klein-Wolt et al. (2002), where a longer dip means that more material is being ejected into the jet.
The differences which we observe between the 1997 and 2002 infrared flares also argue against the model of Klein-Wolt et al. (2002). The X-ray dips in 1997 and 2002 are very similar to each other, and they are separated by X-ray oscillation cycles which have similar durations. The only real difference is that the 2002 dips appear to be slightly longer ( seconds as opposed to seconds) and to have disk blackbody emission that is weaker by a factor of (although it is important to note that the disk blackbody emission is so weak in both cases that it is barely detectable). It is not clear how these slight differences in the X-ray dips could lead to dramatic differences in the infrared flares under the Klein-Wolt et al. (2002) model. Therefore, the fact that there appears to have been a large ejection during each minute cycle in 1997 but not in 2002 argues for a scenario in which the flares are associated with properties of the X-ray state transition (such as the presence or absence of the trigger spike) and subsequent accretion disk oscillations, which do proceed much differently in 1997 than in 2002.
We do not dispute the conclusion of Klein-Wolt et al. (2002) that the presence of “state C” dips is required for infrared and radio flares to occur; for example, it is definitely possible that mass which is later available to be ejected steadily builds up during the dips (e.g. Belloni, Migliari & Fender, 2000). It is also possible that matter is being continuously ejected during the dips but that this material does not directly produced the large flares; instead, the flares could be produced via internal shocks which occur in the continuous jet when faster-moving material is ejected at the moment of the state transition Vadawale et al., 2003; see also Fender, Belloni & Gallo, 2004. The main conclusion of Klein-Wolt et al. (2002) which we refute is simply that the flares can be entirely explained by the evolution of particles which were ejected during the dip, without appealing to some other event that occurs afterwards in the accretion disk.
The above ideas were hinted at by previous multiwavelength observations containing infrared data (Eikenberry et al., 1998a; Mirabel et al., 1998; Eikenberry et al., 2000), but they are confirmed by our present work. Nonetheless, it will be important to test them with future radio observations. The observations analyzed by Klein-Wolt et al. (2002) did not contain any examples of the “class ” X-ray state for which there was significant overlap in the X-ray and radio coverage, and in general, there are only a few radio observations in the literature which overlap with the “class ” state.
7.3. Infrared and Radio Flares
One of the few previous multiwavelength observations during the “class ” state raises some questions about our current results. Ueda et al. (2002) obtained hours of X-ray and radio (and, separately, X-ray and infrared) observations during this state. They detected at least one radio flare that had a shorter duration than its accompanying X-ray oscillation period, with the main part of the flare decaying several hundred seconds before the end of the oscillations. This flare was most clearly seen at 1.3 cm (23 GHz), where it reached an amplitude of mJy (Figure 2 of Ueda et al., 2002).
In most models, radio flares are expected to peak later and last longer than their associated infrared flares, due to optical depth effects in the ejected material (van der Laan, 1966; Mirabel et al., 1998; Collins, Kaiser & Cox, 2003). Therefore, the radio flare observed by Ueda et al. (2002) does not appear to be the counterpart of the superimposed infrared flares we report in our current work, and, in fact, Ueda et al. (2002) used their observations to specifically rule out the possibility that the radio flares are produced via a superposition of smaller flares associated with each X-ray oscillation. In addition, the baseline flux density of the radio emission during these observations was mJy; thus, if there was any “radio excess” associated with the X-ray oscillations after the decay of the flare, it was limited to, at most, this value.
How can we understand these results? If the Ueda et al. (2002) observation is representative of the radio behavior during the “class ” state, then the initial ejections at the moment of the state transition may really be distinct, even though they do not appear that way in the infrared light curve. The initial ejection might have a relatively flat infrared-to-radio spectrum (and thus a prominent radio signature), while the repeating events associated with each X-ray oscillation could have little associated radio emission. If this is the case, then the differences between the “class ” and “class ” states are not really as strong as we have indicated in this paper; both might produce ejections at the moment of the state transition which are substantially different from the subsequent ones (although it still the case that the “class ” events produce, on average, much larger infrared and radio flares than the “class ” events).
Alternatively, it is possible that the Ueda et al. (2002) event was not representative of the normal behavior during the “class ” state. We have analyzed the X-ray light curve and spectrum from this event and found that there is a relatively sharp double peak in the first oscillation in this series, whose first peak has spectral and temporal characteristics particularly reminiscent of a “class ” trigger spike (see §7.1). In addition, there is an unusual, second spike in the X-ray light curve which occurs seconds before the state transition (although it is spectrally different from the trigger spike and appears to simply be a thermal “bump” in the spectrum). This behavior suggests that Ueda et al. (2002) may have observed an anomalous event, in which the initial ejection was much different than those which normally occur during the “class ” state.
Furthermore, the only other “class ” radio observation we could find in the literature appears to be consistent with the interpretation we have put forth in this paper. Figure 1 of Mirabel et al. (1998) shows that during the “class ” state, the flare duration increases with wavelength as expected, including one case in which the flare was simultaneously observed in the infrared and three different radio wavelengths. The X-ray oscillation period associated with this event was not observed, but it is constrained to have been within a short ( minute) gap in the X-ray coverage that overlaps with the infrared flare and is of significantly shorter duration than the radio flares. Thus, it is broadly consistent with our current observations.
The ultimate answer to the questions raised here may rest on how much variation there is in the amplitude of the “class C” flares associated with each X-ray oscillation. If the “radio excess” seen in the Ueda et al. (2002) observations ( mJy if it exists at all) is typical, then it is difficult to see how the repeating, larger radio flares during the “class ” state (see §3.2, as well as Mirabel et al., 1998), could be explained without resorting to initial ejections that are different from the subsequent events. Also note that the “class ” state in GRS 1915+105, which consists of an extremely long series of oscillations very similar to those seen during the “class ” state (Belloni et al., 2000), is associated with steady radio emission of only mJy at 15 GHz (Klein-Wolt et al., 2002).
To further complicate the picture, the infrared observations of Ueda et al. (2002) show at least one instance (and likely more) in which a delayed minute infrared flare is seen during the “class ” state, beginning at the end of its associated X-ray oscillation period rather than the beginning. (Note that as in our observations, the duration of this flare still matches the duration of the oscillations.) It is unclear what could have caused this unusual delay, which is inconsistent with all the infrared flares we report in this paper. Ueda et al. (2002) suggested the possibility of an internal shock occurring far out along the jet, but it is a puzzling event under any interpretation.
Clearly, the only way to resolve the issues raised here is to obtain simultaneous X-ray, infrared and radio observations over a long stretch of events. In the absence of such observations, we can only point out that the conclusions we have reached in this paper apply to all simultaneous episodes that we observed. Overall, it is clear that the 1997 “class ” events produce qualitatively different flaring behavior than the 2002 “class ” events and that these differences are related to the different ways in which the state transition proceeds and in particular to the X-ray trigger spike, which appears most strongly in the “class ” observations. However, the exact manner in which properties of the trigger spike control the behavior of the initial flare — for example, whether the “sharpness” of the spike or the delay between it and the subsequent oscillations is the most important feature — cannot yet be conclusively determined.
8. Conclusions
We have presented simultaneous infrared and X-ray observations of the microquasar GRS 1915+105 (at 1-second time resolution) during a period of jet ejection in July 2002. By comparing these observations to those obtained in August 1997 by Eikenberry et al. (1998a), we arrive at a picture in which a large ejection may not always be present during the minute state transitions in GRS 1915+105. The observed infrared flares may sometimes entirely be a superposition of smaller, more complex phenomena, with large, infrared-bright ejections superimposed on them only when there is a “trigger” spike in the X-ray light curve. In particular, we find that:
-
1.
The duration of each infrared flare in 2002 matches the duration of its accompanying X-ray oscillation period.
-
2.
There is one instance in which a single, isolated X-ray oscillation occurs in the light curve, accompanied by a faint infrared “subflare” superimposed on one of the main flares.
-
3.
These observations are consistent with a scenario in which each X-ray oscillation has an associated faint infrared flare and these flares blend together to form, and entirely comprise, the larger events.
-
4.
The main difference between our X-ray observations and the August 1997 observations is the presence of a sharp “trigger” spike in the 1997 X-ray light curve during each minute cycle, which occurs seconds before the accretion disk oscillations and signals a sharp change in the spectral properties of the source.
-
5.
The trigger spike appears to be associated with initial, large infrared flares, which are observed in 1997 but not in 2002.
-
6.
The 1997 X-ray oscillations contain dramatic changes in the high energy power law component of the X-ray spectrum, which are not observed during the 2002 oscillations. This is somewhat puzzling, since both sets of oscillations produce similar infrared subflares.
-
7.
There is tentative evidence that the infrared subflare observed in 2002 leads its associated X-ray oscillation by seconds, possibly suggesting an “outside-in” origin for these events, as in observations by Eikenberry et al. (2000).
-
8.
It is unlikely that any of the 2002 flares can be explained solely by the continuous ejection of material during the spectrally hard X-ray “dip” which precedes each set of X-ray oscillations, as suggested by Klein-Wolt et al. (2002).
Although many authors have speculated on the importance of the trigger spike as a signature of large jet ejections (e.g. Eikenberry et al., 1998a; Mirabel et al., 1998; Yadav, 2001; Fender, Belloni & Gallo, 2004), the observations presented in this paper confirm it. Our 2002 X-ray observations, which have many similarities to the Eikenberry et al. (1998a) observations except for the absence of a distinctive trigger spike, do not show the same large flares in the infrared. Thus, these data are important in allowing us to pinpoint which aspects of the X-ray behavior are related to which types of events in the jet.
Overall, we find that jet production in GRS 1915+105 is a complex, unsteady phenomenon, down to the fastest timescales that have been observed. The jet and the accretion disk appear to interact on a regular basis, perhaps every time an oscillation occurs within the inner portion of the disk. These details need to be taken into account in accretion disk models, such as in the simulations of radiation pressure dominated disk evolution by Janiuk, Czerny & Siemiginowska (2002), which found that energy dissipation in a corona or via an outflow from the disk may be important in reproducing the GRS 1915+105 X-ray emission.
References
- Abramowicz et al. (1988) Abramowicz, M. A., Czerny, B., Lasota, J. P., & Szuszkiewicz, E. 1988, ApJ, 332, 646
- Belloni et al. (1997a) Belloni, T., Méndez, M., King, A. R., van der Klis, M., & van Paradijs, J. 1997a, ApJ, 479, L145
- Belloni et al. (1997b) Belloni, T., Méndez, M., King, A. R., van der Klis, M., & van Paradijs, J. 1997b, ApJ, 488, L109
- Belloni et al. (2000) Belloni, T., Klein-Wolt, M., Méndez, M., van der Klis, M., & van Paradijs, J. 2000, A&A, 355, 271
- Belloni, Migliari & Fender (2000) Belloni, T., Migliari, S., & Fender, R. P. 2000, A&A, 358, L29
- Castro-Tirado et al. (1994) Castro-Tirado, A. J., Brandt, S., Lund, N., Lapshov, I., Sunyaev, R. A., Shlyapnikov, A. A., Guziy, S., & Pavlenko, E. P. 1994, ApJS, 92, 469
- Chapuis & Corbel (2004) Chapuis, C., & Corbel, S. 2004, A&A, 414, 659
- Collins, Kaiser & Cox (2003) Collins, R. S., Kaiser, C. R., & Cox, S. J. 2003, MNRAS, 338, 331
- Dhawan, Mirabel & Rodríguez (2000) Dhawan, V., Mirabel, I. F., & Rodríguez, L. F. 2000, ApJ, 543, 373
- Done, Wardziński & Gierliński (2004) Done, C., Wardziński, G., & Gierliński, M. 2004, MNRAS, 349, 393
- Eikenberry et al. (1998a) Eikenberry, S. S., Matthews, K., Morgan, E. H., Remillard, R. A., & Nelson, R. W. 1998a, ApJ, 494, L61
- Eikenberry et al. (1998b) Eikenberry, S. S., Matthews, K., Murphy, T. W., Jr., Nelson, R. W., Morgan, E. H., Remillard, R. A., & Muno, M. 1998b, ApJ, 506, L31
- Eikenberry et al. (2000) Eikenberry, S. S., Matthews, K., Muno, M., Blanco, P. R., Morgan, E. H., & Remillard, R. A. 2000, ApJ, 532, L33
- Eikenberry & van Putten (2003) Eikenberry, S. S., & van Putten, M. H. H. M. 2003, ApJ, submitted (astro-ph/0304386)
- Fender et al. (1997) Fender, R. P., Pooley, G. G., Brocksopp, C., & Newell, S. J. 1997, MNRAS, 290, L65
- Fender & Pooley (1998) Fender, R. P., & Pooley, G. G. 1998, MNRAS, 300, 573
- Fender et al. (1999a) Fender, R. P., Garrington, S. T., McKay, D. J., Muxlow, T. W. B., Pooley, G. G., Spencer, R. E., Stirling, A. M., & Waltman, E. B. 1999a, MNRAS, 304, 865
- Fender et al. (1999b) Fender, R., et al. 1999b, ApJ, 519, L165
- Fender & Pooley (2000) Fender, R. P., & Pooley, G. G. 2000, MNRAS, 318, L1
- Fender (2004) Fender, R. P. 2004, in Compact Stellar X-Ray Sources, ed. W. H. G. Lewin, & M. van der Klis (Cambridge: Cambridge University Press), in press (astro-ph/0303339)
- Fender & Belloni (2004) Fender, R., & Belloni, T. 2004, ARA&A, 42, 317
- Fender, Belloni & Gallo (2004) Fender, R. P., Belloni, T. M., & Gallo, E. 2004, MNRAS, 355, 1105
- Feroci et al. (1999) Feroci, M., Matt, G., Pooley, G., Costa, E., Tavani, M., & Belloni, T. 1999, A&A, 351, 985
- Fuchs, Mirabel & Claret (2003) Fuchs, Y., Mirabel, I. F., & Claret, A. 2003, A&A, 404, 1011
- Greiner, Morgan & Remillard (1996) Greiner, J., Morgan, E. H., & Remillard, R. A. 1996, ApJ, 473, L107
- Greiner, Cuby & McCaughrean (2001) Greiner, J., Cuby, J. G., & McCaughrean, M. J. 2001, Nature, 414, 522
- Greiner et al. (2001) Greiner, J., Cuby, J. G., McCaughrean, M. J., Castro-Tirado, A. J., & Mennickent, R. E. 2001, A&A, 373, L37
- Janiuk, Czerny & Siemiginowska (2002) Janiuk, A., Czerny, B., & Siemiginowska, A. 2002, ApJ, 576, 908
- Kaiser, Sunyaev & Spruit (2000) Kaiser, C. R., Sunyaev, R., & Spruit, H. C. 2000, A&A, 356, 975
- Klein-Wolt et al. (2002) Klein-Wolt, M., Fender, R. P., Pooley, G. G., Belloni, T., Migliari, S., Morgan, E. H., & van der Klis, M. 2002, MNRAS, 331, 745
- Livio, Pringle & King (2003) Livio, M., Pringle, J. E., & King, A. R. 2003, ApJ, 593, 184
- Lovelace, Romanova & Newman (1994) Lovelace, R. V. E., Romanova, M. M., & Newman, W. I. 1994, ApJ, 437, 136
- Markoff, Falcke & Fender (2001) Markoff, S., Falcke, H., & Fender, R. 2001, A&A, 372, L25
- Markoff et al. (2003) Markoff, S., Nowak, M., Corbel, S., Fender, R., & Falcke, H. 2003, A&A, 397, 645
- McClintock & Remillard (2004) McClintock, J. E., & Remillard, R. A. 2004, in Compact Stellar X-Ray Sources, ed. W. H. G. Lewin, & M. van der Klis (Cambridge: Cambridge University Press), in press (astro-ph/0306213)
- Merloni, Fabian & Ross (2000) Merloni, A., Fabian, A. C., & Ross, R. R. 2000, MNRAS, 313, 193
- Migliari & Belloni (2003) Migliari, S., & Belloni, T. 2003, A&A, 404, 283
- Mirabel & Rodríguez (1994) Mirabel, I. F., & Rodríguez, L. F. 1994, Nature, 371, 46
- Mirabel et al. (1994) Mirabel, I. F., et al. 1994, A&A, 282, L17
- Mirabel et al. (1998) Mirabel, I. F., Dhawan, V., Chaty, S., Rodríguez, L. F., Martí, J., Robinson, C. R., Swank, J., & Geballe, T. R. 1998, A&A, 330, L9
- Mirabel & Rodríguez (1999) Mirabel, I. F., & Rodríguez, L. F. 1999, ARA&A, 37, 409
- Mitsuda et al. (1984) Mitsuda, K., et al. 1984, PASJ, 36, 741
- Muno, Morgan & Remillard (1999) Muno, M. P., Morgan, E. H. & Remillard, R. A. 1999, ApJ, 527, 321
- Muno et al. (2001) Muno, M. P., Remillard, R. A., Morgan, E. H., Waltman, E. B., Dhawan, V., Hjellming, R. M., & Pooley, G. 2001, ApJ, 556, 515
- Persson et al. (1998) Persson, S. E., Murphy, D. C., Krzeminski, W., Roth, M., & Rieke, M. J. 1998, AJ, 116, 2475
- Pooley & Fender (1997) Pooley, G. G., & Fender, R. P. 1997, MNRAS, 292, 925
- Poutanen (1998) Poutanen, J. 1998, in Theory of Black Hole Accretion Disks, ed. M. A. Abramowicz, G. Björnsson, & J. E. Pringle (Cambridge: Cambridge University Press), 100
- Remillard et al. (2003) Remillard, R., Muno, M., McClintock, J., & Orosz, J. 2003, in Proceedings of the Fourth Microquasar Workshop, New Views on Microquasars, ed. P. Durouchoux, Y. Fuchs, & J. Rodriguez (Kolkata: Center for Space Physics), 57 (astro-ph/0208402)
- Rodriguez et al. (2002) Rodriguez, J., Varnière, P., Tagger, M., & Durouchoux, P. 2002, A&A, 387, 487
- Rodríguez & Mirabel (1999) Rodríguez, L. F., & Mirabel, I. F. 1999, ApJ, 511, 398
- Rothstein & Eikenberry (2003) Rothstein, D. M., & Eikenberry, S. S. 2003, in Proceedings of the Fourth Microquasar Workshop, New Views on Microquasars, ed. P. Durouchoux, Y. Fuchs, & J. Rodriguez (Kolkata: Center for Space Physics), 341 (astro-ph/0208068)
- Taam, Chen & Swank (1997) Taam, R. E., Chen, X., & Swank, J. H. 1997, ApJ, 485, L83
- Tagger et al. (2004) Tagger, M., Varnière, P., Rodriguez, J., & Pellat, R. 2004, ApJ, 607, 410
- Türler et al. (2004) Türler, M., Courvoisier, T. J.-L., Chaty, S., & Fuchs, Y. 2004, A&A, 415, L35
- Ueda et al. (2002) Ueda, Y., et al. 2002, ApJ, 571, 918
- Vadawale et al. (2003) Vadawale, S. V., Rao, A. R., Naik, S., Yadav, J. S., Ishwara-Chandra, C. H., Pramesh Rao, A., & Pooley, G. G. 2003, ApJ, 597, 1023
- van der Laan (1966) van der Laan, H. 1966, Nature, 211, 1131
- Watarai et al. (2000) Watarai, K., Fukue, J., Takeuchi, M., & Mineshige, S. 2000, PASJ, 52, 133
- Watarai & Mineshige (2003) Watarai, K., & Mineshige, S. 2003, ApJ, 596, 421
- Yadav (2001) Yadav, J. S. 2001, ApJ, 548, 876