The young active binary star EK~Draconis∗
EK Dra (HD 129333) is a young, active, nearby star that is orbited by a low mass companion. By combining new speckle observations with old and new radial velocity measurements we find that the orbit is highly eccentric with , and we derive the true masses of both components. The masses are and , for the primary and secondary, respectively. From high resolution spectra we derive a new of K and a of , which is different to previous estimates. However, the new spectroscopic distance differs by only 5.8% to the distance derived by parallax measurement by the Hipparcos satellite and thus the stellar parameters are presumably more realistic than older determinations. We derive a somewhat higher value for the metallicity of . EK Dra turns out to be one of the few nearby young stars that will evolve similarly to the Sun. The precise radial velocity measurements taken in the course of this program also allow us to shed more light on the activity of this star. In 2001 and 2002 we find radial velocity variation with a period of days which we interpret as the rotation period. This signal vanishes in 2003. However the signal can be recovered if only the spectra in which the photospheric lines are asymmetric are used. On the other hand, we do not find a close correlation between the asymmetry of photospheric lines and the radial velocity.
Key Words.:
Stars: individual: EK Dra, activity, fundamental parameters, binary: spectroscopic and visualPartly based on observations collected at the German-Spanish Astronomical Center, Calar Alto, operated jointly by the Max-Planck Institut für Astronomie and the Instituto de Astrofísica de Andalucía (CSIC), and partly based on observations taken with the 2-m-Alfred Jensch telescope of the Thüringer Landessternwarte Tautenburg.
1 Introduction
EK Dra (GJ 559.1A, HD 129333) is a star that has roughly the mass of the Sun. The Henry Draper Catalogue and Extension (Cannon & Pickering 1918- (1994)) and Simbad database list a spectral type of F8 for this star. The equivalent width of Li I is about 0.2 Å, and therefore it must be relatively young. Fröhlich et al. (froehlich02 (2002)) and references therein discuss the age and activity connection.
Various studies of EK~Dra at different wavelength regimes have been carried out including longterm photometric monitoring over decades. Dorren & Guinan (dorren94 (1994)) have observed strong variable chromospheric emission lines in their UV spectra. The star has the highest known Ca II H and K emission level of any known early G-type star which is not a close binary (Soderblom soderblom85 (1985)).
The star is rapidly rotating ( km/s) and has dominant spot features at that could also be the offshoot of a large polar spot. These spots are located at a higher latitude than typical spots on the Sun (Strassmeier & Rice strassmeier98 (1998)). Strassmeier & Rice (strassmeier98 (1998)) measure several rotation periods between days and days using different methods where for their purpose they adopt a longterm photometric period of 2.605 days. Coronal emission was also observed in X-rays and as well in the radio regime. The X-ray light curve is significantly variable, with the emission from the cooler plasma being strongly modulated by the rotation period, while the emission from the hotter plasma is only weakly variable (Guedel et al. guedel95 (1995)).
A 12 to 14 year cyclic variability was discovered by Dorren & Guinan (dorren94 (1994)) and Dorren et al. (dorren95 (1995)) using photometric and spectroscopic data. They observed that the Ca II H & K emission index increased during that time. A decline of brightness since 1994 was noted by Fröhlich el al. (froehlich02 (2002)). The star became fainter as its mean level of chromospheric activity rose. These findings can be interpreted as signs of a spot cycle.
EK Dra also is a long period binary star where the secondary is much fainter than the primary. Duquennoy & Mayor (duquennoy91 (1991)) used a period of 11.5 years in order to derive the first preliminary spectroscopic orbit. However, as will be discussed in the next section, the true period is years.
EK Dra is a well-studied young, active and nearby star. It thus serves as one of the best-studied young stars evolving similar to the Sun. Since it is a long period binary, it is possibly one of the few cases of young stars for which the true masses can be determined. The aim of this paper is to derive the true mass, and to calculate a new atmospheric model. These will then allow us to compare the properties of this object with evolutionary tracks. Additionally, we have obtained a large number of radial velocity measurements which will give us new insights into the stellar activity and the influence of stellar activity on precise radial velocity measurements.
2 Deriving the true masses of EK Dra A and EK Dra B
By combining the data from our speckle interferometry and RV data from the literature with our own RV measurements, it is for the first time possible to derive the true masses of EK Dra A and EK Dra B.
2.1 Speckle interferometry : observations
| No. | Date | Epoch | Position | Projected | Filter | Flux ratio | Instrument |
|---|---|---|---|---|---|---|---|
| angle [∘] | separation [mas] | ||||||
| 1 | 19.03.1991 | 1991.2135 | 173.9 4.3 | 282 12 | K | 1D | |
| 2 | 13.02.1992 | 1992.1232 | 171.7 3.9 | 313 13 | K | 1D | |
| 3 | 05.10.1993 | 1993.7611 | 173.7 0.9 | 456 14 | K | 0.066 0.003 | MAGIC |
| 4 | 26.01.1994 | 1994.0712 | 174.0 0.3 | 486 10 | K | 0.084 0.003 | MAGIC |
| 5 | 13.12.1994 | 1994.9501 | 175.5 0.4 | 501 5 | H | 0.087 0.003 | MAGIC |
| 6 | 22.11.1997 | 1997.8926 | 174.8 0.6 | 647 12 | K | 0.084 0.004 | MAGIC |
| 7 | 10.02.2001 | 2001.1123 | 172.8 0.6 | 679 5 | K | 0.111 0.006 | OMEGA Cass |
| 8 | 03.11.2001 | 2001.8406 | 174.0 1.0 | 709 10 | K | 0.081 0.008 | OMEGA Cass |
| 9 | 21.10.2002 | 2002.8049 | 171.9 1.0 | 725 8 | K | 0.081 0.010 | OMEGA Cass |

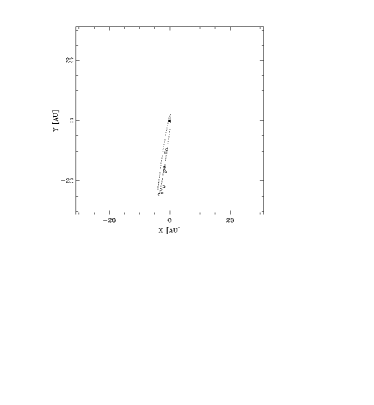
EK Dra was repeatedly observed with the 3.5 m-telescope on Calar Alto from 1991 to 2002 using speckle interferometry, mostly in the K band (). An overview of these observations is given in Table 1 and is displayed in Fig. 1. Observations 1 and 2 made use of a device for one-dimensional speckle interferometry. For these observations, the technique of data acquisition and reduction has been described by Leinert & Haas (leinert89 (1989)). All other data points were obtained using the near-infrared cameras MAGIC and OMEGA Cass that are capable of taking sequences of short exposures (typically 0.1 s), and thus allow speckle interferometry with two-dimensional detector arrays. Details of data reduction and analysis have been described by Köhler et al. (koehler00 (2000)). Briefly, short exposures (“frames”) are taken for EK Dra and the nearby point source (PSF calibrator) BS~5436. BS~5436 is an F4IV star at a distance of 31.5 pc which implies that its relative size is mas, and thus it is considerably smaller than the resolution of mas of the 3.5-m-telescope in the K-band. In Fourier space this reduces to mas. These images are stored in “data cubes” of 250 frames. The telescope position is switched between object and PSF calibrator after each data cube to observe both under nearly identical atmospheric conditions. After background subtraction, flat-fielding and correcting for bad pixels, the data cubes are Fourier transformed. The modulus of the complex visibility is derived by deconvolving the power spectrum of the object with that of the PSF calibrator, while the phase is reconstructed using the Knox-Thompson algorithm (Knox & Thompson knox74 (1974)) and also the bispectrum method (Lohmann et al. lohmann83 (1983)). The complex visibility is averaged over all observations of EK Dra taken on one night. Finally, the binary parameters – position angle, projected separation and flux ratio – are derived from a model fit to the complex visibility in Fourier space. Except for the data points 1 and 2 in Table 1, for all observations the relative astrometry of the components has been put into a consistent reference frame. This reference frame is primarily based on astrometric fits to images of the Orion Trapezium cluster core, where precise astrometry has been given by McCaughrean & Stauffer (mccaughrean94 (1994)).
2.2 Radial velocity measurements: data

EK Dra is one of the stars monitored during the RV search program for young and active stars of the Thüringer Landessternwarte (TLS) described by Hatzes et al. (hatzes03 (2003)). For this program we use the 2-m-Alfred Jensch telescope of the TLS, which is equipped with an échelle spectrograph with a resolving power of . During the observations an iodine absorption cell is placed in the optical light path in front of the spectrograph slit. The resulting iodine absorption spectrum is then superposed on the stellar spectrum providing a stable wavelength reference against which the stellar RV are measured. In the first step, the spectra are bias-subtracted, flat-fielded and extracted using standard IRAF routines.
In the second step the RVs are calculated by modeling the observed spectra with a high signal-to-noise ratio template of the star (without iodine) and a scan of our iodine cell taken at very high resolution with the Fourier Transform Spectrometer of the McMath-Pierce telescope at Kitt Peak. The latter enables us to compute the relative velocity shift between stellar and iodine absorption lines as well as to model the temporal and spatial variations of the instrumental profile; see Valenti et al. (valenti95 (1995)) and Butler et al. (butler96 (1996)) for a description of the principles behind this technique. Fig. 2 shows our RV measurements together with those obtained by Duquennoy & Mayor (duquennoy91 (1991)).
RV measurements have been made at TLS since 2001 and these show that we can achieve a routine RV precision of m s-1. However, our RV measurements for EK Dra have an error of about 30 m s-1. Two factors degrade the RV precision of our EK Dra measurements. First, EK Dra has a of km/s. Since the RV error is proportional to the , the error compared to a more slowly rotating star with comparable should be several times worse. Second, EK Dra is an active star and as demonstrated by Saar & Donahue (saar97 (1997)) the activity can introduce significant RV “jitter” depending on the level of activity of up to several tensof m/s.
The relative RV measurements obtained by us were converted to absolute values by measuring the absolute RV of the template spectrum by fitting Voigt functions to photospheric lines with an equivalent width larger than 0.1 Å in the wavelength range from 5000 to 6000 Å.
2.3 Deriving the masses of the two components


The motion of EK Dra B with respect to the primary from 1991 to 2002 is shown in Fig. 1. Although almost no curvature is seen, this relative motion is definitely not caused by the proper motion of EK Dra A with respect to a chance-projected background star. The proper motion of EK Dra A is and (Hipparcos catalog), which is roughly perpendicular to the observed motion and also much faster. Furthermore, the companion has significantly slowed down over the time-span covered by the observations, which can only be explained by orbital motion. The slow-down additionally implies that the last observations are close to the apastron. The spectroscopic observations of Duquennoy & Mayor (duquennoy91 (1991)) cover the periastron. By combining the radial velocity data with the speckle observation it is possible to derive a first orbit of the system and the true masses of both components using the distance as measured by Hipparcos. The projected distance versus time is shown in Fig. 3. The deceleration is clearly visible. By combining the speckle imaging data with the radial-velocity data (Fig. 4), we derive a period of years. Given the orbital period the radial velocity (Fig. 4) constrains very well the mass-ratio of the two components. By fitting an orbit to the speckle data (Fig. 5) combined with the information on the projected velocity and the Hipparcos distance, we can calculate the true masses of the components and all other orbital elements by solving the Keplerian equations (Kepler kepler1609 (1609), Kepler kepler1618 (1618)). The orbital elements are summarized in Table 2. For the masses of the two components, we find and , for the primary and the secondary, respectively. With , the orbit is surprisingly eccentric. The distance between the stars is nevertheless still 2.2 AU at the periastron. It thus seem unlikely that the secondary has a big impact on the activity level of the primary.
| element | value |
|---|---|
| P | yrs |
| [HJD] | |
| e | |
| km/s | |
| km/s | |
| km/s | |
| AU | |
| dist | pc |
(1) esitimated value using the mass-ratio of the primary
and secondary, and
(2) semi-major-axis of the true orbit
(3) position angle of the line of intersection
between the tangential plane of projection
and the projected orbital plane
(4) periastron longitude
3 Spectral synthesis analysis
We observed EK Dra on September 11, 2001 and May 25, 2002 from Calar Alto using the high resolution échelle spectrograph FOCES (Pfeiffer et al. pfeiffer98 (1998)) mounted on the 2.2 m telescope. Data reduction and analysis were carried out using the reduction pipeline written in IDL especially for this fiber-coupled spectrograph.
For the spectral synthesis analysis we used the model atmosphere code MAFAGS. For a detailed description of the methods see Fuhrmann et al. (fuhrmann97 (1997)). As described there, we deduce the effective temperature from the Balmer line wings and the surface gravity from the iron ionisation equilibrium and the wings of the Mg Ib lines. The analysis is performed strictly relative to the Sun. The method for determining all stellar parameters was tested and compared extensively in Fuhrmann (fuhrmann2004 (2004)).
| name | MV | Mbol | ||||
|---|---|---|---|---|---|---|
| EK Dra | 7.60 | 4.79 |
3.1 Results for EK Dra
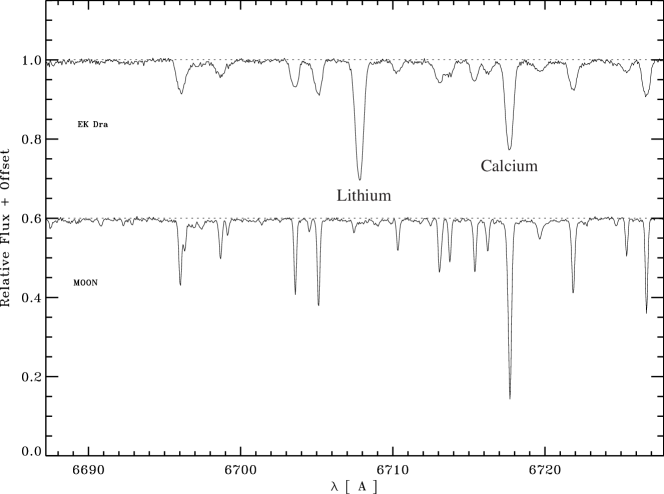
The chromospheric activity, the variability, the presence of core filling-in of the H, the calcium H & K and the magnesium Ib-lines and a strong lithium absorption line at 6707 Å (Fig. 6) indicate that the star is indeed young and if we believe the star to belong to the Pleiades, we can assume an age of about 125 Myr.
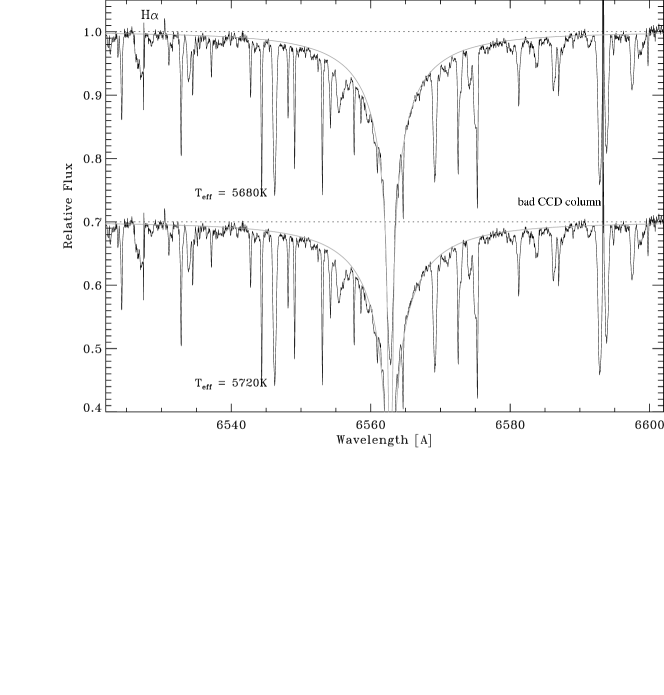
The spectral syntheses analysis we performed was challenging because it is known that the star rotates fast ( km/s) and it exhibits huge stellar spots which are much cooler that the surrounding surface. Depending on the position of the star spot, the star could appear cooler than it actually is. On the other hand the H-line core is filled-in up to a level of 0.5. The H-line is not noticeable filled-in. To measure the effective temperature we calculate a grid of line profiles of the H- and H-lines using the surface gravity, and iron abundance determined using the Fe I & II- and Mg Ib-lines. We fit the wings of the strong lines but not the core. The final effective temperature is measured using the H-temperature and comparing it with the H-temperature giving a weight of 75% to the H-temperature. If the new derived temperature changed more than 50 K compared to the previously obtained temperature we repeat the determination of the iron abundance as well as the surface gravity.
In the case of the spectrum taken on Sep. 11, 2001, both temperatures were identical while in the spectrum taken on May 25, 2002 the H-line leads to a 40 K hotter star. For a fit to the H-line profile see Fig. 7. However, the temperature most consistent with all measurements is K. We have double-checked the derived effective temperature with a fit to the H and H lines, assuming a spot temperature of 4500 K and a spot coverage of 1/4 of the visible surface. The resulting measured temperature does not significantly change the previously obtained results of the one-temperature fit because the continuum of the spot is only 10% of the continuum level of the surrounding stellar surface. This is because the spot is much cooler than the photosphere, and hence its total contribution to the light emitted from the star is very small. This results in a correspondingly small contribution to the total spectrum. In fact, the spot only produces a little hump in the photospheric line-profiles used for the Doppler imaging, which changes the EW of a photospheric line only by a small amount, and cannot be seen in H and H. Thus, even for a highly spotted star, the average line spectrum is dominated by the photosphere.
Comparing the spectroscopic distance determined by us to the Hipparcos parallax, we have a 5.8% discrepancy. This makes us confident that the spectral parameters we derived, especially the surface gravity , are reasonable. Regarding the H line depth and the line wings (Fig. 11, lower panel), we see significant changes of the effective temperature from 5700 K to 5580 K when using only the H temperature. The H temperature is not that strongly affected.
The analysis from Wyse & Gilmore (wyse95 (1995)) lead to a somewhat lower iron abundance of which was estimated by narrow-band Strömgen photometry. The temperature of EK Dra of 5930 K estimated by Dorren & Guinan (dorren94 (1994)) is higher than our measured temperature of K. But in our case the H- and H-line profiles would not support such a high temperature in our spectrum. Eggen (eggen98 (1998)) also estimated a metallicity of EK Dra of dex using Strömgen photometry, which is lower than the metallicity measured by us of dex.
For their Doppler imaging, Strassmeier & Rice (strassmeier98 (1998)) need stellar parameters as an input and they used Kurucz model atmospheres where they fixed the iron abundance to and the surface gravity to to derive K and km/s. They recover stellar spots at high latitude with a temperature difference of K. A polar spot cannot be confirmed or excluded by their data. The inclination of the stellar rotation axis is . The inclination of the orbit thus is significantly different from . Because of the significant difference from our spectral parameters (especially the effective temperature and the iron abundance) we propose caution when using the conclusions of the Strassmeier & Rice (strassmeier98 (1998)) Doppler imaging.
4 Space motion and age of EK Dra
Soderblom & Clements (1987) estimate the age of EK Dra to be Myr using activity indicators and claim that the star could have traveled from the Pleiades to the solar vicinity with a peculiar velocity of only 2 km/s. On the other hand, based on activity indicators Wichmann et al. (2003) claim that the star is even younger than the Pleiades with an age of Myr and call it a member of the local association. Wichmann & Schmitt (2003) have traced the space motion backward in time and exclude a former membership of the young associations Lupus-Centaurus-Crux or Upper-Centaurus-Lupus.
Stauffer et al. (stauffer98 (1998)) derived an age of the Pleiades of about 125 Myr using the aproproate distance scale and modern stellar evolution calculations. Estimates by Basri, Marcy & Graham (1996) using two brown dwarf members of the Pleiades give an age of 115 to 125 Myr.
We have used the proper motion mas, mas and the parallax measured by Hipparcos, as well as the RV of km/s measured by us to calculate the galactic space motion km/s).
EK Dra is located in the vicinity of the Sun at a distance measured by Hipparcos of pc. EK Dra is a young object and it is likely that its age lies within 50 to 125 Myrs depending on the criteria one applies, e.g. if one only regards the activity (50 Myr) or if one assumes it is a Pleiades field star (125 Myr).
With the average absolute brightness of the primary of mag, and of mag for the secondary component, and using the evolutionary tracks published by Baraffe et al. (baraffe98 (1998)) (Model: [M/H]=0, , Y=0.282), one derives a mass of M⊙ and an age of 35 Myr (lower limit: 30 Myr and upper limit 1.5 Gyr on the main sequence (MS)) for the primary. The mass derived from the evolutionary tracks agrees with the true mass within the errors. The companion is expected to be about 6 mag fainter than the primary in the V-band. The visible spectrum of EK Dra is thus completely dominated by the primary.
5 Activity, line asymmetry and RV variations
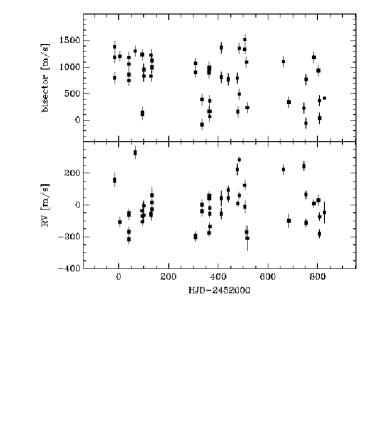

Because EK Dra B was close to the apastron at the time of the RV observations, and since the period of this highly eccentric orbit is years, the influence of the secondary on this section of the RV curve is negligible (Fig. 4). With an accuracy of our relative RV measurements of 30 m/s it is possible to study the RV variations caused by stellar activity. Saar & Donahue (saar97 (1997)) have studied the activity-induced RV variations and found a relation of , where is the star-spot area coverage [ is in %, in km/s, and in m/s]. For spots located at the equator, the filling factor is given by this equation. For spots located close to the pole, the RV variations would give a rise to a too small filling factor. Because spots on the pole do not give rise to RV variations, the amplitude of the RV variations in principle just give a lower limit for the filling factor . From the measured RV variations we thus derive (Fig. 8, upper panel) the peak-to-peak amplitude variation of about 550 m/s, which implies that due to the fact that we suspect the presence of a polar spot.
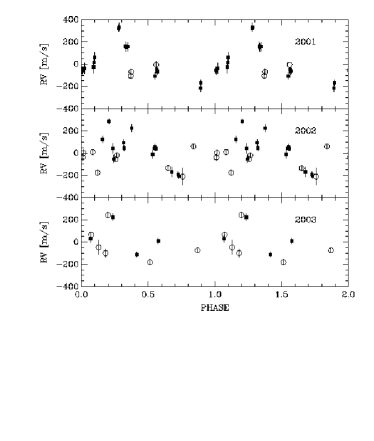
Performing a period analysis we find a period of the RV variation of days in the first two years of observations but adding the third year the period search programs do not recover the period clearly. When we inspect the data (see Fig. 9), we see that the amplitude of the RV signal declines.
Moreover, we see a change in the bisector of the spectral lines over the three years of observations. We use the classical Doppler imaging lines, Fe I at 6400 Å, and Ca I at 6439 Å to measure the amplitude of the asymmetry because they are not blended by other weaker spectral lines and there are no iodine lines in this part of the spectrum. Shown in Fig. 8 (upper panel) is the average velocity difference between the lower and the upper half of the spectral lines. A negative sign means that the lower part is blue-shifted with respect to the upper part of the line. During the three years the behavior of the bisector significantly changed. In 2001, the velocity difference is relatively constant with a shift of 700 to 1500 m/s, whereas in 2003, the bisector amplitude varies between 1200 m/s and m/s. We then can split the lines between asymmetric lines with a bisector from 700 m/s to 1500 m/s and symmetric lines with a bisector of 600 m/s to m/s (Fig. 10). Excluding the symmetric lines from the period analysis we recover the period over all three years. Compared to the amplitude of the RV signal of the symmetric lines, the signal for the asymmetric lines is more pronounced (Fig. 9).
We can summarize our finding as follows: in 2001 and 2002, we observe a periodic RV signal and the spectral lines were quite asymmetric. This RV signal is less obvious in the data from 2003 but can be recovered if only the asymmetric lines are used. Clearly, this is the signal of stellar spots not located at the pole; the Doppler imaging by Strassmeier & Rice (strassmeier98 (1998)) shows the presence of spots close to the equator. One possible explanation would be that in 2003, there were fewer spots at mid latitudes, or alternatively, there were so many plage regions so that it is difficult to recover the periodic RV signal from the spots. Plage regions are known to produce less asymmetric lines.
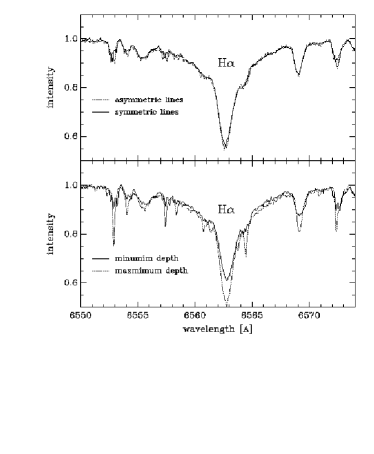
In order to find out if changes in the symmetry of the lines are related to the activity level, we averaged all spectra with symmetric photospheric lines and all spectra with asymmetric photospheric lines. Fig. 11 shows the H-line profiles of all spectra where the photospheric lines are symmetric in comparison with the average profile of all spectra where the photospheric lines are asymmetric. The difference between the two H profiles is remarkably small. However, we do see significant variations of the depth of H. Thus testing if the amplitude of the RV signal is dependent on the depth of H, we calculate the average RV of all spectra where H is deepest and all spectra where H is shallowest. We do not see any significant difference between the two samples, as the average RV of the first sample is m/s000footnotetext: variance, and the average of the second m/s 0. There is also no significant difference in the asymmetry of the two, as the average asymmetry of the first sample is m/s 0 and the asymmetry of the second sample is m/s 0. Thus, there is no obvious correlation between the RV or the asymmetry and the depth of the H-line. Additionally, there is only a very weak correlation between the asymmetry and the RV.
The change of the temperature as seen in Fig. 11 (lower panel) of about 120 K measured by the H-line profile is not as visible in the H-line profile. There, it only shows a temperature change of 20 K which lies within the errors of this method. Giving more weight (75%) to the H temperature will result only in a small temperature change. But of course the temperature change will also affect the Fe I and Fe II ionisation equilibrium and this will have an effect on the determination of the surface gravity . We cannot verify this here because the spectra obtained at TLS are mostly observed with the iodine cell in the light path which superposes iodine absorption lines on the part of the spectrum containing the necessary iron lines.
How can we interpret these findings? A spot that is located close to the equator would lead by its appearance to a positive asymmetry and also to a redshift of the spectral line. When the spot is receding due to rotation, it would lead to a negative asymmetry and to a blue-shift of the line. In this case we would expect a clear correlation between the asymmetry and the RV. Such a correlation is for example observed in RS CVn systems (Donati et al. donati95 (1994)). This is clearly not what we observe. The Doppler imaging of this star mainly shows a polar spot, and our estimate of the spot size from the amplitude of the RV variations indicates that there are only a few spots close to the equator.
In the case of sunspots it is well known that the Evershed effect causes the line cores to be blue-shifted on the limb-side of the penumbra and redshifted at the other side. The blue-shifted lines show a blue asymmetry that is negative, whereas the red-shifted lines show a positive asymmetry (Sanchez Almeida et al. Sanchez96 (1996)). While the contribution of the total light emitted is quite small, a spot does produce a hump in the profile of the photospheric line. Because we can measure the RV to a very high accuracy, such effects can be detected. However, observations of the penumbra of spots close to the disk center show positive as well as negative asymmetry (Balasubramaniam bala02 (1998)). Thus it is not surprising that in the case of a star where there are numerous spots close to the pole, there is no correlation between the RV and the asymmetry. It is interesting to note that the bisector of the solar granulation shows the famous C-shape that will result in almost no shift between the upper half of the line and the lower half. We would call such lines symmetric. However, once the convective structures are spatially resolved, the red-shifted inter-granular lanes turn out to give rise to spectral lines with a negative asymmetry, and the granules give rise to lines with a slightly positive asymmetry (Guenther & Mattig guenther91 (1991)).
Thus we presume that large and complicated flow patterns in the polar spots prevent us from observing a correlation between the RV and line asymmetry or depth of H. Nevertheless our observations show that the periodic RV signal can be detected if only the lines with positive asymmetry m/s are taken into account. This indicates that there is a link between the asymmetry and RV, which implies that both are possibly caused by spots.
Our observations also suggest that in the case of EK Dra it is impossible to account for the RV signal of the star spots to increase the sensitivity of a possible RV signal of an orbiting planet because the correlation of either the depth of H or the line-asymmetry with the rotation phase is limited.
6 Summary and conclusions
We have studied the young star EK Dra spectroscopically and have resolved the binary system by means of speckle interferometry. This star is in fact a young star evolving analogously to the Sun, where the analogy in the evolution is even closer than previously thought.
-
•
By combining the speckle interferometry with old and new RV measurements we have for the first time a reliable mass estimate of EK Dra A and EK Dra B of M⊙ and M⊙.
-
•
The orbit of the binary turns out to be highly eccentric with . The period of the system is of years, much longer than previously thought.
-
•
The high resolution spectra allow us to derive a new of K and a new value of of . Additionally, we measured a metallicity of . The new values thus differ from those of Strassmeier & Rice (1998), who found K, and the metallicity . However, the spectroscopic distance derived using our new values now is in good agreement with the Hipparcos distance.
-
•
The Baraffe et al. (baraffe98 (1998)) models allow a mass determination ( M⊙) and an age determination of 35 Myr (30 Myr to MS) for the primary.
-
•
From our data we can exclude the presence of a third low-mass companion in the system as suggested by Metchev & Hillenbrand (2004).
-
•
We also see variations in the H line wings which lead to a temperature difference between the two spectra of 120 K. This temperature change could be caused by huge stellar spots. The effect on the line core and wings of the H lines is not as strong.
-
•
The precise RV measurements taken in the course of the program shed more light on the activity of the star. We find that the primary star shows large amplitude RV variations which are presumably caused by its high activity level. In 2001 and 2002 the signal was periodic with a period of days. However, it seems that this period is slightly different from the photometric rotation period (2.599 to 2.796, Strassmeier & Rice strassmeier98 (1998)). This difference could be caused by differential rotation of the star. In 2002 this signal is significantly less obvious, and in 2003 almost absent. The periodic signal can be recovered from the whole dataset if only spectra in which the photospheric lines are asymmetric are used. We interpret this signal as being due to spots that are not located at the pole. However, the correlation between asymmetry and RV is weak. If the same analysis is performed on spectra in which the photospheric lines are nearly symmetric, we cannot recover the period signal of the RV variations. Also there is no obvious correlation between H and either the RV or the asymmetry. We interpret this by assuming that the star has large spots on the pole and possibly the Evershed-flow of these spots affects the RV, as well as the asymmetry signal. We conclude that in the case of EK Dra the RV signal is related to the rotation period of the star and is caused by its activity cannot be simply subtracted from the RV signal to increase the sensibility for the detection of a possible third object.
Acknowledgements.
This research has made use of the SIMBAD database, operated at CDS, Strasbourg, France. The authors want to thank Klaus Fuhrmann for the useful discussion. J.W. acknowledges support from the Deutsches Zentrum für Luft- und Raumfahrt under grant number 50 OR 0009. The data reduction made use of the “Binary/Speckle” software package developed by Rainer Köhler.References
- (1) Balasubramaniam, K.S., 2002, ApJ 575, 553B
- (2) Baraffe, I., Chabrier, G., Allard, F., Hauschildt, P. H., 1998, A&A 337, 403
- Basri, Marcy & Graham (1996) Basri, G., Marcy, G. W., & Graham, J. R., 1996, ApJ 458, 600
- (4) Butler, R. P., Marcy, G.W., Williams, E., McCarthy, C., Dosanjh, P., Vogt, S.S., 1996, PASP 108, 500
- Cannon & Pickering 1918- (1994) Cannon A.J., & Pickering E.C., 1918-1924, Harv. Ann., 91-100
- (6) Dorren, J.D. & Guinan, E.F., 1994, ApJ 428, 805
- (7) Dorren, J.D., Guedel, M., Guinan, E.F., 1995, ApJ 449, 431
- (8) Donati, J.-F., Henry, G.W., Hall, D.S., 1995, A&A 293, 107
- (9) Duquennoy, A. & Mayor, M., 1991, A&A 248, 485
- (10) Eggen O.J., 1998, AJ 115, 2397
- (11) Fröhlich, H.-E., Tschäpe, R., Rüdiger, G., Strassmeier, K. G., 2002, A&A 391, 659
- (12) Fuhrmann, K., Pfeiffer, M., Bernkopf, J., 1997, A&A 326, 1081
- (13) Fuhrmann, K., 2004, AN 325, 3
- (14) Guedel, M., Schmitt, J.H.M.M., Benz, A.O., Elias, N.M.II, 1995, A&A 301, 201
- (15) Guenther, E., Mattig, W., 1991, A&A 243, 244
- (16) Hatzes, A.P., Guenther, E., Kürster, M., McArthur, B., 2003, Toward Other Earths: Darwin/TPF and the Search for Extrasolar Terrestrial Planets, Heidelberg, 22-25 April, p. 441
- (17) Henry, G.W., Donahue, R.A., Baliunas, S.L., 2002, ApJ 577, L111
- (18) Kepler, J. 1609, Astronomia Nova I-V, Hrsg. v. der Kepler-Kommission. Verlag C.H. Beck, München.
- (19) Kepler, J. 1618, Harmonices mundi, Hrsg. v. der Kepler-Kommission. Verlag C.H. Beck, München.
- (20) Knox, K.T. & Thompson, B.J., 1974, ApJ, 193, 45
- (21) Köhler, R., Kunkel, M., Leinert, Ch., Zinnecker, H., 2000, A&A, 356, 541
- (22) Leinert, Ch. & Haas, M., 1989, A&A, 221, 110
- (23) Lohmann, A.W., Weigelt, G., Wirnitzer, B., 1983, Appl. Opt., 22, 4028
- (24) McCaughrean, M.J. & Stauffer, J.R., 1994, AJ, 108, 1382
- Metchev & Hillenbrand (2004) Metchev, S.A., & Hillenbrand, L.A. 2004, ApJ, 617, 1330
- (26) Pan, X., Shao, M., Kulkarni, S.R., 2004, Natur 427, 326
- (27) Pfeiffer, M. J., Frank, C., Baumüller, D., Fuhrmann, K., Gehren, T., 1998, A&AS 130,381
- (28) Robichon, N., Arenou, F., Mermilliod, J.-C., Turon, C., 1999, A&A 345, 471
- (29) Saar, S.H. & Donahue, R.A., 1997, ApJ 485, 319
- (30) Sanchez Almeida, J., Landi degl’Innocenti, E., Martinez Pillet, V., Lites, B.W., 1996, ApJ 466, 537
- (31) Sankarasubramanian, K. & Rimmele, Th., 2002, A&A 576, 1048
- (32) Soderblom, D.R., 1985, AJ 90, 2103
- Soderblom & Clements (1987) Soderblom, D.R. & Clements, S.D., 1987, AJ 93, 920
- (34) Soderblom, D.R., Benedict, G.F., Nelan, E., et al., 2004, AAS 204, 4507
- (35) Stauffer, J., Schultz, G., Kirkpatrick, J. D., 1998, ApJ, 499, L199
- (36) Strassmeier, K.G. & Rice, J.B., 1998, A&A 330, 685
- (37) Valenti, J.A., Butler, R.P., Marcy, G.W., 1995, PASP 107, 966
- Wichmann et al. (2003) Wichmann, R., Schmitt, J.H.M.M.,& Hubrig, S., 2003, A&A 399, 983
- Wichmann & Schmitt (2003) Wichmann, R. & Schmitt, J.H.M.M., MNRAS 342, 1021
- (40) Wyse, R.F.G. & Gilmore, G., 1995, AJ 110, 2771