Metallicity and HI Column Density Properties of Damped Lyman- Systems
Abstract
Based on the disk galaxy formation theory within the framework of standard CDM hierarchical picture (Mo, Mao & White 1998), we selected modelled damped Lyman-alpha systems (DLAs), according to their observational criterion by Monte Carlo simulation with the random inclinations being considered, to examine their observed properties. By best-fitting the predicted metallicity distribution to the observed ones, we get the effective yield for DLAs about , which is comparable to those for SMC and LMC. And the predicted distribution is the same as that of observation at the significant level higher than 60%. The predicted column density distribution of modelled DLAs is compared with the observed ones with the corresponding number density, gas content being discussed. We found that the predicted number density at redshift 3 agree well with the observed value, but the gas content is about 3 times larger than observed since our model predicts more DLA systems with higher column density. It should be noted that the predicted star formation rate density contributed by DLAs is consistent with the most recent observations if the star formation timescale in DLAs is assumed to be 1 3 Gyr. Meanwhile, the connection between DLAs and Lyman Break galaxies is discussed by comparing their UV luminosity functions which shows that the DLAs host galaxies are much fainter than LBGs. We also predict that only few percent of DLAs can host LBGs which is also consistent with current observations. However, there is a discrepancy between model prediction and observation in the correlation between metallicity and HI column density for DLAs. We suggest that this could result from either the inadequacy of Schmidt-type star formation law at high redshift, the diversities of DLA populations, or the model limitations. Although our current simple model cannot fully reproduce the observed DLA velocity distribution, we argue that such kind of model can still provide valuable information for the natures of DLAs.
1 INTRODUCTION
The nature of clouds (or protogalaxies) that host high redshift Damped Lyman- systems (DLAs) has been a controversial topic for many years. By definition, DLAs are absorbers seen in quasar optical spectra with HI column densities . The studies on DLAs include the evolution of neutral gas (Storrie-Lombardi & Wolfe 2000; Proux et al. 2002), their metal abundance and enrichment history (Pettini et al. 1994, 1997a, b; Lu et al. 1996; Ma & Shu 2001; Prochaska & Wolfe 2002; Prochaska 2003), the dust depletion (Vladilo 1998, 2002; Hou, Boissier & Prantzos 2001) and their kinematics (Prochaska & Wolfe 1997, 1998; Wolfe & Prochaska 2000). They have constituted powerful tools to investigate the properties of distant galaxies (or of their building blocks), and consequently provided strong clues to the formation and evolution of galaxies.
It has been a common knowledge that DLAs are the progenitors of present-day galaxies. But substantial debate continues over exactly what populations of galaxies are responsible for them. Based on observed internal kinematics of DLAs traced by the associated heavy element absorption lines, Prochaska & Wolfe (1997, 1998) proposed that DLAs relate to rotating-support galactic disks at the time before which substantial gas consumption has taken place. Meanwhile, direct imaging shows that low and intermediate redshift DLA host galaxies span a variety of morphological types from dwarf, irregular, and low surface brightness (LSB) to normal spiral galaxies (Le Brun et al. 1997; Rao & Turnshek 1998; Kulkarni et al. 2000, 2001, Chen & Lanzetta 2003; Rao et al. 2003). Numerical simulations and semi-analytic models have shown that such observational signatures can be explained by a mixture of rotation, random motions, infall, and mergers of proto-galactic clumps (Haehnelt, Steinmetz & Rauch 1998; Maller et al. 2001, 2003). Moreover, several authors have suggested that high redshift DLAs could be associated with Lyman Break Galaxies (LBGs)(Nulsen, Barcos & Fabian 1998; Shu 2000; Schaye 2001b) since strong galactic winds from LBGs would also give rise to DLAs observed against background QSOs. Although recent work done by Moller et al. (2002) did not suggest that there be a DLA/wind connection, further observational evidence is still needed.
In theory, one of the methods for DLAs research is to assume that DLAs are galaxies with different morphological types, such as disks, irregulars, dwarfs, or LSBs, then to compare model predictions with the observed properties, such as abundance patterns, kinematics or number densities (Matteucci, Molaro & Vladilo 1997; Meusinger & Thon 1999; Prantzos & Boissier 2000; Hou, Boissier & Prantzos 2001; Ma & Shu 2001; Mathlin et al. 2001; Calura, Matteucci & Vladilo 2003; Boissier, Proux & Pettini 2003; Lanfranchi & Friaca 2003). Another approach is to start from the framework of cosmic structure formation and evolution. Hence the observed DLA properties are strong tests for various cosmological models and also for galaxy formation and evolution models (Mo & Miralda-Escude 1994; Gardner et al. 1997, 2001; Cen et al. 2003; Nagamine, Springel & Hernquist 2003; Cora et al. 2003; Okoshi et al. 2004). It should be pointed out that semi-analytic models (SAMs) have been quite successful in understanding galaxy formation and evolution (Baugh et al. 1998; Mo, Mao & White 1998; Somerville & Primack 1999; Somerville, Primack & Faber 2001). This technique adopts statistical methods to follow the growth of dark matter halos, which is a major concept of the building-up structure in the universe. By further introducing some physical rules, one could fairly describe the gaseous and stellar process within dark halos (Kauffmann 1996; Mathlin et al. 2001).
However, when this kind of models was applied to DLAs, it is found that model results cannot simultaneously reproduce the observed kinematical data and column density data (Haehnelt et al. 1998; Jedamzik & Prochaska 1998; Maller et al. 2001). Some alternative explanations have been proposed such as multiple gas discs along the line of sight or a large contribution of mergers at high redshift (Churchill et al. 2003).
We notice that in a recent paper done by Boissier, Péroux & Pettini (2003), some DLAs properties, such as number densities, column density distribution and gas densities, were discussed based on a simple model. Many interesting results were obtained. For instance, they claimed that in order to reproduce the observed properties, LSBs and spirals are at least responsible for DLAs, while dwarf galaxies may not be dominant (but see Efstathiou 2000).
In the present paper, we will adopt a SAM to examine in detail the observed metallicity, HI column density and star formation properties of DLAs in the context of standard hierarchical picture (White & Rees 1978; White & Frenck 1991) assuming that DLAs are hosted by disk galaxies. The disk galaxy formation model with single disks is adopted because we mainly concentrate on HI column densities and the cosmic star formation rate density contributed by DLAs rather than their kinematics (see more detailed discussions in Section 3).
In Section 2, we describe our galaxy formation model in the CDM cosmogony with the considerations of how star formation and chemical enrichment proceed. The simulated DLA sample is selected by Monte Carlo simulation according to their observational criterion. We compare the model predictions with observed DLA properties in Section 3 on the following items: metallicity, column density, number density, neutral gas content, contributed star formation rate density, and the correlation between metallicity and HI column density. The discussions of the model parameters on the results are also presented in this section. Main conclusions are summarized in Section 4. As an illustration, DLA properties are assumed at redshift and the following CDM cosmogony is adopted throughout the paper with , , and . Whenever a numerical value of is needed, we take .
2 MODELS
2.1 Galaxy formation
The galaxy formation model in the present paper comes from that for disk galaxies suggested by Mo, Mao & White (1998, hereafter MMW), in which the primordial density fluctuations give rise to galactic halos, and baryons within individual halos condenses later and forms disks due to their angular momentum. The relation between halo mass and its circular velocity is given by
| (1) |
where is the gravitational constant, is Hubble constant at redshift . Disks are assumed to be thin, to be centrifugal balance, and to have exponential surface profiles
| (2) |
where and are, respectively, the central surface density and the scale length, and they can be expressed as
| (3) |
and
| (4) |
respectively. Here is the mass ratio of disk to halo, is the halo dimensionless spin parameter, is Hubble constant at present day, respectively (see MMW for details). The disk global properties are uniquely determined by , , and , while other cosmological parameters, such as , and , affect disks only indirectly through . Since Hubble constant increases with redshift, it is expected from the above equations that galaxy disks of any given and are less massive and smaller but more compact at higher redshift.
The density profile of a halo is assumed to be the NFW profile (Navarro, Frenk & White 1997), with the concentration which is the median value for its distribution in CDM cosmogony (Jing 2000). The rotation speed at radius corresponding to this profile is
| (5) |
where , and is the virial radius of a halo.
The halo mass function at any redshift is described by the Press-Schechter formalism (Press & Schechter 1974):
| (6) |
where with being the linear growth factor at and , is the linear mass fluctuation in top-hat windows of radius which is related to the halo mass by , with being the mean mass density of the universe at . A detailed description of the PS formalism and the related cosmogonic issues can be found in the Appendix of MMW.
The distribution function of spin parameter is always assumed to be independent of time and . It can be well described by a lognormal function
| (7) |
with and (Warren et al 1992; Lemson & Kauffmann 1999), respectively.
Although the baryon fraction within individual galactic halos is usually treated as a constant initially, the effective fraction of baryonic mass which can form disks should be different from galaxies to galaxies due to supernovae feedback (Somerville & Primack 1999; Baugh et al. 1999; Cole et al. 2000). Since small galactic halos have shallow potential wells which will lead to strong mass loses due to galactic winds and mass outflows (Shu, Mo & Mao 2003), should be a function of which can be expressed as (Dekel & Silk 1986; White & Frenk 1991)
| (8) |
where is the maximum baryon fraction within halos. Here we take = 0.1 according to the cosmic nucleosynthesis (Burles & Tytler 1998) and the corresponding discussions of this parameter on the model results are in Sec. 3.7.
It should be pointed out that the interaction between disks and bulges is not considered in the present paper. This effect will be important for very compact objects which correspond to galaxies with . Because the fraction of these galaxies is less than 10% of the whole galaxy population (eq.7), and DLAs are dominated by extended galaxies with large due to large absorbtion cross sections, this treatment is reasonable and will not influence our results (see Sec. 3.2).
2.2 Star formation and chemical evolution
With the cumulation of gas in the disk, star formation takes place. According to Kennicutt (1998) with the consideration of rotation velocities in disks, the adopted star formation prescription in the present paper is
| (9) |
where is the star formation rate (SFR) per unit area, is the gas surface density and is the rotation speed at disk radius , is the star formation efficiency which is set to be 0.1 based on the disk modelling of Boissier & Prantzos (2000). The SFR prescription in the present paper is somewhat different from that in Ma & Shu (2001), within which the disk instability was taken into account. Note that eq. (2.2) has been very successful in modelling the Milky Way disk properties both locally and globally, as well as other galaxies both at local universe and at high redshifts (Boissier & Prantzos 1999, 2000; Prantzos & Boissier 2000). Especially, such prescription is necessary for models to reproduce the observed abundance gradient in the disks of the Milky Way and external galaxies (Hou, Prantzos & Boissier 2000; Henry & Worthey 1999). For the Milky Way type galaxies, eq. (2.2) is equivalent to since keeps nearly constant within very wide ranges in disks and outskirts.
The rotation speed contributed by an exponential disk is (Freeman 1970)
| (10) |
with and . and are modified Bessel functions of order , respectively. Then the resulted rotational velocity for an exponential disk within a NFW halo can be calculated through . Whenever the disk mass fraction of a galaxy with the given is known, its rotation velocities at different radius in the disk is determined. The star formation prescription eq. (2.2) can be applied at different radius.
As mentioned above, we focus on the DLA properties of HI column densities, metallicities and star formation rates but their kinematics, we will not apply detailed prescriptions of either gas infall or outflow. Instead, the effects of gas infall and outflow are included within the obtained effective yield (see below) and the disk mass fraction (eq. 8), respectively. No radial gas inflow or outflow within disks is considered.
Under the approximation of instantaneous recycling, the chemical evolution in disks can be expressed by the simple closed-box model (Pagel 1997) with metallicity to be
| (11) |
where is the initial metallicity of gas and is assumed to be , is the effective yield, and is the gas fraction. The evolution of gas surface density is determined by
| (12) |
where is the return fraction of stellar mass into ISM, and we take for a Salpeter stellar initial mass function (see Madau, Pozzetti & Dickinson 1998).
According to their detailed analysis, Bechtold et al. (1998) and Lanfranchi & Friaca (2003) pointed out that star formation proceeds within DLAs in a typical timescale (see also Dessauges-Zavadsky et al. 2004). In the present paper, the star formation timescales for individual DLA galaxies are reasonably chosen to be random between 1 to 3Gyr, and initially () the gas surface density distribution of a galactic disk with a given is (eq. 2). It should be pointed out that the effect yield in our model is obtained by best-fitting the modelled metallicity distribution of DLAs to that of observations. Shorter star formation timescale adopted will lead to higher effect yield and vice versa. We will come back to the discussions of the effects for different star formation timescale intervals adopted between 0.5 and 3Gyr on our model results in Sec. 3.7.
2.3 Modelling DLA population
Since the distributions of and for individual halos are known, we can generate a sample of galaxies by a Monte-Carlo simulation in the - plane at . According to eqs. (2.2) and (11), we can then investigate star formation and chemical evolution for individual disks based on their randomly selected star formation timescales. The modelled DLAs are selected over the sampled galaxies by random sightlines penetrating disks according to the observed selection criterion, i.e., . Here, random inclinations for disks in the sky are considered and a hydrogen fraction is assumed with the consideration of Helium in gas. We assume that the physical quantities, such as column density, metallicity, SFR, of a modelled DLA, are represented as the physical quantities at the point where the sightline penetrates the disk, and the projected distance between the point and the galactic center is named as the impact parameter of the modelled DLA. We adopt from 50 to , which corresponds roughly to the observed range for spirals and irregular galaxies at the present day. A lower limit of , 50 , is chosen because gas in halos with would not be cooled down to form disks due to the strong external UV background at high redshift (Rees 1986).
3 MODEL PREDICTIONS vs OBSERVATIONS
3.1 Observations
DLAs have shown many observational properties, including metallicities, column densities, kinematics, etc. The observed metallicities of DLAs adopted in the present paper mainly come from the recent compilation presented by Hou, Boissier & Prantzos (2001) and by Kulkarni & Fall (2002) for the Zn element. All the data presented by those authors are compiled from the results of various observers. Moreover, one new observed DLA from Péroux et al. (2002) and four from Prochaska et al. (2003b) are added. Since our model focuses on DLAs at redshift , the observed DLAs with redshift are selected for the direct comparison with our model results. We noticed that in the compilation of Kulkarni & Fall (2002), Zn abundances of one third DLAs are represented as upper/lower limits. Here, we do not simply exclude them. Instead we choose their limit values when we discuss the observed metallicity distribution of DLAs. It should be pointed out that the data without these limitations has the same distribution function as that we do in 94% significance level after the K-S test.
Although including other non-refractory elements may be helpful in enlarging the data sample, this may also introduce other uncertainties, such as dust depletion, etc. Therefore, we prefer to rely only on the Zn elements because Zn is generally believed to be an undepleted or only mildly depleted element. But this might cause completeness problems for the adopted metallicity distribution due to incomplete Zn sample. To make this point clearer, we have compared our Zn sample with more complete Fe sample from Prochaska et al. (2003a) which is assumed to be in the Galactic Halo depletion pattern (Savage & Sembach 1996) since Fe has a significant level of dust depletion. The K-S test shows that the two samples have the same distribution function at significance level higher than 97. This shows that our Zn sample distribution is generally consistent with more complete sample, and therefore reasonable to be compared with theoretical model.
The observed data of HI column densities come from the survey of Storrie-Lombardi & Wolfe (2000) (hereafter SW00), within which 85 DLA absorbers have their column densities covering the redshift range from 0.008 to 4.694. Especially, about 73% of DLAs have the redshift . The observed number densities of DLAs come from Proux et al. (2003). The observed contribution to the cosmic SFR density by DLAs comes from the most recent work done by Wolfe, Gawiser & Prochaska (2003)(hereafter WGP03) according to the absorption lines.
3.2 , and impact parameter
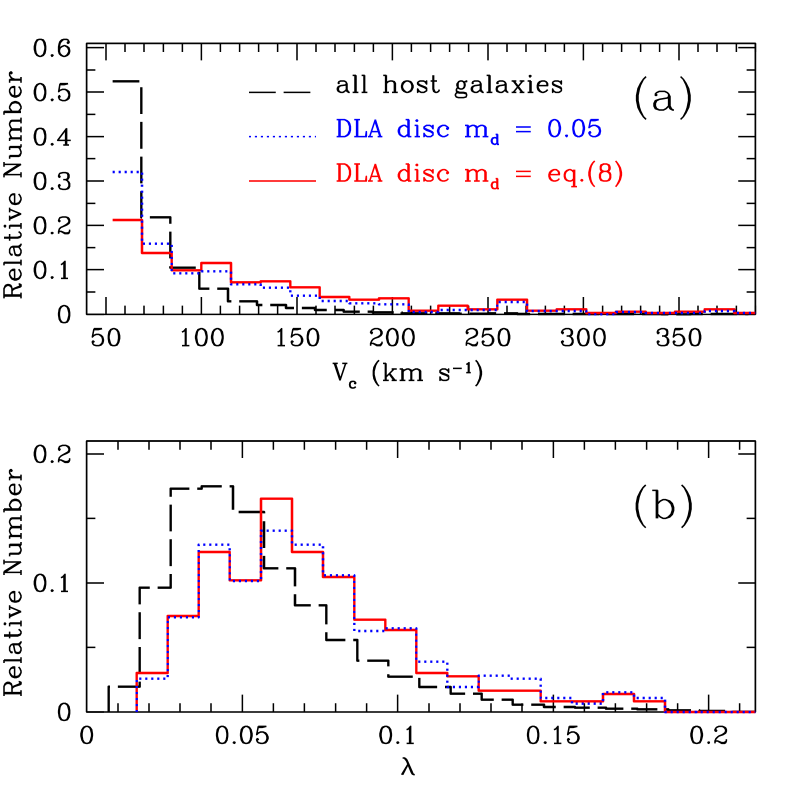
The predicted distributions of for the modelled DLA population, which are selected according to the criterion described in Sec. 2.3, are plotted in Fig. 1 as solid histograms. As for comparison, we also plot the corresponding distributions of all galaxies predicted by eqs. (2.1) and (7) in long-dashed histograms and the results with fixed in dotted histograms (see Sec. 3.7 below), respectively. It can be found as expected that modelled DLAs are still dominated by small galaxies because the number of small galaxies is very large although individual absorption cross-sections are small.
The predicted halo mass function for DLAs is much flatter than that for all galaxies predicted by PS formalism, because larger galaxies, although less numerous, are easier to be selected as modelled DLA hosts due to their larger absorption cross-sections.
The distribution of selected DLAs peaks around 0.065 with the median value of 0.08, larger than those for all galaxies predicted by eq. (7). This means that DLA hosts in our model are bias to extended disk galaxies, in consistence with MMW. This also implies that our ignorance of interaction between disk and bulge is acceptable since the effect is important only for galaxies with small ().
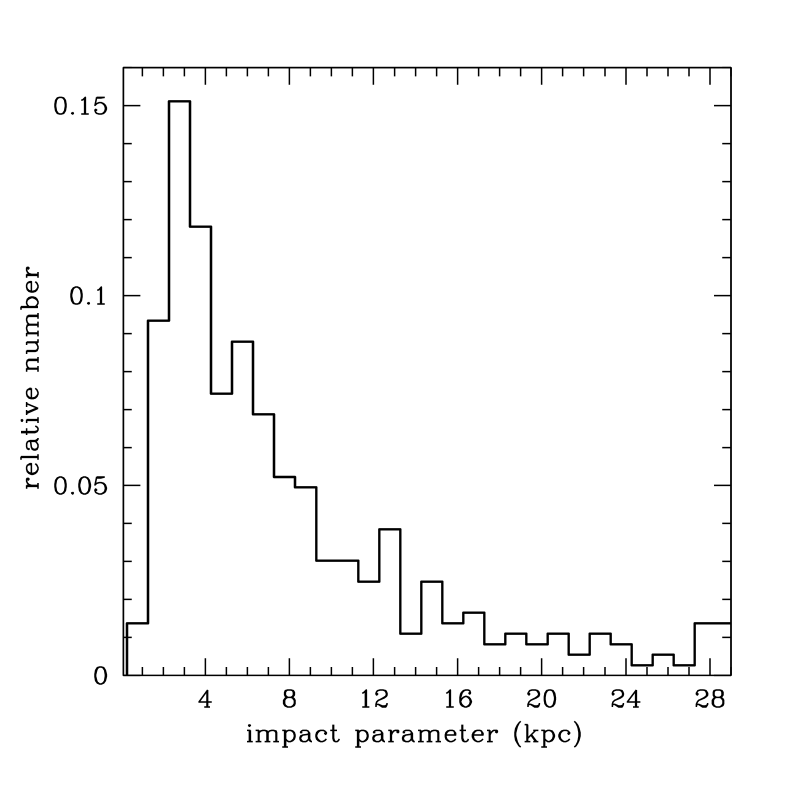
Moreover, the resulted distribution of the impact parameters of selected DLAs is shown in Fig. 2. It is found that the peak is around 3kpc, which is resulted from the huge amount of small halos in PS formalism and the finite radius for individual galaxies that can produce DLAs estimated by eq. (14) in MMW. Because the DLAs are dominated by small galaxies which are always faint, the peak implies that the host galaxies of DLAs are difficult to be observed photometrically.
It should be pointed out that the distribution in our model seems to be not fully consistent with the observed kinematic characteristics of DLAs, which is very common in current SAMs (Prochaska & Wolfe, 1997). Maller et al. (2001) proposed some alternatives, such as gas discs could be more extended or DLAs sightlines could pass through multiple gas discs, i.e., substructures, in a parental halo. Indeed, those improved models could fairly reproduce the observed kinematics.
Because we mainly focus on column density, metallicity and SFR of DLA population as emphasized above, our current single disc model could still provide valuable insights into the DLA properties.
3.3 Metallicity Distribution and Effective Yield
As we know, dust depletion will underestimate the true metallicities of DLAs if only based on their observed spectrum. Unfortunately, the physical prescription for the dust depletion is still poorly known although there are some models available in this field. To avoid the complicated dust depletion problems, we adopt the Zn abundance as the metallicity indicators for DLAs because Zn is usually regarded as the undepleted element in the interstellar medium (ISM) (Savage & Sembach 1996) although its exact nucleosynthesis nature is still unclear. Moreover, the Zn abundance is a good tracer of iron from the disk to the halo in the Milky Way galaxy (e.g. [Zn/Fe] is close to zero everywhere). However, recent abundance measurements in the very metal poor stars have found some Zn enhancements indicating a possible Type II supernova origin (Prochaska et al. 2000; Umeda & Nomoto 2002; Nissen et al. 2004).
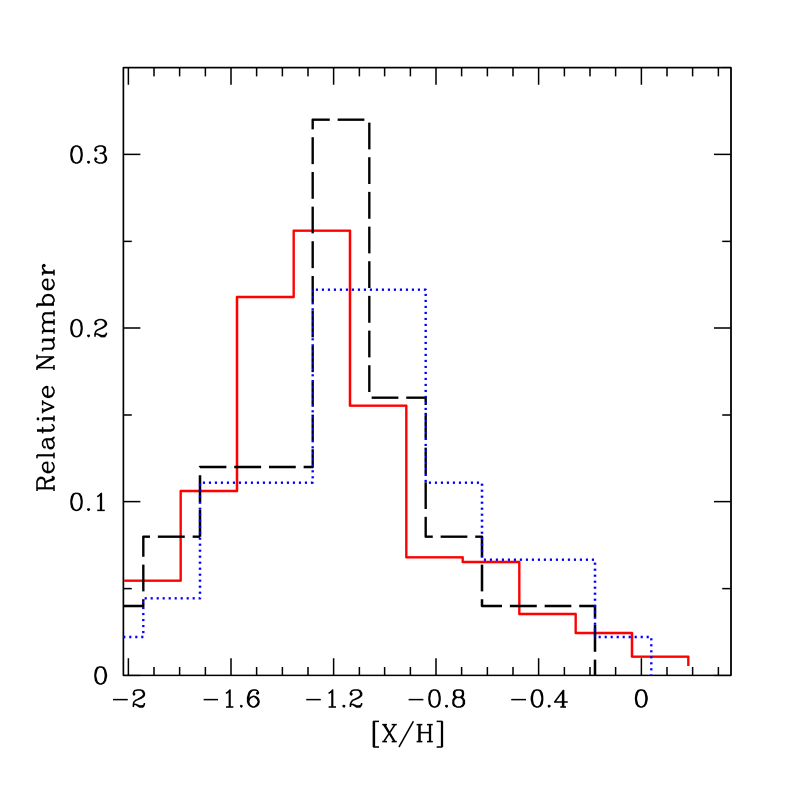
The predicted metallicity distributions of DLAs is plotted as a solid histogram in Fig. 3 while the observed distributions of DLAs with and all DLAs are plotted as dashed and dotted histograms, respectively. It should be noted that the predicted distribution is obtained by best-fitting the model result to the observational distribution for DLAs with through tuning the effective yield in eq. (11). We get the effect yield for the best-fit result with the assumption of star formation timescale for DLAs being random between 1 and 3Gyr, which is consistent with both the observational basis and theoretical prescriptions (Bechtold et al. 1998; Lanfranchi & Friaca 2003; Dessauges-Zavadsky et al. 2004). Although the -weighted mean metallicity is a cosmological measure, we do not discuss this quantity here because of large difference between theoretical predictions and observations as Prochaske et al (2003a) pointed out. Indeed, our model shows that the -weighted mean metallicity is about , higher than the observed values, which is about for our Zn sample (limits not included). This could be resulted by the discrepancy between theoretical results and observations for the correlation between [Zn/H] and , which will be discussed in Sec. 3.6.
The Kolmogorov-Smirnov method is applied to best-fit the modelled distribution to the observed ones with , which shows that the two data sets follow the same population distribution function at the significance level higher than 60. We conclude that the predicted metallicity distribution agrees well with the high redshift observations. Moreover, from the figure we can find that the metallicity distribution of observed DLAs with is very similar to that of all observed DLAs (Pettini et al. 1997a;b). But the mean metallicity for DLAs seems to be a bit poorer, which implies that the mean metallicity of DLAs might evolves with cosmic time (Kulkarni & Fall 2002, Prochaska et al. 2003a).
The obtained effective yield is similar to those of SMC and LMC ( 0.25, Binney & Merrifield 1998) and of disk clusters ( 0.30, Pagel 1987). The low effective yield for DLAs, compared with that for the solar neighborhood (about 0.7), implies that the star formation precesses in DLAs should be less active than those in the Milky Way-type galaxies. Because DLA hosts are dominated by small galaxies for which gravitational potential wells are very shallow, supernovae feedback should be significant (Efstathiou 2000; Shu, Mo & Mao 2003) which has been considered in eq. (8) while their star formation seems to be inactive.
3.4 Column Density, Number Density and Gas Content
The frequency distribution of HI column density for DLAs , which is defined as the number of absorbers per unit and per unit absorption distance , is very important for understanding galaxy formation and evolution in the universe. It can be expressed as (see also Boissier, Péroux & Pettini 2003)
| (13) |
where is the number of DLAs with HI column density between and detected in the spectra of QSOs encompassing a total absorption distance from to , and with . Based on large bright QSO surveys, Wolfe et al. (1995), SW00, and recently Proux et al. (2003) have derived the distribution function . SW00 found that can be well approximated by a power-law function of HI column density, while Peroux et al. (2003) found that the distribution of can be fitted with a function down to Lyman Limit systems with the index of .

We plot the model prediction of at in Fig. 4 as a solid line while the observed frequency distributions for DLAs with 3.5 from SW00 is plotted as circles with error bars respectively. It can be found from the figure that the predicted distribution agrees well with observations at the high end. But it is smaller than observations at low end with the maximum difference as large as 3, i.e., the predicted distribution is a bit flatter than observed ones. The similar discrepancy appear in the more complicated numerical simulation study of Nagamine, Springel & Hernquist (2003) as well. This could be due to the limitation of our simple model or perhaps this could be a failing of the power spectrum which deserves further investigations.
There exists an upper limit in both the observed and modelled distributions of DLA HI column densities with the modelled one being a bit larger. Observational bias has been proposed by a number of authors in order to explain the difference (Boiss et al. 1998; Prantzos & Boissier 2000; Schaye 2001a). As suggested by Boiss et al. (1998), there is a limitation for the observations like , which has been explained as dust obscuration (see also Prochaska & Wolfe 2002). After careful criticizing the above dust induced selection bias, Schaye (2001a) proposed a physical explanation that clouds with will not appear because in this case, neutral hydrogen will be converted into molecular hydrogen before reaching such high column density. However, observations show that in general, the mean molecular fraction is small in DLAs ( see Ledoux, Petitjean & Srianand 2003 and reference therein), and there is no correlation between the observed amount of H2 and the HI column density. This implies that the explanation proposed by Schaye (2001a), although quite attractive, still could not explain many other observations. In our model, this is because most DLAs with high HI column densities are absorbers penetrating through disk central regions where the absorption cross sections are very small. It should be mentioned that observations show a trend that this upper limit of HI column density is larger at lower redshifts (SW00), which, we suggest, could be due to the result of inside-out disk formation.
If is known, the number density of DLAs per unit redshift can be calculated through
| (14) |
where (= 10) and are the lower and upper limits of HI column density distribution for DLAs, respectively. Meanwhile, the mass density of neutral hydrogen associated with DLAs can be estimated by
| (15) |
where is the mass of the hydrogen atom, is the mean atomic weight per particle, is the critical density at present time. Noted that and are dominated by and , respectively, for the power index between and of .
The model prediction for is about 0.26, in consistence with the SW00 result according to their fitted formula: , which gives for = 0.055 and = 1.11. It is some how larger than the value given by Peroux et al.(2003), which is about 0.24. We notice that in Figure 4, model predicted is much smaller than observational ones at low column density. The agreement of number density between the model prediction and the observation is because the model predicted distribution of is flatter, i.e., model predicts more DLA systems with higher column densities.
Meanwhile, we get the predicted with the observation result being at redshift 3 (Péroux et al. 2003, Boissier et al. 2003). The reason that the predicted neutral gas density associated with DLAs is higher than that observed is mainly because the upper limit of HI column density is larger in our modelled DLAs. Another possible reason is that we simply assume that all Hydrogen gas is in atomic form without considering the molecular fraction. The later one is very complicated because the general transferring between HI and is still unclear (Ledoux, Petitjean & Srianand 2003, Petitjean, Srianand & Ledoux 2002).
3.5 SFR density
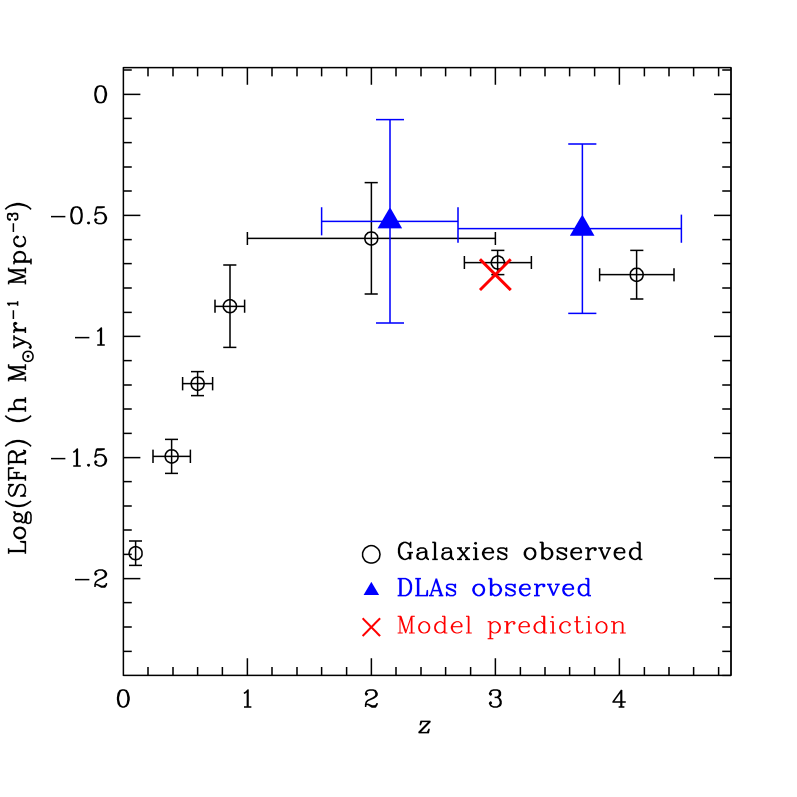
Based on the selected DLA sample, we can get the predicted SFR density contributed by DLAs at and show it as a cross in Fig. 5 which displays the cosmic SFR density as a function of redshift resulted from different observations. The most recent observational results done dy WGP03 for DLAs with based on the absorption lines are also plotted in the figure as triangles. It can be found that the model prediction is consistent with observations and supports the “consensus” model described by WGP03.
As suggested by WGP03, the SFR densities resulted from DLAs are similar to that from high redshift luminous galaxies, which are observed as Lyman Break Galaxies (LBGs). This implies a possible connection between these two populations as suggested by Schaye (2001b). On the other hand, Mo, Mao & White (1999) proposed that DLAs and LBGs are two distinct populations by the fact that DLAs are in favor of extended galaxies with large angular momentum (spin parameter ), while LBGs are in favor of compact systems with small angular momentum. They may exhibit very different observational properties such as distributions of sizes and SFRs. So, it is interesting to compare the luminosity functions of selected DLA host galaxies with that of LBGs.
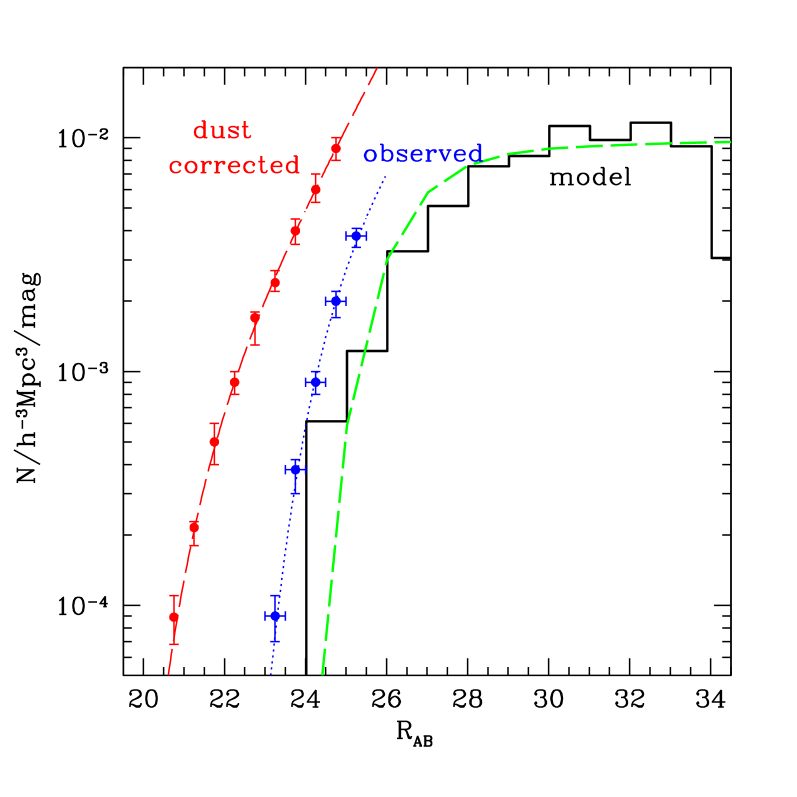
In Figure 6, we show, with solid histogram, the predicted UV luminosity function of selected DLA hosts galaxies. In order to parameterize the model results, we have fitted a Schechter function to the modelled histogram, in which the data points are weighted by a random fluctuation. The fitted parameters are , , .
The observed and dust-corrected UV luminosity functions of LBGs are also plotted as full circles with error bars (data from Aldelberger & Steidel 2000). Here the prescriptions suggested by Madau et al.(1998) and Steidel et al.(1999) are adopted to convert the model SFR distribution of DLA host galaxies to their UV luminosity function in CDM cosmology. It can be found that the typical magnitude of the predicted DLA hosts is , which are much fainter than LBGs with typical . This implies that a typical DLA host galaxy in our model has its SFR 100 times smaller than a typical LBG. Because the number density of DLA host galaxies is about 0.26 (see previous subsection) which is about 100 times larger than the observed comoving number density of LBGs, our predictions of cosmic SFR density contributed by DLAs is similar to that of LBGs at .
Moreover, it can be found from the figure that only a few percent DLA host galaxies have brighter than 25.5 which is the current observational threshold for LBG observation at . This is consistent with current status about DLA/LBG connection done by both observationally in (Möller & Warren 1998) and model predictions by Shu (2000). According to the above discussions, we suggest that DLAs and LBGs should be physically different populations although chemical evolution models have shown that DLAs and LBGs are smoothly connected in their evolutionary history, within which LBGs are galaxies with shorter star formation timescale like starburst, and DLAs proceed slower star formation (Shu 2000; Ma & Shu 2001).
How would dust obscuration (e.g. the Boissé bias) affect the above results? In order to test this argument, we have applied the bias proposed in Prantzos & Boissier (2000) and Hou, Boissier & Prantzos (2001), that is to exclude the systems that satisfy . We found no significant difference for the luminosity function and also the impact parameter distribution. There seems to be no evidence, at least in the present model framework, that a major fraction of the SFR density could occur in galaxies with significant dust obscuration.
3.6 Metallicity vs Column Density
A very unusual property of DLAs observed is that there seems to be a trend of anti-correlation between their [Zn/H] and HI column densities, which is independent of redshift as noticed by Boissé et al.(1998). In fact, as demonstrated by Hou, Boissier & Prantzos (2001) and Prochaska & Wolfe (2002), this anti-correlation trend exists for almost all the observed iron-peak elements as well as [Si/H] in DLAs. This could be possibly due to the existence of dust obscuration in observed DLAs since the same trends for some elements are also found in the Milky Way galaxy (Wakker & Mathis 2000). However, we argue that this should not be always the case for DLAs, since the trends of anti-correlation for Zn and Si vs also exist, while these two elements are not depleted or only slightly depleted (Savage & Sembach 1996). Some other mechanisms should be invoked.
Boiss et al. (1998) claimed that this anti-correlation is not physical. The absence of DLAs with low metallicities and low HI column densities could be attributed to the observational selection effects, i.e., below some level of the HI column density current spectroscopy is not able to detect metal atoms along sightlines towards QSOs. And, the lack of DLAs with both high metallicities and column densities is due to the dust obscuration. By proper treatments of extinction on their disk models, Prantzos & Boissier (2000) have shown that extinction towards background QSOs increases rapidly as the quantity (which is Zn column density) is greater than 21, making the background QSOs unobservable in the optically selected survey. Such kind of interpretation could be tested if, on one hand, one could be able to detect DLAs towards much fainter QSOs, and/or on the other hand, more sensitive instruments will become available so that more metal-poor DLAs with low column densities could be detected. An alternative is to consider the properties of DLAs in a complete, radio selected QSO sample, which should not be influenced by the dust content. Indeed, such a survey has been done by Ellison et al. (2001). Those authors have surveyed a sample of DLAs toward radio selected quasars and found no significant difference in the HI distribution of those DLAs. Moreover, dust obscuration has also been argued by Prochaska & Wolfe (2002), who made a detailed analysis of dust extinction contained in DLAs. They found that inferred extinction values and apparent magnitudes imply dust obscuration plays a relatively minor effect in the DLA analysis at least for .
Recent three dimensional SPH simulation of disk galaxy formation by Churches et al. (2004) have shown that in the modelled disks, a significant fraction could be optically thick and have higher column density than observed in DLAs. This implies that background quasars would be obscured by some disks, producing selection effect toward the denser absorption systems. But there is no substantive evidence in HI observations. So, the observed trend of anti-correlation between metallicity and column density remains as an open question in DLA studies.
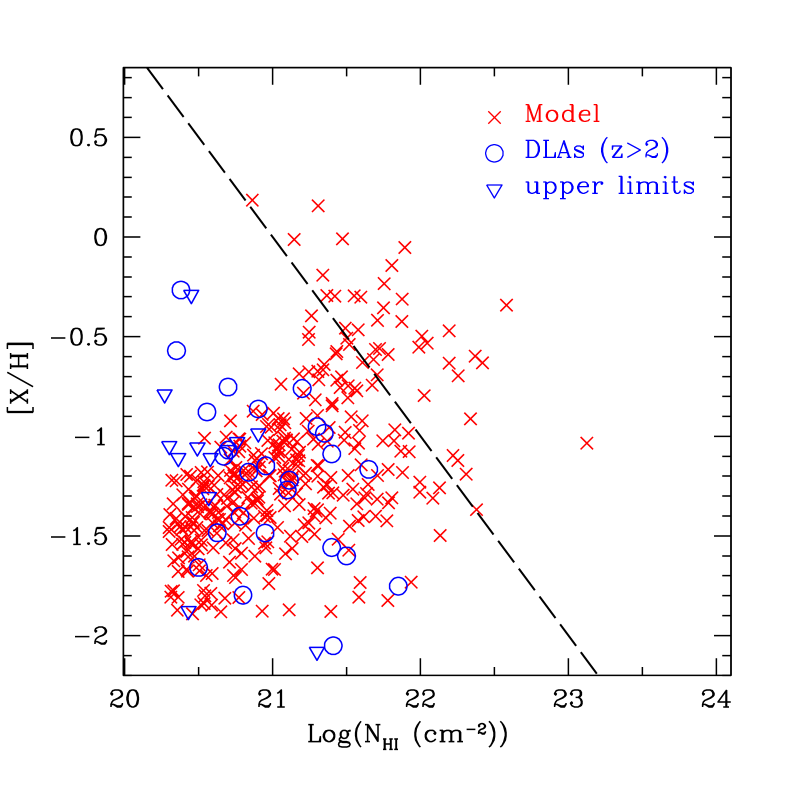
We examine the predicted correlation between metallicity and HI column density for the selected DLA sample in Fig.7 with the observed results of DLAs at by open circles. As expected, model predictions show an opposite trend compared with observations because high gas surface density will have high SFR which will lead to high metallicity. This is also the main reason why galaxies always display negative metal gradients. If we apply the proposed bias of in Fig.7 (long dashed line), to exclude the points above this line, the difference still exists. This means that the suggestions of Boissé et al (1998) did not help a lot in alleviating the discrepancy in our model.
Because of the simplification of our model, there still are some possibilities that could lead to the observed anti-correlation which are not considered here. First, the absorptions take place within galactic central regions where HI column densities are low and metallicities are high. Observations of some spiral galaxies have shown that in the central regions there exists central HI depressions, but significant star formations is still ongoing (Broeils & van Woerden 1994; Wolfe & Prochaska 1998; Wong & Blitz 2002). It should be noted that the absorption cross sections, hence the probability, are low for this mechanism.
Another possibility could be the inadequacy of the adopted Schmidt type star formation prescription. Even for nearby galaxies, the physical basis of star formation is still poorly known. Observers have shown various empirical prescriptions for star formation in spirals (Kennicutt 1998; Rownd & Young 1999; Wong & Blitz 2002), and most of galaxies can be fitted by a Schmidt type law. This has been widely applied in semi-analytic model of galaxy evolution (Kauffmann 1996; Boissier & Prantzos 1999; Chang et al. 1999, 2004). In fact, gas surface density () includes both the contributions of HI () and () with being dominant but the correlation between these two is different from galaxy to galaxy. Recent observations of star formation regions in nearby galaxies done by Wong & Blitz (2002) showed a complex relationship between SFR and . For their spiral galaxies sample (biased to molecule-rich galaxies), SFR shows virtually no correlation with , suggesting a maximum HI column density around . This is very instructive to the star formation history for DLAs, where the observed HI column density seems have an upper limit.
It should be pointed out that we assume in the present paper that all DLAs are hosted by disks. This seems to be too serious for DLA population since some observations suggested that DLAs could be hosted by either disks, spheroids or moving clouds within galactic halos (Maller et al. 2003). Star formation and chemical enrichment are quite different for different kinds of hosts, which could lead to the observed anti-correlation between metallicity and HI column density for DLAs. For instance, if the few observed (two or three) points in Fig.7 with very high metallicity () and with low HI column density () are not hosted by disks we assumed, the model predictions seem to roughly match observations. Furthermore, some observed points show low metallicity and high HI mass, which could be gas rich and metal poor galaxies with their star formation timescales longer than 3Gyr like low surface brightness galaxies. From this point of view, it seems that the discrepancy between model predictions and observations could not be very serious. More observations are needed.
3.7 Disk mass fraction and star formation timescale
In the present paper, there is a very important parameter imposed in our model, which is the disk mass fraction . As mention above, the adoption of eq. (8) is based on the consideration of supernovae feedback which is still poorly understood. Except , the star formation timescale is another parameter in the model which will influence the final results. In this subsection, we will discuss the effects of and the star formation timescale on our obtained results as follows.
Initially, baryon fraction within individual halos is always considered to be the same as 0.1. At high redshift, significant fraction of baryons () can be cooled down radiatively because of high densities (White & Frenk 1991). Due to supernovae feedback, the effective mass fraction which can really form disks and stars is less. As a test, we assume that the mass fraction of individual resulting disks is a constant 0.05, i.e., to force . We find that the resulted distribution of modelled DLAs now is dominated by small halos more strongly because smaller galaxies can host more DLAs due to higher surface densities without considering the supernovae feedback (see Figure 1(a) ). Other predicted results, such as distribution, column density distribution , , and the contributed SFR density, only change slightly.
As a further check, we assume in eq. (8) with the consideration of supernovae feedback. We find that all the physical results obtained do not change significantly. It is mainly because the change of with a factor of 2 will not change the absorption cross section very much (see eq. (14) of MMW). The corresponding SFR density will change by a factor less than 2 (eq. 2.2), which is about 0.30 in the logarithmic plot in Figure 5. The uncertainty of should be within the range we consider above. So, we conclude that the change of within its reasonable range will not change our model results significantly.
For the effective yield, it will change with the change of different adoptions of because it is obtained by best-fitting the modelled distribution of DLA metallicities to observational ones. Larger is the , smaller is the effective yield sice star formation will be more active for higher gas surface densities. It can be easy to estimate that the difference of effective yield for the different adoption of is less than 20% according to eqs. (2.2) and (11) if the star formation timescale for DLAs is considered to be some Gyr (see below).
Moreover, we have also tested the changes of stellar yield for different adopted ranges of star formation timescales. Following combinations of timescales, which are within reasonable ranges, have been tested: (0.5,2.0), (0.5,3.0), (1.0,2.0) Gyr. It is found that the resulted effective stellar yields were consistent with each other within the relative error of 15%. The general tendency is that the required effective stellar yield increase when the star formation timescale or the average age of DLAs decreases. The corresponding resulted , , and SFR densities are also agree with each other, respectively, within this error. It means that some changes of the star formation timescale will not influence our conclusions.
4 CONCLUSIONS
Within the framework of disk galaxy formation theory developed by Mo, Mao & White (1998), disks formed in the center of dark matter halos and are uniquely determined by two parameters: halo circular velocity and spin parameter . For a specific CDM cosmogony, we can generate a population of galaxies by Monte Carlo simulations according to the PS formalism of and the distribution of at a given redshift 3. Star formation and chemical evolution proceed within disks assuming a typical timescale . We select modelled DLAs according to their observational criterion with the random inclination being considered, i.e., , to investigate their global properties such as HI column density and metallicity. The main results are summarized as follows:
We get the effective yield by best-fitting resulted metallicity distributions to the observed one of DLAs. Our model can well reproduce the observed metallicity distribution of DLAs. The relatively low value of the effective yield indicates that galactic winds could play an important role during star formation in disks which could relate to the kinematics of DLAs observed.
On the basis of simulated DLAs, we have calculated the frequency distribution of HI column densities which is a bit flatter than the observed ones (SW00). This could be due to the model limitations. For instance, disk instability for star formation criterion is not considered (Ma & Shu 2001). The number density and mass density contributed by DLAs at are also discussed, in which the predicted number density agrees well with observations and the predicted mass density contribution is larger. Our model suggests that DLAs could naturally arise in a CDM universe from radiatively cooled gas in dark matter halos.
Furthermore, the predicted SFR density at contributed by DLAs is consistent with the most recent observations (WGP03). Because the SFR density contributed by DLAs has the same order as that by LBGs, it is interesting to compare the UV luminosity functions of these two populations. We find that the typical DLA host galaxy is much fainter than LBGs. It implies that very few DLA hosts can be observed as LBGs which is consistent with current observations. We suggest that these two population of galaxies should be physically different.
It should be pointed out that model predicted correlation between metallicity and HI column density for DLAs cannot match observations well, even if the proposed observational bias suggested by Boissé et al. (1998) is taken into account. We suggest that the observed trend of anti-correlation could most probably be physical. Some possible mechanisms with the model simplicities were discussed. Still, more observations are needed to clarify this trend in the future.
Acknowledgements
We are grateful to B. Ménard, W.P. Lin, H.J. Mo, and D.H. Zhao for useful discussions on the subject. S. Boissier is specially thanked for very useful comments and helping us with the data. Many thanks should be given to the referee whose critical arguments greatly improve the manuscripts. This work is supported by NSFC10173017, 10133020, 10073016, NKBRSF 1999075404 and NSC91-2112-M008-036. CS acknowledges the financial support of NSC for a visit to NCU and the kind hospitality during the stay in NCU.
References
- (1) Adelberger K.L. & Steidel C.C. 2000, ApJ, 544, 218
- (2) Barger A.J., Cowie L.L. & Richards E.A. 2000, AJ, 119, 2092
- (3) Baugh C.M., Benson A.J., Cole S., Frenk C.S., Lacey C.G., 1999, MNRAS 305, L21
- (4) Baugh C.M., Cole S., Frenk C.S. & Lacey C.G. 1998, ApJ, 498, 504
- (5) Bechtold J., Elston R., Yee H.K.C., Ellingson E. & Cutri R.M. 1998, ASP Conf. Ser. Vol. 146, P241
- (6) Binney J.J. & Merrifield M. 1998, Galactic Astronomy, Princeton Univ Press, Princeton, NJ
- (7) Boissé P., Le Brun V., Bergeron J. & Deharveng J.M. 1998, A&A, 333, 841
- (8) Boissier S., Péroux C. & Pettini M. 2003, MNRAS, 338, 131
- (9) Boissier S. & Prantzos N. 2000, MNRAS, 312, 398
- (10) Boissier S. & Prantzos N. 1999, MNRAS, 307, 857
- (11) Broeils A.H. & van Woerden H. 1994, AApSS, 107, 129
- (12) Burles S. & Tytler D. 1998, ApJ 507, 732
- (13) Calura F., Matteucci F. & Vladilo G. 2003, MNRAS, 340, 59
- (14) Cen R., Ostriker J.P., Prochaska J.X. & Wolfe A.M. 2003, ApJ, 598, 741
- (15) Chang R.X., Shu C.G., Chen W.P., Hou J.L. & Fu C.Q. 2004, submitted
- (16) Chang R.X., Hou J.L., Shu C.G. & Fu C.Q. 1999, A&A, 350, 38
- (17) Chen H-W., Lanzetta K.M. 2003, ApJ, 597, 706
- (18) Churches D.K., Nelson A.H. & Edmunds M.G. 2004, MNRAS, 347, 1234
- (19) Churchill C. W., Mellon R. R., Charlton J. C. & Vogt S.S. 2003, ApJ, 593, 203
- (20) Cole S., Lacey C.G., Baugh C.M. & Frenk C.S. 2000, MNRAS, 319, 168
- (21) Cora S.A., Tissera P.B., Lambas D.G. & Mosconi M.B. 2003, MNRAS, 343, 959
- (22) Dekel A., Silk J., 1986, ApJ, 303, 39
- (23) Dessauges-Zavadsky M., Calura F., Prochaska J.X., D’Odorico S. & Matteucci F. 2004, A&A, 416, 79
- (24) Efstathiou G. 2000, MNRAS, 317, 697
- (25) Ellison S., Yan L., Hook I., Pettini M., Wall J. & Shaver P. 2001, A&A, 379, 393
- (26) Freeman K. 1970, ApJ, 160, 811
- (27) Gardner J.P., Katz N., Weinberg D.H. & Hernquist L. 1997, ApJ, 486, 42
- (28) Gardner J.P., Katz N., Weinberg D.H. & Hernquist L. 2001, ApJ, 559, 131
- (29) Haehnelt M., Steinmetz M & Rauch M. 1998, ApJ, 495, 647
- (30) Henry R.B.C. & Worthey G. 1999, PASP, 111, 919
- (31) Hou J.L., Boissier S. & Prantzos N. 2001, A&A, 370, 23
- (32) Hou J.L., Prantzos & Boissier S. 2000, A&A, 362, 921
- (33) Jedamzik K. & Prochaska J.X. 1998, MNRAS, 296, 430
- (34) Jing Y.P. 2000, ApJ, 535, 30
- (35) Kauffmann G. 1996, MNRAS, 281, 474
- (36) Kennicutt R. 1998, ApJ, 498, 541
- (37) Kulkarni V.P. & Fall S.M. 2002, ApJ, 580, 732
- (38) Kulkarni V.P., Hill J.M., Schneider G., Weymann R.J., Storrie-Lombardi L.J., et al. 2000, ApJ, 536, 36
- (39) Kulkarni V.P., Hill J.M., Schneider G., Weymann R.J., Storrie-Lombardi L.J., et al. 2001, ApJ, 551, 37
- (40) Lanfranchi G.A. & Friaca A.C.S. 2003, MNRAS, 343, 481
- (41) Le Brun V., Bergeron J., Boisse P. & Deharveng J.M. 1997, A&A, 321, 733
- (42) Ledoux C., Petitjean P. & Srianand R. 2003, MNRAS, 346, 209
- (43) Lemson G. & Kauffmann G. 1999, MNRAS 302, L111
- (44) Lilly S., Le Fevre O., Hammer F. & Crampton D. 1996, ApJ, 460, L1
- (45) Lu L., Sargent W.L.W., Barlow T.A., Churchill C.W. & Vogt S.S. 1996, ApJS, 107, 475
- (46) Ma J. & Shu C.G. 2001, MNRAS, 322, 927
- (47) Madau P., Pozzetti L., Dickinson M. 1998, ApJ, 499, 106
- (48) Maller A.H., Prochaska J.X., Somerville R.S. & Primack J.R. 2001, MNRAS, 326, 1475
- (49) Maller A.H., Prochaska J.X., Somerville R.S. & Primack J.R. 2003, MNRAS, 343, 268
- (50) Mathlin G.P., Baker A.C., Churches D.K. & Edmunds M.G. 2001, MNRAS, 321, 743
- (51) Matteucci F., Molaro P. & Vladilo G. 1997, A&A, 321, 45
- (52) Meusinger H. & Thon R. 1999, A&A, 351, 841
- (53) Mo H.J. & Miralda-Escude J. 1994, ApJ, 430, L25
- (54) Mo H.J., Mao S.D.& White S.D.M. 1999, MNRAS, 304, 175
- (55) Mo H.J., Mao S.D.& White S.D.M. 1998, MNRAS, 295, 319(MMW)
- (56) Möller P., Warren S.J., Fall S.M., Fynbo J.U. & Jakobsen, P. 2002, ApJ, 574, 51
- (57) Möller P. & Warren S.J. 1998, MNRAS, 299, 661
- (58) Nagamine K., Springel V. & Hernquist L. 2003, MNRAS, 348, 435
- (59) Navarro J.F., Frenk C.S. & White S.D.M. 1997, MNRAS, 487, 73(NFW)
- (60) Nissen P.E., Chen Y.Q., Asplund M. & Pettini M. 2004, A&A, 415, 993
- (61) Nulsen P.E.J., Barcon X. & Fabian A.C. 1998, MNRAS, 301, 168
- (62) Okoshi K., Nagashima M., Gouda N. & Yoshioka S. 2004, ApJ, 603, 12
- (63) Pagel B.E.J. 1997, Nucleosynthesis and Chemical Evolution of Galaxies. Cambridge Univ. Press, Cambridge
- (64) Pagel B.E.J. 1987, in Gilmore FG. Carswell B., eds, The Galaxy, Cambridge Univ. Press, Cambridge, p341
- (65) Péroux C., Petitjean P., Aracil B. & Srianand R. 2002, NewA., 7, 577
- (66) Péroux C., McMahon R., Storrie-Lombardi L. & Irwin J. 2003, MNRAS, 346, 1103
- (67) Petitjean P., Srianand R. & Ledoux, C. 2002 MNRAS, 332, 383
- (68) Pettini M., King D.L., Smith L.J. & Hunstead R.W. 1997a ApJ, 478, 536
- (69) Pettini M., Smith L.J., King D.L. & Hunstead R.W. 1997b ApJ, 486, 665
- (70) Pettini M., Smith L.J., Hunstead R.W. & King D.L. 1994 ApJ, 426, 79
- (71) Prantzos N. & Boissier S. 2000, MNRAS, 315, 82
- (72) Press W.H. & Schechter P. 1974, ApJ, 187, 425
- (73) Prochaska J.X., Naumov S.O., Carney B.W., McWilliam A. & Wolfe A.M. 2000, AJ, 120, 2513
- (74) Prochaska J.X. & Wolfe A.M. 1997, ApJ, 487, 73
- (75) Prochaska J.X. & Wolfe A.M. 1998, ApJ, 507, 113
- (76) Prochaska J.X. & Wolfe A.M. 2002, ApJ, 566, 68
- (77) Prochaska J.X. 2003, ApJ, 582, 49
- (78) Prochaska J.X., Gawiser E., Wolfe A.M., Castro S. & Djorgovski S.G. 2003a, ApJ, 595, L9
- (79) Prochaska J.X., Gawiser E., Wolfe A.M., Cooke J. & Gelino D. 2003b, ApJS, 147, 227
- (80) Rao S.M., Nestor D.B., Turnshek D.A., Lane W.M., Monier E.M., & Bergeron J. 2003, ApJ, 595, 94
- (81) Rao S.M. & Turnshek D.A. 1998, ApJ, 500, L115
- (82) Rees M.J. 1986, MNRAS, 218, 25
- (83) Rownd B.K. & Young J.S. 1999, AJ, 118, 670
- (84) Savage B.D. & Sembach K.R. 1996, ARA&A, 34, 279
- (85) Schaye J. 2001a, ApJ, 562, L95
- (86) Schaye J. 2001b, ApJ, 559, L1
- (87) Shu C.G. 2000, A&A, 354, 815
- (88) Shu C.G., Mao S.D. & Mo H.J. 2001, MNRAS, 327, 895
- (89) Shu C.G., Mo H.J. & Mao S.D. 2003, astro-ph/0301035
- (90) Somerville R.S. & Primack J.R. 1999, MNRAS, 310, 1087
- (91) Somerville R.S., Primack J.R., Faber S.M. 2001, MNRAS, 320, 504
- (92) Steidel C.C, Adelberger K.L., Giavalisco M., Dickinson M. & Pettini M. 1999, ApJ, 519, 1
- (93) Storrie-Lombardi L.J. & Wolfe A.M. 2000, ApJ, 534, 552(SW00)
- (94) Umeda H. & Nomoto K. 2002, ApJ, 565, 385
- (95) Vladilo G. 1998, ApJ, 493, 583
- (96) Vladilo G. 2002, A&A, 391, 407
- (97) Wakker B.P. & Mathis J.S. 2000, ApJ, 544, L107
- (98) Warren M.S., Quinn P.J., Salmon J.K., Zurek W.H. 1992, ApJ, 509, 19
- (99) White S.D.M. & Frenk C.S. 1991, ApJ, 379, 52
- (100) White S.D.M. & Rees M.J. 1978, MNRAS, 183, 341
- (101) Wolfe A.M., Gawsier E. & Prochaska J.X. 2003, ApJ, 593, 235(WGP03)
- (102) Wolfe A.M. & Prochaska J.X. 1998, ApJ, 494, L15
- (103) Wolfe A.M. & Prochaska J.X. 2000, ApJ, 545, 603
- (104) Wong T. & Blita L. 2002, ApJ, 569, 157